Money
Mapping the Migration of the World’s Millionaires


Mapping the Migration of the World’s Millionaires
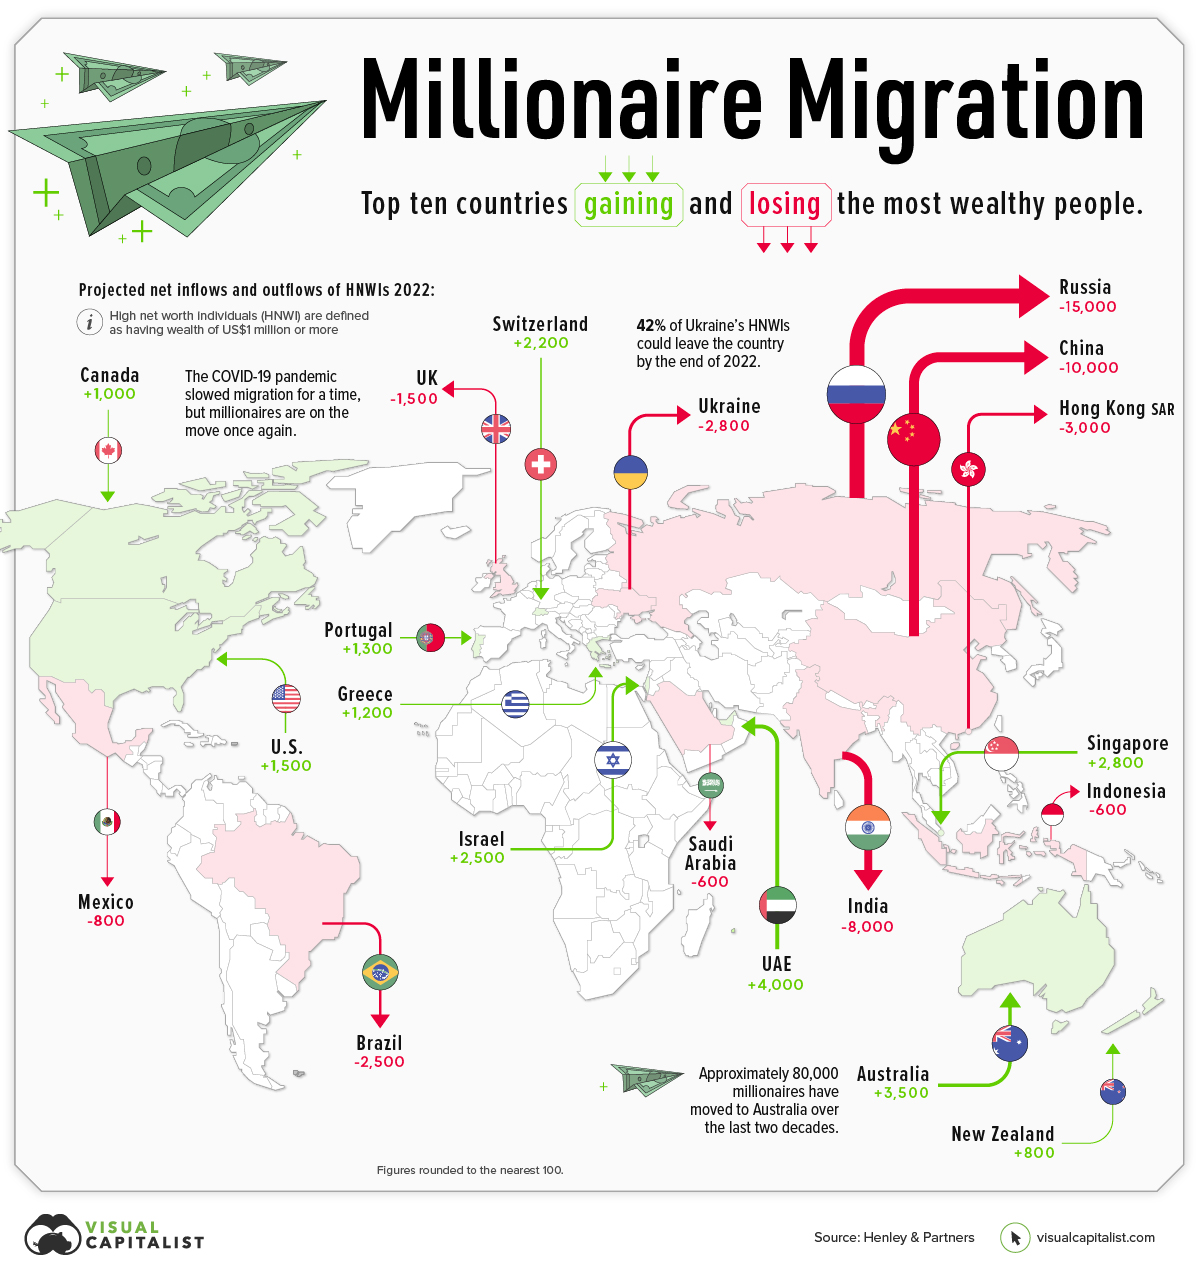
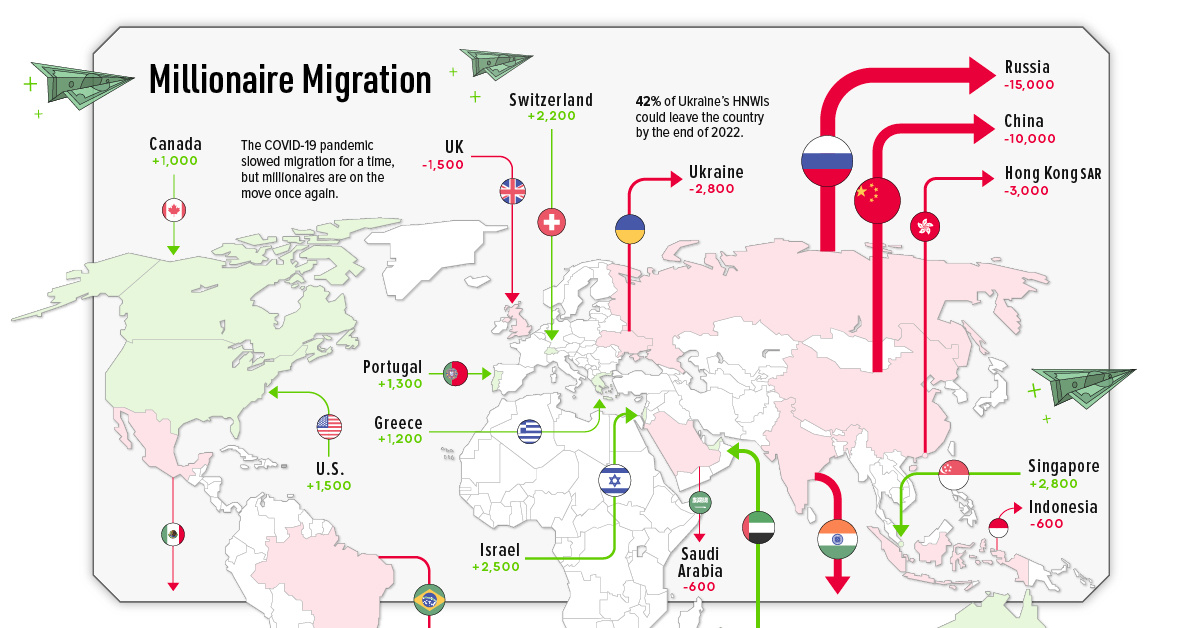
Throughout 2022, a projected 88,000 millionaires will move to a new country, according to the latest Henley Global Citizens Report.
Which countries are these millionaires moving to, and where in the world are they coming from?
This graphic maps the migration of high net worth individuals (HNWIs)—people with a net worth of over US$1 million—showing where rich people are flocking, and where they’re fleeing.
Migration of Millionaires is Back
Before diving into the country-specific data, it’s worth taking a step back to look at overall millionaire migration trends, and how things are changing this year.
2020 saw a drastic drop in the number of millionaire migrants, as pandemic-induced lockdowns kept people from leaving their home countries—and at times, their homes in general.
But as restrictions ease and countries begin to open up their borders again, the migration of millionaires is beginning to gather steam once again:
| Year | # of HNWIs that migrated | Y-o-y change |
|---|---|---|
| 2018 | 108,000 | 14% |
| 2019 | 110,000 | 2% |
| 2020 | 12,000 | -89% |
| 2021 | 25,000 | 108% |
| 2022P | 88,000 | 252% |
| 2023P | 125,000 | 42% |
Below, we’ll dive into which countries are seeing the highest number of HNWI migrants, and which ones are losing the most HNWIs.
Which Countries Are Millionaires Leaving?
There are a plethora of reasons why the ultra-rich move countries. Escaping conflict is one of them, which is why it’s no surprise to see Russia and Ukraine are projected to see some of the biggest emigration numbers by the end of 2022.
Here are the top 10 countries by millionaire outflows:
| Country | Projected net outflows of HNWIs (2022) | % of HNWIs lost |
|---|---|---|
| 🇷🇺 Russia | 15,000 | 15% |
| 🇨🇳 China | 10,000 | 1% |
| 🇮🇳 India | 8,000 | 2% |
| 🇭🇰 Hong Kong | 3,000 | 2% |
| 🇺🇦 Ukraine | 2,800 | 42% |
| 🇧🇷 Brazil | 2,500 | 2% |
| 🇬🇧 UK | 1,500 | 0% |
| 🇲🇽 Mexico | 800 | 0% |
| 🇸🇦 Saudi Arabia | 600 | 1% |
| 🇮🇩 Indonesia | 600 | 1% |
Figures rounded to the nearest 100.
While Russia is expected to see 15,000 millionaires leaving the country, Ukraine is projected to experience the highest loss in percentage terms—a whopping 42% of its HNWIs could leave the country by the end of 2022.
China could also see a big loss in its millionaire population, with a projected loss of 10,000.
According to Andrew Amoils, Head of Research at New World Wealth, this could be more damaging to the country than in previous years, since general wealth growth in China has declined recently.
Where Are The Ultra-Rich Moving?
The United Arab Emirates (UAE) has become a millionaire magnet, with a projected 4,000 HNWIs flowing into the country by the end of 2022. This influx of ultra-wealthy people is partly because of the country’s accommodating immigration policies that are specially tailored to attract private wealth and international talent.
Here are the top 10 countries that saw millionaire inflows:
| Country | Projected net inflows of HNWIs (2022) | % of HNWI Gained |
|---|---|---|
| 🇦🇪 UAE | 4,000 | 4% |
| 🇦🇺 Australia | 3,500 | 1% |
| 🇸🇬 Singapore | 2,800 | 1% |
| 🇮🇱 Israel | 2,500 | 2% |
| 🇺🇸 USA | 1,500 | 0% |
| 🇵🇹 Portugal | 1,300 | 2% |
| 🇬🇷 Greece | 1,200 | 3% |
| 🇨🇦 Canada | 1,000 | 0% |
| 🇳🇿 New Zealand | 800 | 1% |
Australia continues to attract HNWIs, coming in second behind the UAE. According to New World Wealth, approximately 80,000 millionaires have moved to the Land Down Under in the last two decades.
A few things that attract migrants to Australia are the country’s low costs of healthcare, its lack of inheritance tax, and its generally prosperous economy.
Where does this data come from?
Source: Henley Global Citizens Report 2022
Data notes: As countries reopen, and the invasion of Ukraine wears on, this will have ripple effects on where people choose to live. There are two main things to keep in mind when view the information above. 1) Individuals need to remain in a country for six months in order to be updated in the database. In many cases, it’s not yet clear where people leaving certain countries choosing to relocate. 2) In the graphic above, we’ve visualized the top 10 countries for inflows and outflows.
Update: This article and graphic have been updated to more clearly explain what’s being shown, and list the data source in a more prominent way. We appreciate your feedback.


Economy
Ranked: The Top 20 Countries in Debt to China
The 20 nations featured in this graphic each owe billions in debt to China, posing concerns for their economic future.
Ranked: The Top 20 Countries in Debt to China
This was originally posted on our Voronoi app. Download the app for free on iOS or Android and discover incredible data-driven charts from a variety of trusted sources.
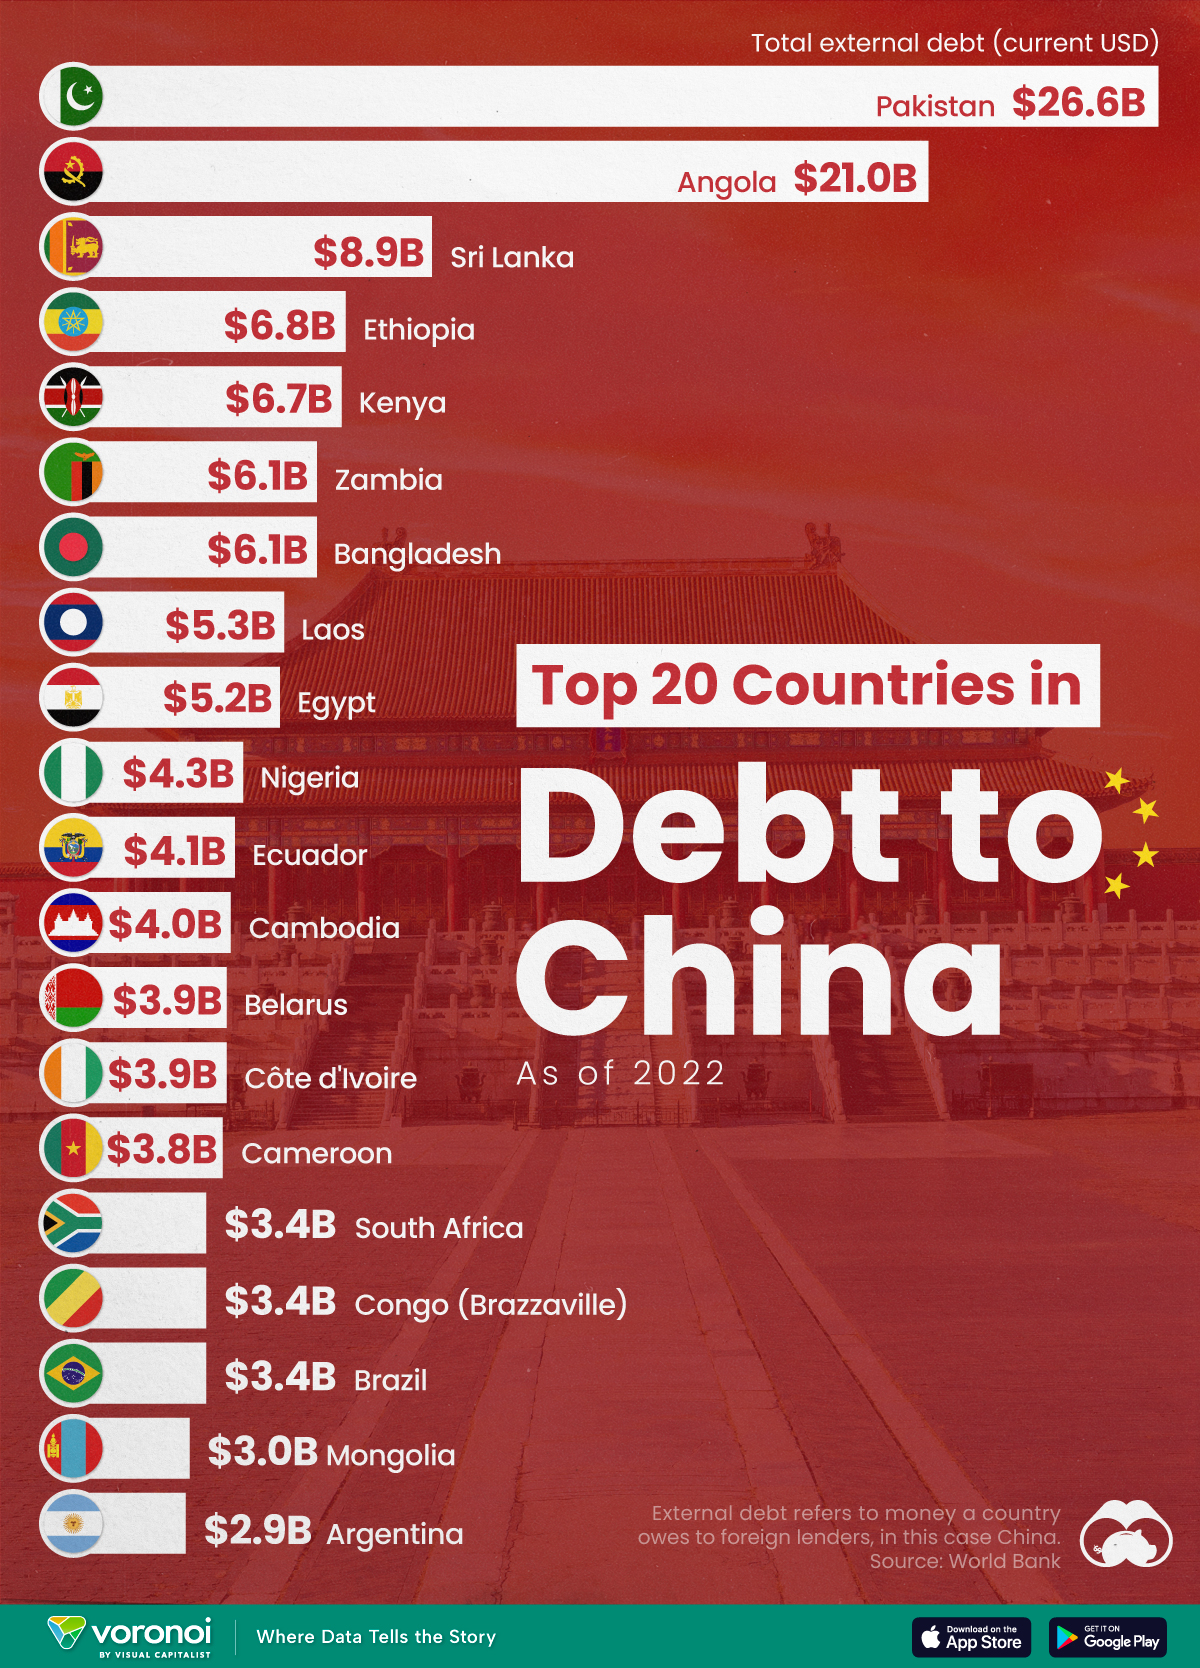
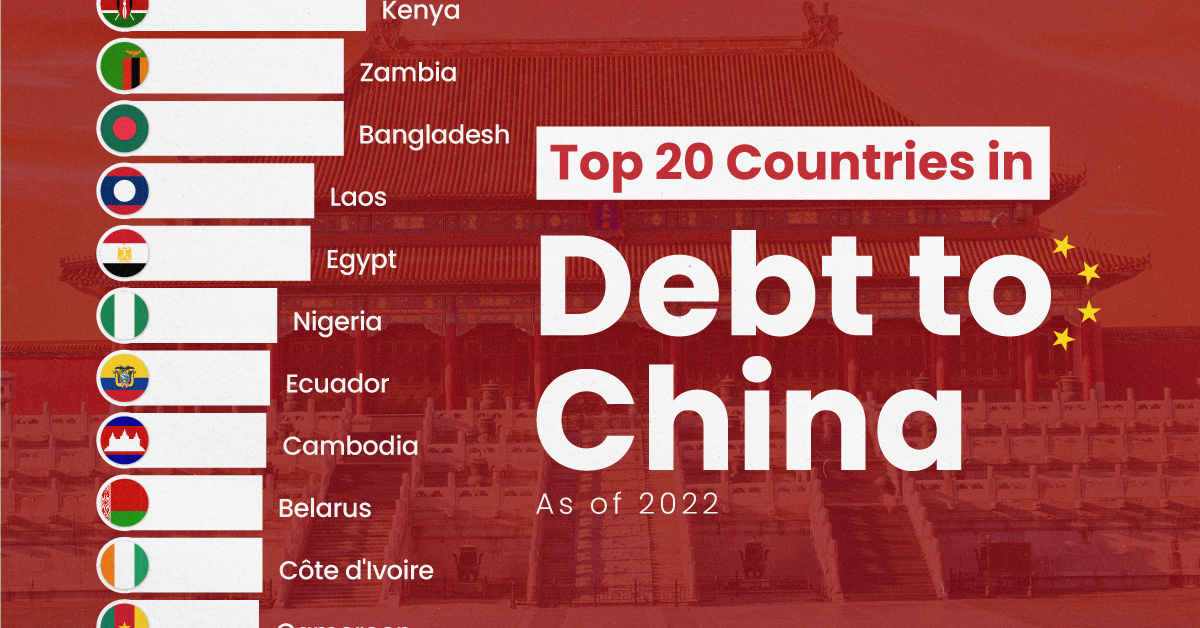
In this graphic, we ranked the top 20 countries by their amount of debt to China. These figures are as of 2022, and come from the World Bank (accessed via Yahoo Finance).
The data used to make this graphic can be found in the table below.
| Country | Total external debt to China ($B) |
|---|---|
| 🇵🇰 Pakistan | $26.6 |
| 🇦🇴 Angola | $21.0 |
| 🇱🇰 Sri Lanka | $8.9 |
| 🇪🇹 Ethiopia | $6.8 |
| 🇰🇪 Kenya | $6.7 |
| 🇧🇩 Bangladesh | $6.1 |
| 🇿🇲 Zambia | $6.1 |
| 🇱🇦 Laos | $5.3 |
| 🇪🇬 Egypt | $5.2 |
| 🇳🇬 Nigeria | $4.3 |
| 🇪🇨 Ecuador | $4.1 |
| 🇰🇭 Cambodia | $4.0 |
| 🇨🇮 Côte d'Ivoire | $3.9 |
| 🇧🇾 Belarus | $3.9 |
| 🇨🇲 Cameroon | $3.8 |
| 🇧🇷 Brazil | $3.4 |
| 🇨🇬 Republic of the Congo | $3.4 |
| 🇿🇦 South Africa | $3.4 |
| 🇲🇳 Mongolia | $3.0 |
| 🇦🇷 Argentina | $2.9 |
This dataset highlights Pakistan and Angola as having the largest debts to China by a wide margin. Both countries have taken billions in loans from China for various infrastructure and energy projects.
Critically, both countries have also struggled to manage their debt burdens. In February 2024, China extended the maturity of a $2 billion loan to Pakistan.
Soon after in March 2024, Angola negotiated a lower monthly debt payment with its biggest Chinese creditor, China Development Bank (CDB).
Could China be in Trouble?
China has provided developing countries with over $1 trillion in committed funding through its Belt and Road Initiative (BRI), a massive economic development project aimed at enhancing trade between China and countries across Asia, Africa, and Europe.
Many believe that this lending spree could be an issue in the near future.
According to a 2023 report by AidData, 80% of these loans involve countries in financial distress, raising concerns about whether participating nations will ever be able to repay their debts.
While China claims the BRI is a driver of global development, critics in the West have long warned that the BRI employs debt-trap diplomacy, a tactic where one country uses loans to gain influence over another.
Editor’s note: The debt shown in this visualization focuses only on direct external debt, and does not include publicly-traded, liquid, debt securities like bonds. Furthermore, it’s worth noting the World Bank data excludes some countries with data accuracy or reporting issues, such as Venezuela.
Learn More About Debt from Visual Capitalist
If you enjoyed this post, check out our breakdown of $97 trillion in global government debt.

-

 Culture7 days ago
The World’s Top Media Franchises by All-Time Revenue
-

 Science2 weeks ago
Visualizing the Average Lifespans of Mammals
-

 Brands2 weeks ago
How Tech Logos Have Evolved Over Time
-

 Energy2 weeks ago
Ranked: The Top 10 EV Battery Manufacturers in 2023
-

 Countries2 weeks ago
Countries With the Largest Happiness Gains Since 2010
-

 Economy2 weeks ago
VC+: Get Our Key Takeaways From the IMF’s World Economic Outlook
-

 Demographics2 weeks ago
The Countries That Have Become Sadder Since 2010
-

 Money2 weeks ago
Charted: Who Has Savings in This Economy?