Markets
Mapped: The Migration of the World’s Millionaires in 2023
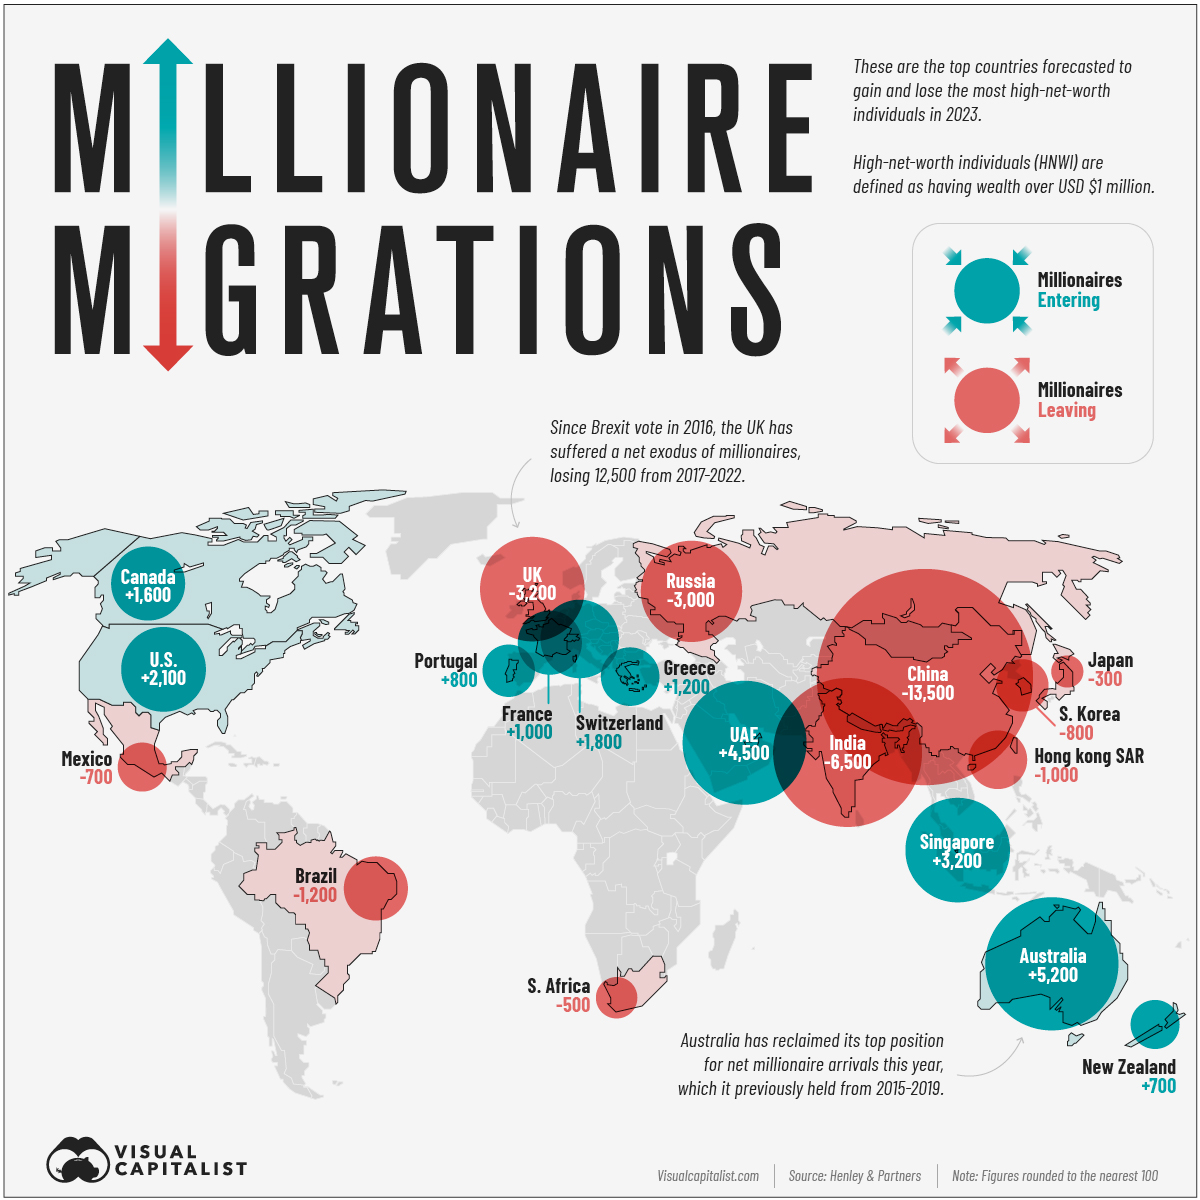


Mapping the Migration of the World’s Millionaires 2023
Just like everyone else, High Net Worth Individuals (HNWIs) traveled less than usual during the pandemic, and as a result their migration numbers trended downwards. But millionaires and billionaires are on the move again and it is anticipated that 122,000 HNWIs will move to a new country by the end of the year.
Henley & Partners’ Private Wealth Migration Report has tracked the countries HNWIs have moved from and to over the last 10 years; this map showcases the 2023 forecasts.
In this context, HNWIs are defined as individuals with a net worth of at least $1 million USD.
The Countries Welcoming New Millionaires
The top 10 countries which are likely to become home to the highest number of millionaires and billionaires in 2023 are scattered across the globe, with Australia reclaiming its top spot this year from the UAE.
Here’s a closer look at the data:
| Rank | Country | Projected HNWI Inflow 2023 |
|---|---|---|
| 1 | 🇦🇺 Australia | 5,200 |
| 2 | 🇦🇪 UAE | 4,500 |
| 3 | 🇸🇬 Singapore | 3,200 |
| 4 | 🇺🇸 U.S. | 2,100 |
| 5 | 🇨🇭 Switzerland | 1,800 |
| 6 | 🇨🇦 Canada | 1,600 |
| 7 | 🇬🇷 Greece | 1,200 |
| 8 | 🇫🇷 France | 1,000 |
| 9 | 🇵🇹 Portugal | 800 |
| 10 | 🇳🇿 New Zealand | 700 |
Only two Asian countries make the top 10, with the rest spread across Europe, North America, and Oceania.
Despite historic economic challenges, Greece is projected to gain 1,200 High Net Worth Individuals this year. One reason could be the country’s golden visa program, wherein wealthy individuals can easily obtain residence and eventually EU passports for the right price—currently a minimum real estate investment cost of 250,000 euros is all that’s required.
Many of the leading millionaire destinations are attractive for wealthy individuals because of higher levels of economic freedom, allowing for laxer tax burdens or ease of investment. Singapore, which expects to gain 3,200 millionaires, is the most economically free market in the world.
The Countries Losing the Most Millionaires
China is anticipated to lose 13,500 High Net Worth Individuals this year, more than double as many as the second place country, India (6,500).
Here’s a closer look at the bottom 10:
| Rank | Country | Projected HNWI Outflow 2023 |
|---|---|---|
| 1 | 🇨🇳 China | -13,500 |
| 2 | 🇮🇳 India | -6,500 |
| 3 | 🇬🇧 UK | -3,200 |
| 4 | 🇷🇺 Russia | -3,000 |
| 5 | 🇧🇷 Brazil | -1,200 |
| 6 | 🇭🇰 Hong Kong SAR | -1,000 |
| 7 | 🇰🇷 South Korea | -800 |
| 8 | 🇲🇽 Mexico | -700 |
| 9 | 🇿🇦 South Africa | -500 |
| 10 | 🇯🇵 Japan | -300 |
In a number of these countries, strict regulatory bodies and corrupt governments can hinder the ease with which HNWIs can manage their own money.
In Russia, many wealthy individuals are facing personal tariffs and trade restrictions from Western countries due to the war in Ukraine. China’s crackdowns on Hong Kong have made it a less attractive place for business. And finally, the UK’s exit from the EU has caused many businesses and individuals to lose the easy movement of labor, finances, and investment that made operations across European borders seamless.
Some of these countries may still be adding homegrown millionaires and billionaires, but losing thousands of HNWIs to net migration does have a considerable economic impact.
Overall, millionaires are increasingly on the move. In the 10 years of reporting—despite a dip during the pandemic—the number of HNWIs moving away from their countries of origin has been growing every year.
Here’s a look at the numbers:
| Year | Projected HNWI Migration |
|---|---|
| 2013 | 51,000 |
| 2014 | 57,000 |
| 2015 | 64,000 |
| 2016 | 82,000 |
| 2017 | 95,000 |
| 2018 | 108,000 |
| 2019 | 110,000 |
| 2020 | 12,000 |
| 2021 | 25,000 |
| 2022 | 84,000 |
| 2023 (forecast) | 122,000 |
In a geopolitically fragile but more connected world, it’s no surprise to see millionaires voting with their feet. As a result, governments are increasingly in competition to win the hearts and minds of the world’s economic elite to their side.


Markets
Visualizing Global Inflation Forecasts (2024-2026)
Here are IMF forecasts for global inflation rates up to 2026, highlighting a slow descent of price pressures amid resilient global growth.


Visualizing Global Inflation Forecasts (2024-2026)
Global inflation rates are gradually descending, but progress has been slow.
Today, the big question is if inflation will decline far enough to trigger easing monetary policy. So far, the Federal Reserve has held rates for nine months amid stronger than expected core inflation, which excludes volatile energy and food prices.
Yet looking further ahead, inflation forecasts from the International Monetary Fund (IMF) suggest that inflation will decline as price pressures ease, but the path of disinflation is not without its unknown risks.
This graphic shows global inflation forecasts, based on data from the April 2024 IMF World Economic Outlook.
Get the Key Insights of the IMF’s World Economic Outlook
Want a visual breakdown of the insights from the IMF’s 2024 World Economic Outlook report?
This visual is part of a special dispatch of the key takeaways exclusively for VC+ members.
Get the full dispatch of charts by signing up to VC+.
The IMF’s Inflation Outlook
Below, we show the IMF’s latest projections for global inflation rates through to 2026:
| Year | Global Inflation Rate (%) | Advanced Economies Inflation Rate (%) | Emerging Market and Developing Economies Inflation Rate (%) |
|---|---|---|---|
| 2019 | 3.5 | 1.4 | 5.1 |
| 2020 | 3.2 | 0.7 | 5.2 |
| 2021 | 4.7 | 3.1 | 5.9 |
| 2022 | 8.7 | 7.3 | 9.8 |
| 2023 | 6.8 | 4.6 | 8.3 |
| 2024 | 5.9 | 2.6 | 8.3 |
| 2025 | 4.5 | 2.0 | 6.2 |
| 2026 | 3.7 | 2.0 | 4.9 |
After hitting a peak of 8.7% in 2022, global inflation is projected to fall to 5.9% in 2024, reflecting promising inflation trends amid resilient global growth.
While inflation has largely declined due to falling energy and goods prices, persistently high services inflation poses challenges to mitigating price pressures. In addition, the IMF highlights the potential risk of an escalating conflict in the Middle East, which could lead to energy price shocks and higher shipping costs.
These developments could negatively affect inflation scenarios and prompt central banks to adopt tighter monetary policies. Overall, by 2026, global inflation is anticipated to decline to 3.7%—still notably above the 2% target set by several major economies.
Adding to this, we can see divergences in the path of inflation between advanced and emerging economies. While affluent nations are forecast to see inflation edge closer to the 2% target by 2026, emerging economies are projected to have inflation rates reach 4.9%—falling closer to their pre-pandemic averages.
Get the Full Analysis of the IMF’s Outlook on VC+
This visual is part of an exclusive special dispatch for VC+ members which breaks down the key takeaways from the IMF’s 2024 World Economic Outlook.
For the full set of charts and analysis, sign up for VC+.

-

 Culture7 days ago
The World’s Top Media Franchises by All-Time Revenue
-

 Science2 weeks ago
Visualizing the Average Lifespans of Mammals
-

 Brands2 weeks ago
How Tech Logos Have Evolved Over Time
-

 Energy2 weeks ago
Ranked: The Top 10 EV Battery Manufacturers in 2023
-

 Countries2 weeks ago
Countries With the Largest Happiness Gains Since 2010
-

 Economy2 weeks ago
VC+: Get Our Key Takeaways From the IMF’s World Economic Outlook
-

 Demographics2 weeks ago
The Countries That Have Become Sadder Since 2010
-

 Money2 weeks ago
Charted: Who Has Savings in This Economy?