Misc
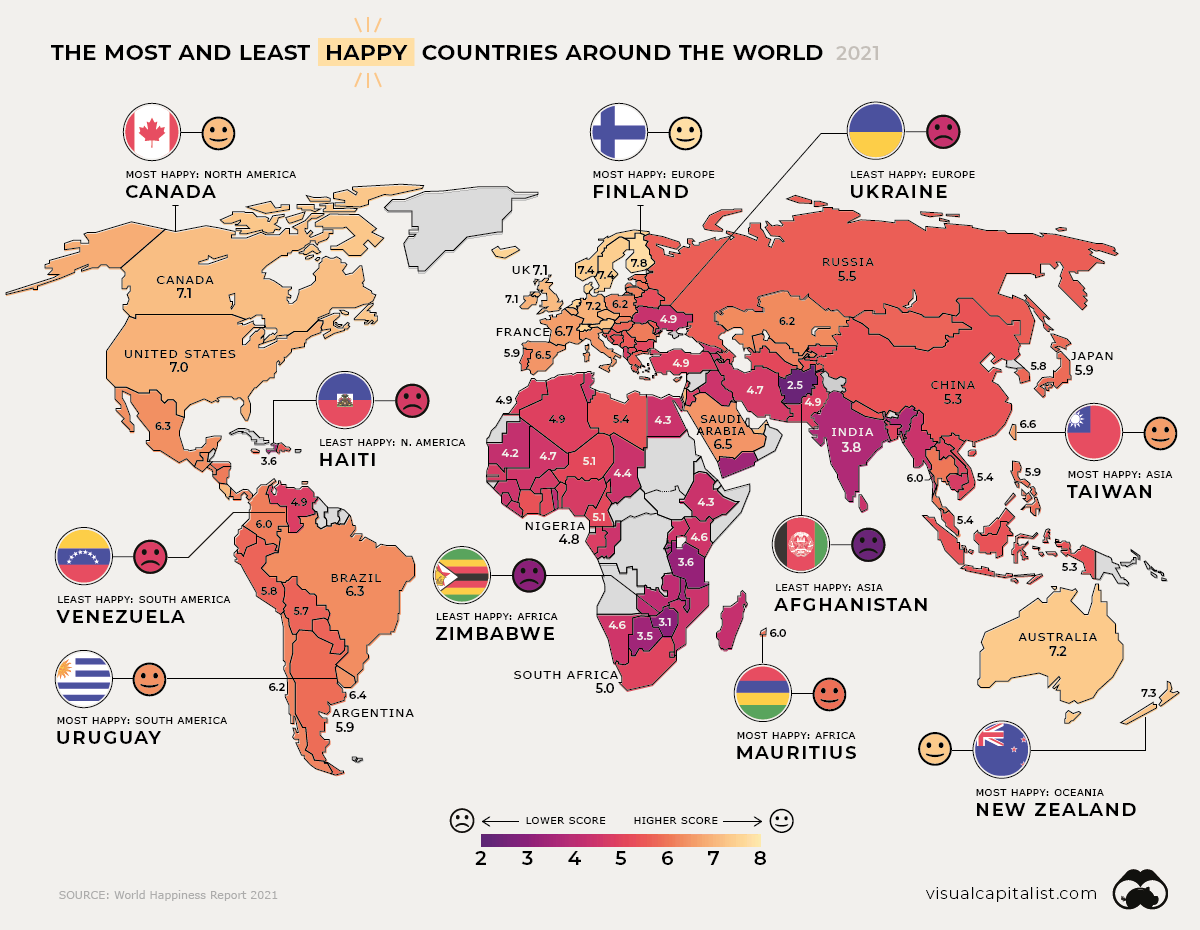
Mapped: Global Happiness Levels in 2021
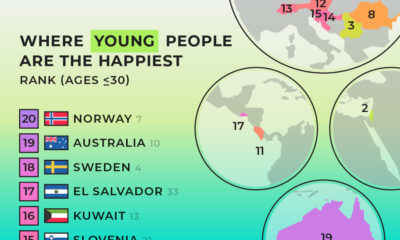
Check out the latest map of countries by happiness levels in 2023.


Mapped: Global Happiness Levels in 2021
Check out the latest map of countries by happiness levels in 2023.
“Are you happy?” is a deceptively complex question to both ask and answer.
It’s generally understood that having enough money to cover your needs and wants can help you live a relatively happy, comfortable life—and recent research shows this relationship may increase linearly as income levels grow, as well.
However, there’s much more to it than that. Happiness levels depend not just on financial security, but also broader perceptions of one’s social support, personal freedom, and more.
This series of map pulls data from the World Happiness Report to uncover the average scores of 149 countries between 2018-2020, and which ones emerged the happiest or unhappiest. We also look at the most and least improved countries in every region.
How is Happiness Measured?
First, let’s look at the factors used to calculate world happiness levels. Some clear indicators are health and wealth, both metrics that have been steadily on the rise worldwide. The report takes these into account, weighting GDP per capita and life expectancy at birth into the scores.
The report also looks at more intangible aspects, collecting survey responses around:
- Social support
- Freedom to make life choices
- Generosity
- Perceptions of government/ business corruption
- Positive or negative affects (Recent experience of emotions)
This year, there was a natural focus on the negative affect measure of the COVID-19 pandemic on happiness levels, such as exacerbating mental health risks. In addition, such measurements varied depending on each country’s response to the crisis.
Looking Closely at Regional Happiness Levels
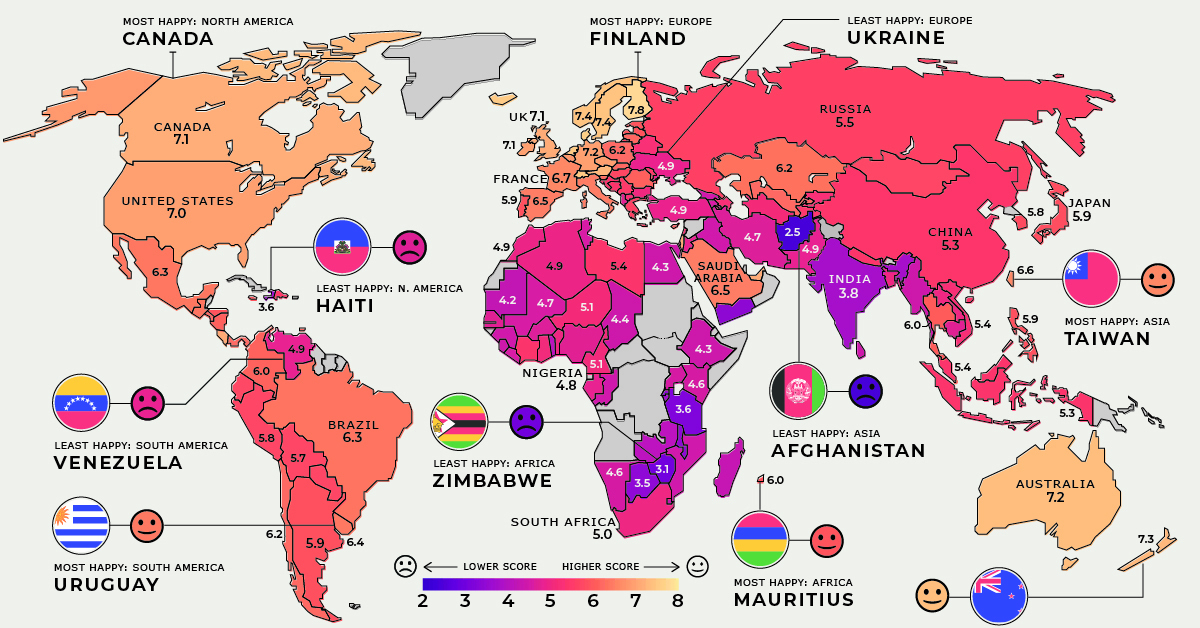
Worldwide happiness comes in at an average score of 5.5, a marginal improvement since our previous coverage of this report in 2019. Let’s dive into regional outlooks for happiness levels.
North America
Current Mood: Happy (6.1)
Canada retains its spot as the happiest country in North America, although its overall global ranking has dropped over the years. In 2019, it was ranked in ninth place globally, dropping to 11th in the 2020 edition, and declining further to 14th place in this year’s report.
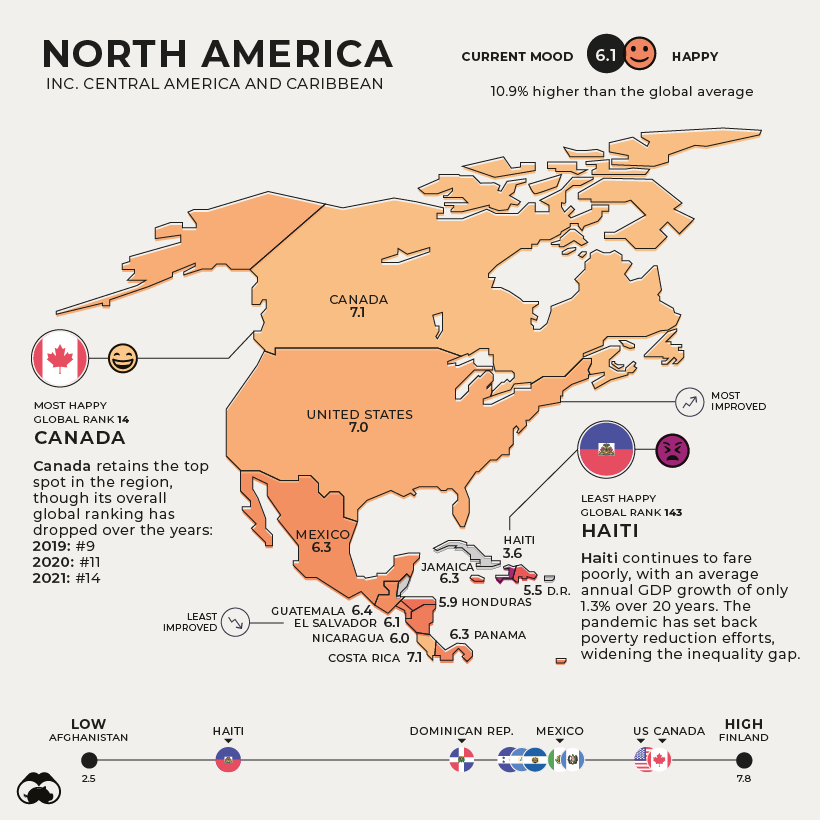
Haiti continues to fare poorly as the unhappiest in the region, with an average annual GDP growth of only 1.3% over 20 years. Its weak economy and political instability have been worsened by the pandemic—setting back efforts to reduce poverty and widening inequality.
South America
Current Mood: Content (5.9)
With the largest middle class in the Americas—60% of its population—and a miniscule 0.1% extreme poverty rate, Uruguay is the happiest South American country. The nation has also achieved equitable access to basic services, from education to electricity.
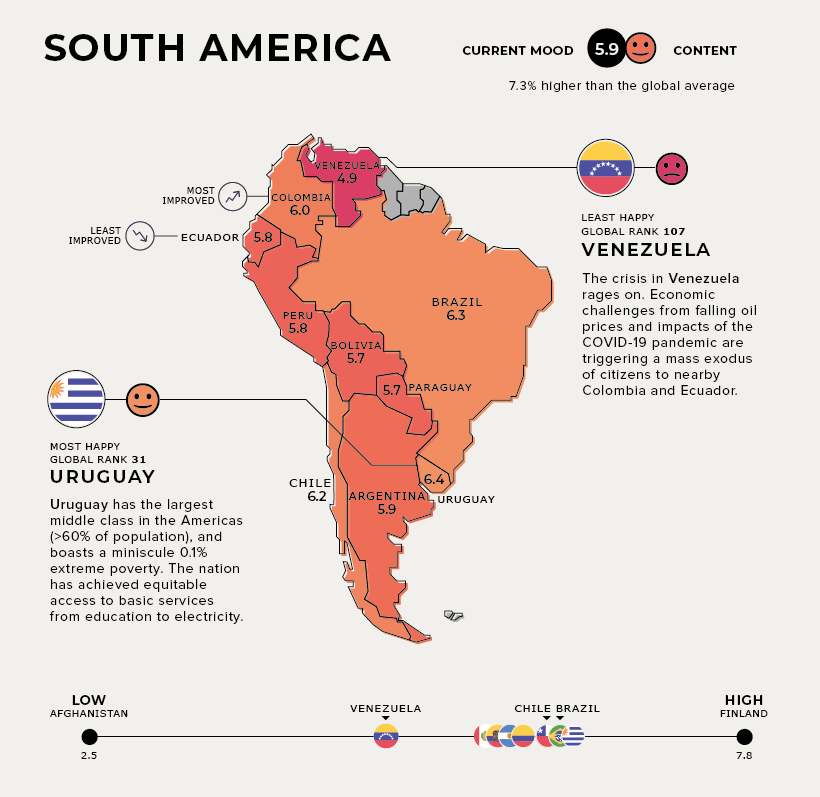
The trio of Colombia, Ecuador, and Venezuela are experiencing different stages of progress in happiness levels, but their relationship is very much interdependent.
Venezuela and Ecuador face similar economic challenges and sharp declines in oil prices. Venezuela is additionally acutely affected by socio-political unrest, triggering a mass exodus of citizens to Ecuador and Colombia alike. The silver lining is that the influx of highly-educated Venezuelan migrants may provide a 2% boost to Ecuador’s GDP.
Colombia, the most improved country, has halved its poverty rate in the last decade. In addition, it has welcomed almost 2 million Venezuelan migrants as of Dec 2020—and plans to provide them up to 10 years of protective status.
Europe
Current Mood: Happy (6.4)
Finland remains at the top of the leaderboard as the world’s happiest country. This year’s ranking was also influenced by high levels of trust in the way the COVID-19 pandemic was handled.
Meanwhile, the shock of the COVID-19 crisis is expected to be short-lived in Croatia, which is the most improved country. This is partly due to its steady pre-pandemic economic gains, although risks remain.
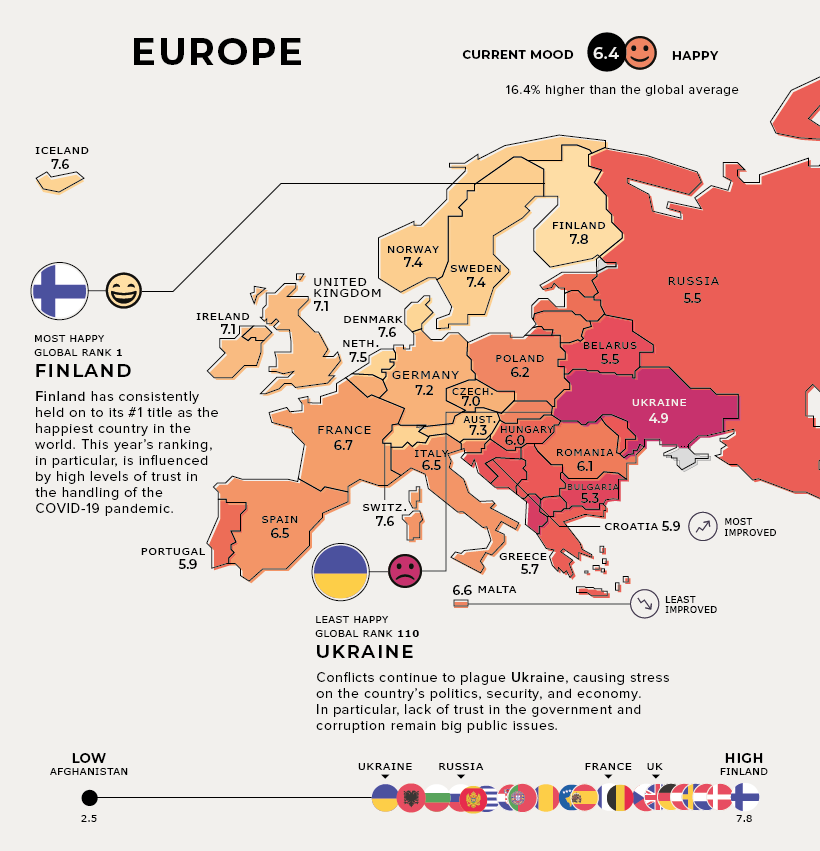
In the unhappiest country of Ukraine, conflicts continue to cause stress on its politics, security, and economy. In particular, government corruption remains a big public issue.
Middle East and Central Asia
Current Mood: It’s Complicated (5.3)
Saudi Arabia is the most improved country in the region, as it continues to reduce its oil dependence, diversify its economy, and bolster its public services. It has also been making some progress towards gender equality.
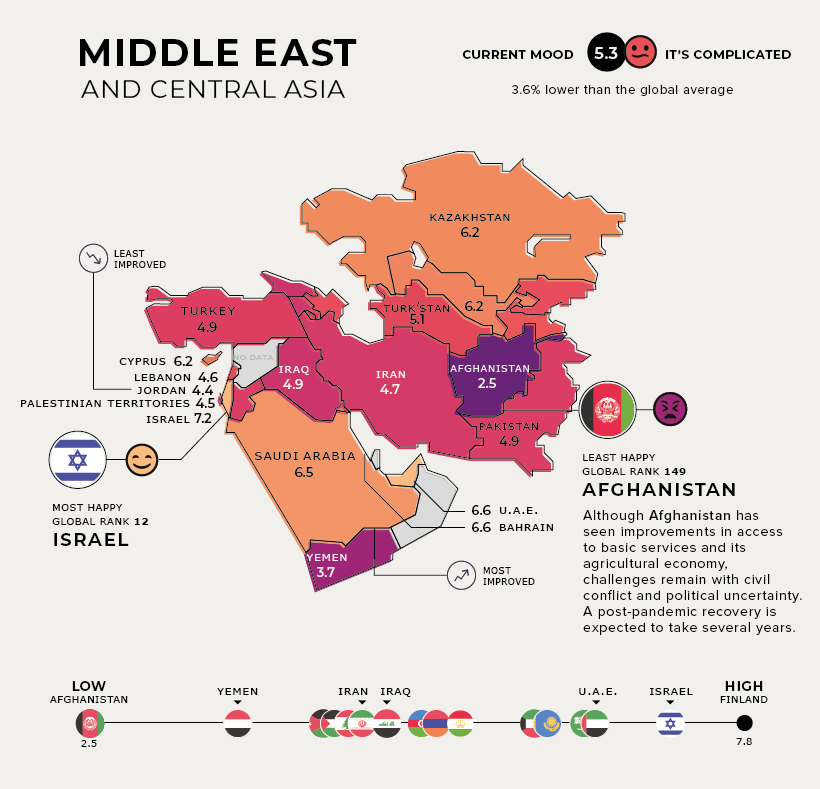
The tourism and hospitality industries contribute nearly 20% of Jordan’s GDP—and COVID-19 has caused a prolonged economic decline in the country along with the headwinds of these industries.
Although Afghanistan has seen improvements in access to basic services and its agricultural economy, challenges remain with prolonged conflict and violence. A post-pandemic recovery in the world’s unhappiest country might take several years.
East Asia and Oceania
Current Mood: Neutral (5.5)
Both New Zealand and Taiwan saw a successful COVID-19 response and recovery boosting their positions in the global happiness rankings. In fact, New Zealand was the only non-European country to make it into the top 10 on the global happiness list.
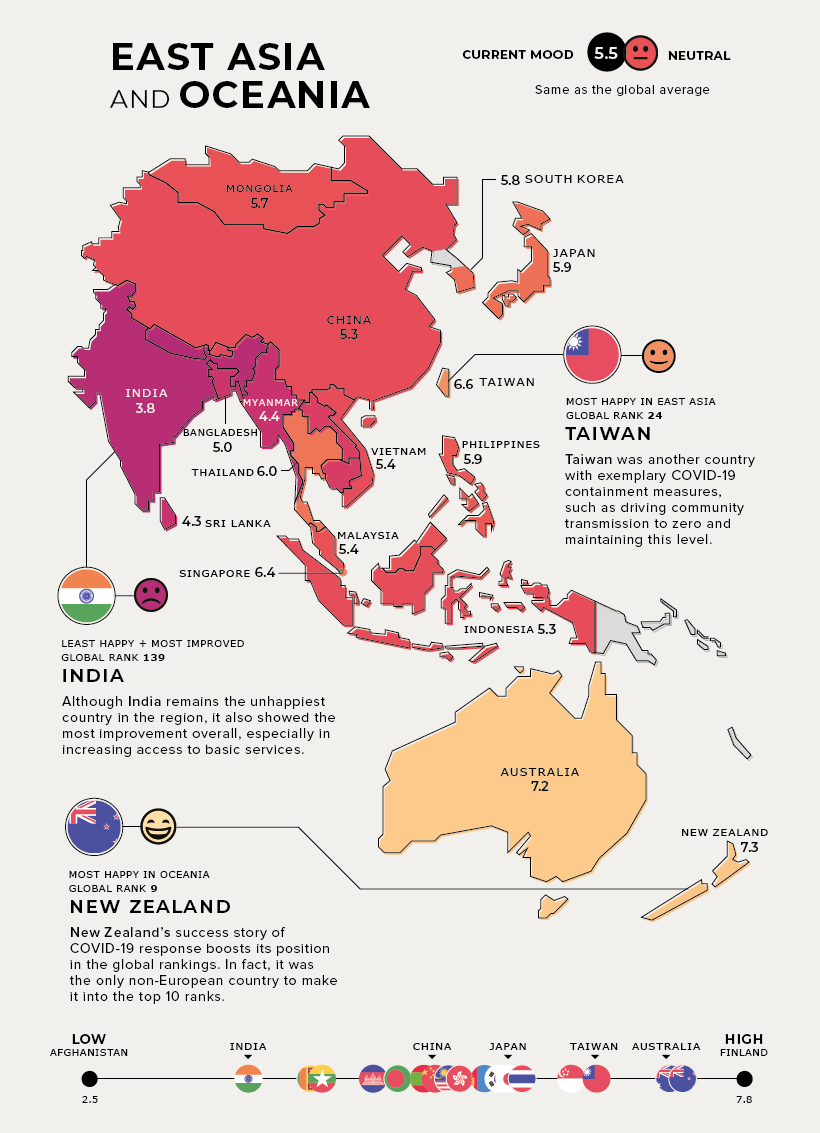
Note: As the report only covers 149 countries, “Oceania” only refers to Australia and New Zealand in this instance.
Although India remains the unhappiest country in the region, it also showed the most improvement overall, possibly due to its increased access to basic services. Notably though, the pandemic caused a sharp economic contraction in real GDP by 23.9% year-over-year in Q1’2021.
Africa
Current Mood: Unhappy (4.5)
In July 2020, the island nation of Mauritius joined Seychelles to become the second high-income country in Africa, helping cement its status as the happiest in the region.
Zambia, the most improved African country, has one of the world’s youngest populations by median age—which presents long-term opportunities for labor force participation.
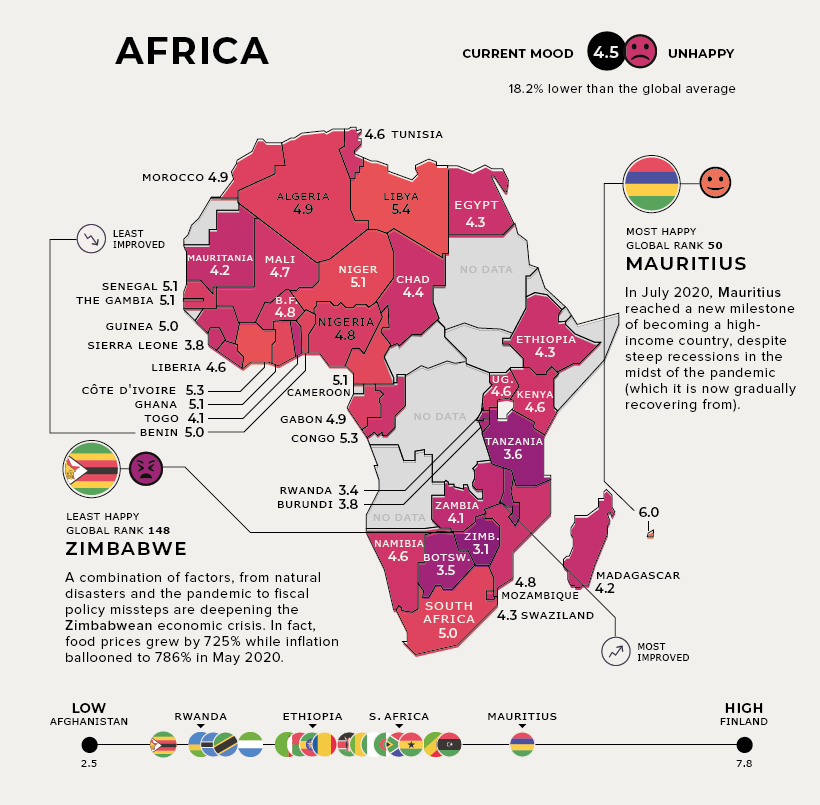
On the flip side, agriculturally-reliant Benin struggles with high poverty, with close to 40% of the population living below $1.90 per day.
Zimbabwe, the unhappiest country, has been through not just natural disasters but financial disasters too. It experienced hyperinflation of 786% in May 2020, accompanied by an equally sharp rise in food prices.
Although each country has been uniquely impacted by the pandemic, it’s clear that on the whole, happiness levels take into account so much more. How will future rankings look like in a post-pandemic world?


VC+
VC+: Get Our Key Takeaways From the IMF’s World Economic Outlook
A sneak preview of the exclusive VC+ Special Dispatch—your shortcut to understanding IMF’s World Economic Outlook report.

Have you read IMF’s latest World Economic Outlook yet? At a daunting 202 pages, we don’t blame you if it’s still on your to-do list.
But don’t worry, you don’t need to read the whole April release, because we’ve already done the hard work for you.
To save you time and effort, the Visual Capitalist team has compiled a visual analysis of everything you need to know from the report—and our VC+ Special Dispatch is available exclusively to VC+ members. All you need to do is log into the VC+ Archive.
If you’re not already subscribed to VC+, make sure you sign up now to access the full analysis of the IMF report, and more (we release similar deep dives every week).
For now, here’s what VC+ members get to see.
Your Shortcut to Understanding IMF’s World Economic Outlook
With long and short-term growth prospects declining for many countries around the world, this Special Dispatch offers a visual analysis of the key figures and takeaways from the IMF’s report including:
- The global decline in economic growth forecasts
- Real GDP growth and inflation forecasts for major nations in 2024
- When interest rate cuts will happen and interest rate forecasts
- How debt-to-GDP ratios have changed since 2000
- And much more!

Get the Full Breakdown in the Next VC+ Special Dispatch
VC+ members can access the full Special Dispatch by logging into the VC+ Archive, where you can also check out previous releases.
Make sure you join VC+ now to see exclusive charts and the full analysis of key takeaways from IMF’s World Economic Outlook.
Don’t miss out. Become a VC+ member today.
What You Get When You Become a VC+ Member
VC+ is Visual Capitalist’s premium subscription. As a member, you’ll get the following:
- Special Dispatches: Deep dive visual briefings on crucial reports and global trends
- Markets This Month: A snappy summary of the state of the markets and what to look out for
- The Trendline: Weekly curation of the best visualizations from across the globe
- Global Forecast Series: Our flagship annual report that covers everything you need to know related to the economy, markets, geopolitics, and the latest tech trends
- VC+ Archive: Hundreds of previously released VC+ briefings and reports that you’ve been missing out on, all in one dedicated hub
You can get all of the above, and more, by joining VC+ today.

-

 Mining1 week ago
Gold vs. S&P 500: Which Has Grown More Over Five Years?
-

 Markets2 weeks ago
Ranked: The Most Valuable Housing Markets in America
-

 Money2 weeks ago
Which States Have the Highest Minimum Wage in America?
-

 AI2 weeks ago
Ranked: Semiconductor Companies by Industry Revenue Share
-

 Markets2 weeks ago
Ranked: The World’s Top Flight Routes, by Revenue
-

 Countries2 weeks ago
Population Projections: The World’s 6 Largest Countries in 2075
-

 Markets2 weeks ago
The Top 10 States by Real GDP Growth in 2023
-

 Demographics2 weeks ago
The Smallest Gender Wage Gaps in OECD Countries