Markets
World Beer Index 2021: What’s the Beer Price in Your Country?
What’s the Beer Price in Your Country?
Although fewer people have been able to grab a beer at the pub during this pandemic, the global desire for beer prevails. For example, sales of the Corona beer actually shot up in the past year, despite—or perhaps because of—associations with the coronavirus.
This World Beer Index from Expensivity compares the average price of a bottle of beer in 58 countries in a detailed map. Additionally, we show which countries spend the most on beer per capita, and just how much beer people really drink.
Pricey Pints: The Average Beer Price
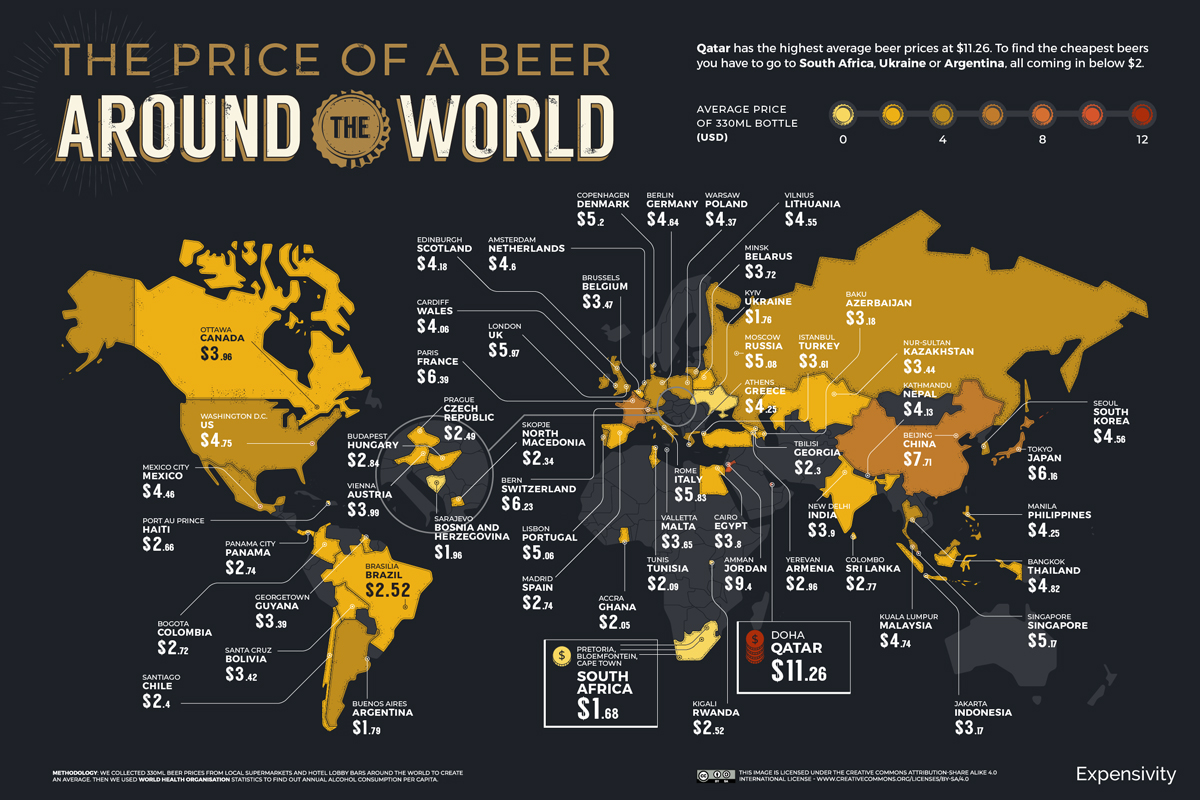
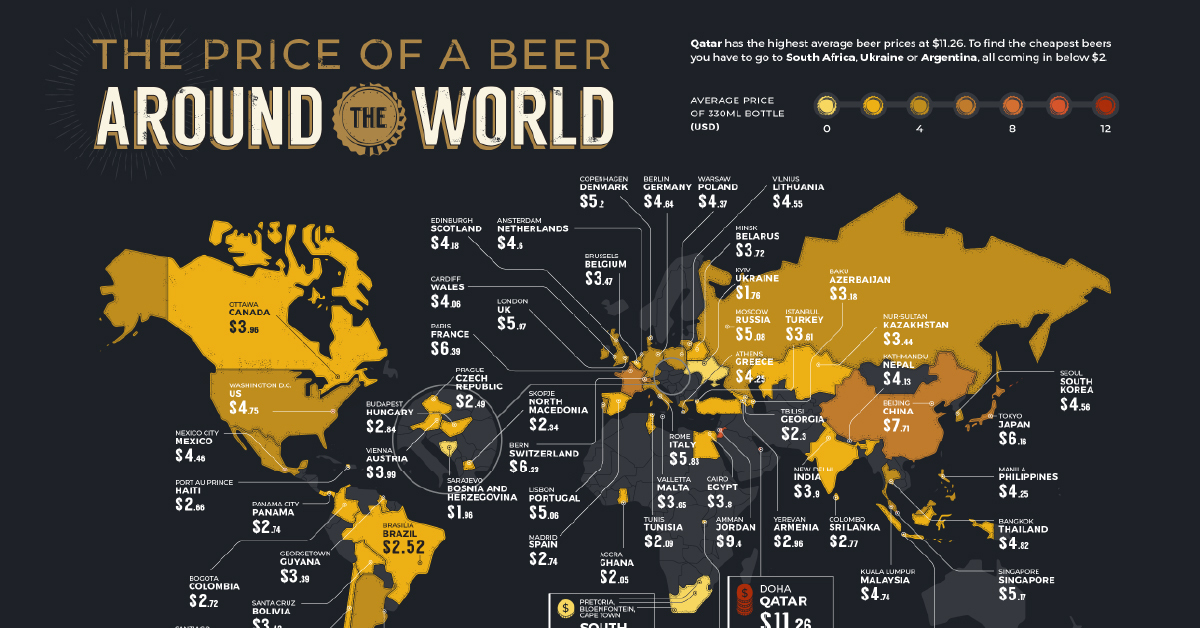
Researchers calculated the average price of a typical bottle of beer (330ml, just shy of a pint) from well known brands via online stores and statistics database Numbeo. In addition, local beer prices were pulled from hotel and bar menus, and average values converted to USD.
In Qatar, you’d have to shell out $11.26 for a single beer, which would surely make for a really expensive night out on the town. In part, this is because in 2019, the Muslim-majority country introduced a 100% excise tax on top the previous sales price of all alcohol imports.
These steep prices are aimed at tourists—and with Qatar hosting the 2022 men’s soccer World Cup, there’ll be thousands of visitors in the country looking for a cold one at any price.
| Rank | Country | Capital City | Average Price of a Beer |
|---|---|---|---|
| 1 | South Africa | Pretoria, Bloemfontein, Cape Town | $1.68 |
| 2 | Ukraine | Kyiv | $1.76 |
| 3 | Argentina | Buenos Aires | $1.79 |
| 4 | Bosnia And Herzegovina | Sarajevo | $1.96 |
| 5 | Ghana | Accra | $2.05 |
| 6 | Tunisia | Tunis | $2.09 |
| 7 | Georgia | Tbilisi | $2.30 |
| 8 | North Macedonia | Skopje | $2.34 |
| 9 | Chile | Santiago | $2.40 |
| 10 | Czech Republic (Czechia) | Prague | $2.49 |
| 11 | Rwanda | Kigali | $2.52 |
| 12 | Brazil | Brasilia | $2.52 |
| 13 | Haiti | Port Au Prince | $2.66 |
| 14 | Colombia | Bogota | $2.72 |
| 15 | Spain | Madrid | $2.74 |
| 16 | Panama | Panama City | $2.74 |
| 17 | Sri Lanka | Colombo | $2.77 |
| 18 | Hungary | Budapest | $2.84 |
| 19 | Armenia | Yerevan | $2.96 |
| 20 | Indonesia | Jakarta | $3.17 |
| 21 | Azerbaijan | Baku | $3.18 |
| 22 | Guyana | Georgetown | $3.39 |
| 23 | Bolivia | Santa Cruz | $3.42 |
| 24 | Kazakhstan | Nur-Sultan | $3.44 |
| 25 | Belgium | Brussels | $3.47 |
| 26 | Turkey | Istanbul | $3.61 |
| 27 | Malta | Valletta | $3.65 |
| 28 | Belarus | Minsk | $3.72 |
| 29 | Egypt | Cairo | $3.80 |
| 30 | India | New Delhi | $3.90 |
| 31 | Canada | Ottawa | $3.96 |
| 32 | Austria | Vienna | $3.99 |
| 33 | Wales | Cardiff | $4.06 |
| 34 | Nepal | Kathmandu | $4.13 |
| 35 | Scotland | Edinburgh | $4.18 |
| 36 | Greece | Athens | $4.25 |
| 37 | Philippines | Manila | $4.25 |
| 38 | Poland | Warsaw | $4.37 |
| 39 | Mexico | Mexcio City | $4.46 |
| 40 | Lithuania | Vilnius | $4.55 |
| 41 | South Korea | Seoul | $4.56 |
| 42 | Netherlands | Amsterdam | $4.60 |
| 43 | Germany | Berlin | $4.64 |
| 44 | Malaysia | Kuala Lumpur | $4.74 |
| 45 | United States | Washington D.C. | $4.75 |
| 46 | Thailand | Bangkok | $4.82 |
| 47 | Portugal | Lisbon | $5.06 |
| 48 | Russia | Moscow | $5.08 |
| 49 | Singapore | Singapore | $5.17 |
| 50 | Denmark | Copenhagen | $5.20 |
| 51 | Italy | Rome | $5.83 |
| 52 | England | London | $5.97 |
| 53 | Japan | Tokyo | $6.16 |
| 54 | Switzerland | Bern | $6.23 |
| 55 | France | Paris | $6.39 |
| 56 | China | Beijing | $7.71 |
| 57 | Jordan | Amman | $9.40 |
| 58 | Qatar | Doha | $11.26 |
At just $1.68 per bottle, South Africa has the lowest average beer price thanks at least partially to cultural norms of buying in bulk.
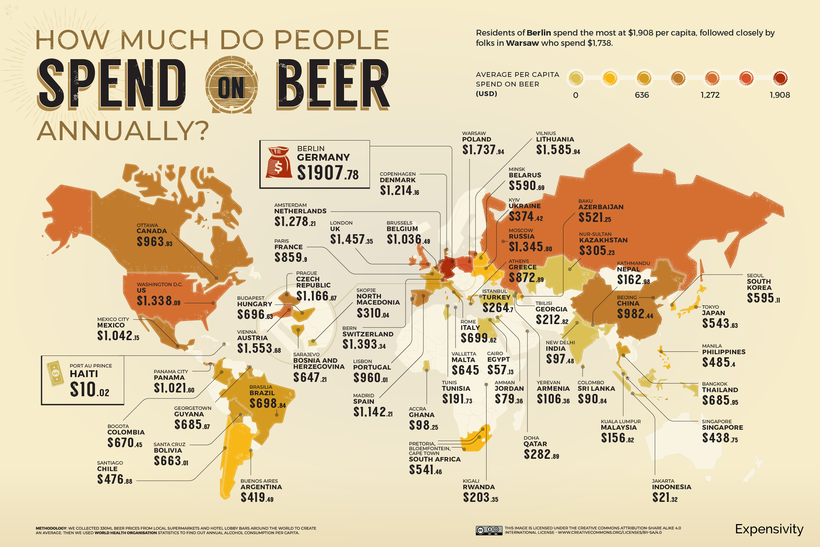
Cashing In: The Per Capita Spend on Beer
The price of a single beer is one thing, but which countries spend the most on beer itself? Germany unsurprisingly tops the list here with nearly $2,000 of expenditures per capita, bolstered by its strong beer culture and annual Oktoberfest celebration.
Germany also prides itself on the purity of its beer—the vast majority of brewers follow the Reinheitsgebot, centuries-old purity laws that broadly state that beer may contain only three ingredients: water, barley, and hops.
View the high resolution of this infographic by clicking here.
Following closely behind is Poland, which spends $1,738 per capita. Meanwhile, the U.S. ranks eighth in the world for the highest spending on beer per capita at $1,554—beer is also the country’s most popular alcoholic beverage.
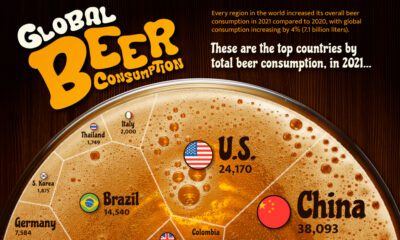
Getting Boozy: How Much Beer Do People Drink?
Using data from the World Health Organization, the visualization below also digs into how much beer is consumed around the world per capita.
The Czech Republic emerges on top in this regard, with 468 beers on average in a year—that works out to 1.3 beers per day. Spain and Germany are next with 417 and 411 beers, respectively.

View the high resolution of this infographic by clicking here.
On the flip side, people in Haiti only drink about four beers yearly. This may be because they prefer something a little stronger—97% of alcohol consumption in the nation comes from spirits such as rum.
Beer has been around for over 7,000 years. No matter the beer price in your country, it’s worth raising a glass to the timelessness of this humble beverage.


Markets
Mapped: Europe’s GDP Per Capita, by Country
Which European economies are richest on a GDP per capita basis? This map shows the results for 44 countries across the continent.


Mapped: Europe’s GDP Per Capita, by Country (2024)
This was originally posted on our Voronoi app. Download the app for free on iOS or Android and discover incredible data-driven charts from a variety of trusted sources.
Europe is home to some of the largest and most sophisticated economies in the world. But how do countries in the region compare with each other on a per capita productivity basis?
In this map, we show Europe’s GDP per capita levels across 44 nations in current U.S. dollars. Data for this visualization and article is sourced from the International Monetary Fund (IMF) via their DataMapper tool, updated April 2024.
Europe’s Richest and Poorest Nations, By GDP Per Capita
Luxembourg, Ireland, and Switzerland, lead the list of Europe’s richest nations by GDP per capita, all above $100,000.
| Rank | Country | GDP Per Capita (2024) |
|---|---|---|
| 1 | 🇱🇺 Luxembourg | $131,380 |
| 2 | 🇮🇪 Ireland | $106,060 |
| 3 | 🇨🇭 Switzerland | $105,670 |
| 4 | 🇳🇴 Norway | $94,660 |
| 5 | 🇮🇸 Iceland | $84,590 |
| 6 | 🇩🇰 Denmark | $68,900 |
| 7 | 🇳🇱 Netherlands | $63,750 |
| 8 | 🇸🇲 San Marino | $59,410 |
| 9 | 🇦🇹 Austria | $59,230 |
| 10 | 🇸🇪 Sweden | $58,530 |
| 11 | 🇧🇪 Belgium | $55,540 |
| 12 | 🇫🇮 Finland | $55,130 |
| 13 | 🇩🇪 Germany | $54,290 |
| 14 | 🇬🇧 UK | $51,070 |
| 15 | 🇫🇷 France | $47,360 |
| 16 | 🇦🇩 Andorra | $44,900 |
| 17 | 🇲🇹 Malta | $41,740 |
| 18 | 🇮🇹 Italy | $39,580 |
| 19 | 🇨🇾 Cyprus | $37,150 |
| 20 | 🇪🇸 Spain | $34,050 |
| 21 | 🇸🇮 Slovenia | $34,030 |
| 22 | 🇪🇪 Estonia | $31,850 |
| 23 | 🇨🇿 Czech Republic | $29,800 |
| 24 | 🇵🇹 Portugal | $28,970 |
| 25 | 🇱🇹 Lithuania | $28,410 |
| 26 | 🇸🇰 Slovakia | $25,930 |
| 27 | 🇱🇻 Latvia | $24,190 |
| 28 | 🇬🇷 Greece | $23,970 |
| 29 | 🇭🇺 Hungary | $23,320 |
| 30 | 🇵🇱 Poland | $23,010 |
| 31 | 🇭🇷 Croatia | $22,970 |
| 32 | 🇷🇴 Romania | $19,530 |
| 33 | 🇧🇬 Bulgaria | $16,940 |
| 34 | 🇷🇺 Russia | $14,390 |
| 35 | 🇹🇷 Türkiye | $12,760 |
| 36 | 🇲🇪 Montenegro | $12,650 |
| 37 | 🇷🇸 Serbia | $12,380 |
| 38 | 🇦🇱 Albania | $8,920 |
| 39 | 🇧🇦 Bosnia & Herzegovina | $8,420 |
| 40 | 🇲🇰 North Macedonia | $7,690 |
| 41 | 🇧🇾 Belarus | $7,560 |
| 42 | 🇲🇩 Moldova | $7,490 |
| 43 | 🇽🇰 Kosovo | $6,390 |
| 44 | 🇺🇦 Ukraine | $5,660 |
| N/A | 🇪🇺 EU Average | $44,200 |
Note: Figures are rounded.
Three Nordic countries (Norway, Iceland, Denmark) also place highly, between $70,000-90,000. Other Nordic peers, Sweden and Finland rank just outside the top 10, between $55,000-60,000.
Meanwhile, Europe’s biggest economies in absolute terms, Germany, UK, and France, rank closer to the middle of the top 20, with GDP per capitas around $50,000.
Finally, at the end of the scale, Eastern Europe as a whole tends to have much lower per capita GDPs. In that group, Ukraine ranks last, at $5,660.
A Closer Look at Ukraine
For a broader comparison, Ukraine’s per capita GDP is similar to Iran ($5,310), El Salvador ($5,540), and Guatemala ($5,680).
According to experts, Ukraine’s economy has historically underperformed to expectations. After the fall of the Berlin Wall, the economy contracted for five straight years. Its transition to a Western, liberalized economic structure was overshadowed by widespread corruption, a limited taxpool, and few revenue sources.
Politically, its transformation from authoritarian regime to civil democracy has proved difficult, especially when it comes to institution building.
Finally, after the 2022 invasion of the country, Ukraine’s GDP contracted by 30% in a single year—the largest loss since independence. Large scale emigration—to the tune of six million refugees—is also playing a role.
Despite these challenges, the country’s economic growth has somewhat stabilized while fighting continues.

-

 Markets6 days ago
Visualized: Interest Rate Forecasts for Advanced Economies
-

 Markets2 weeks ago
Economic Growth Forecasts for G7 and BRICS Countries in 2024
-

 Wealth2 weeks ago
Charted: Which City Has the Most Billionaires in 2024?
-

 Technology2 weeks ago
All of the Grants Given by the U.S. CHIPS Act
-

 Green2 weeks ago
The Carbon Footprint of Major Travel Methods
-

 United States1 week ago
Visualizing the Most Common Pets in the U.S.
-

 Culture1 week ago
The World’s Top Media Franchises by All-Time Revenue
-

 voronoi1 week ago
Best Visualizations of April on the Voronoi App