Globalization
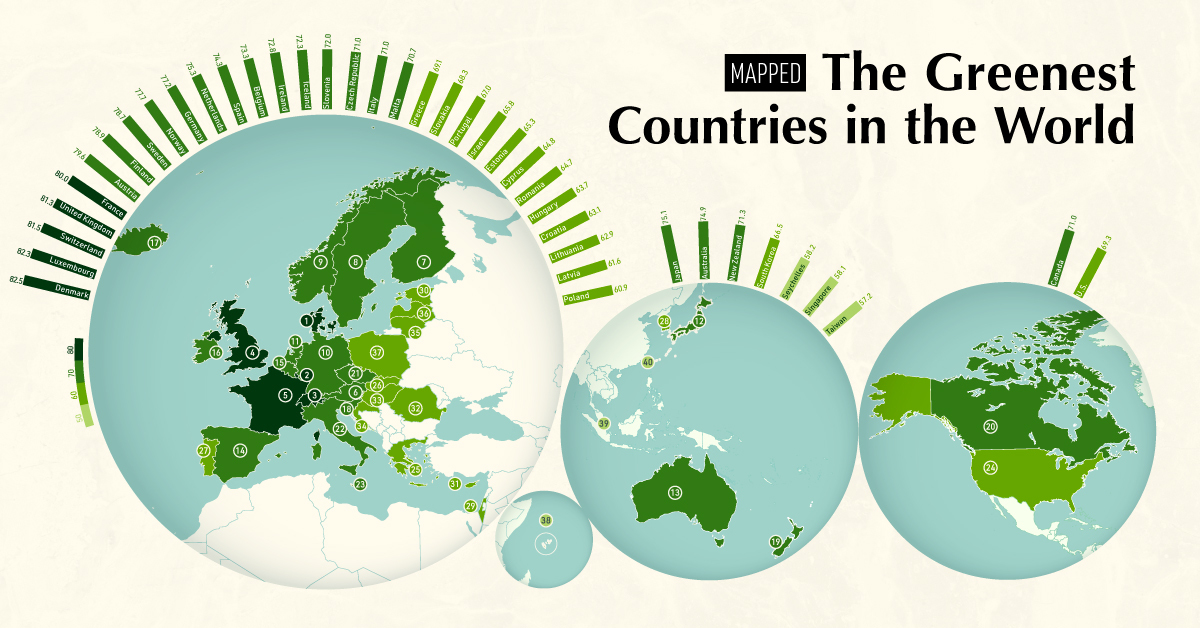
Mapped: The Greenest Countries in the World


Mapped: The Greenest Countries in the World
From widening wealth disparity to the environmental ramifications of economic development—the growing focus on global sustainability is a clear sign of the times.
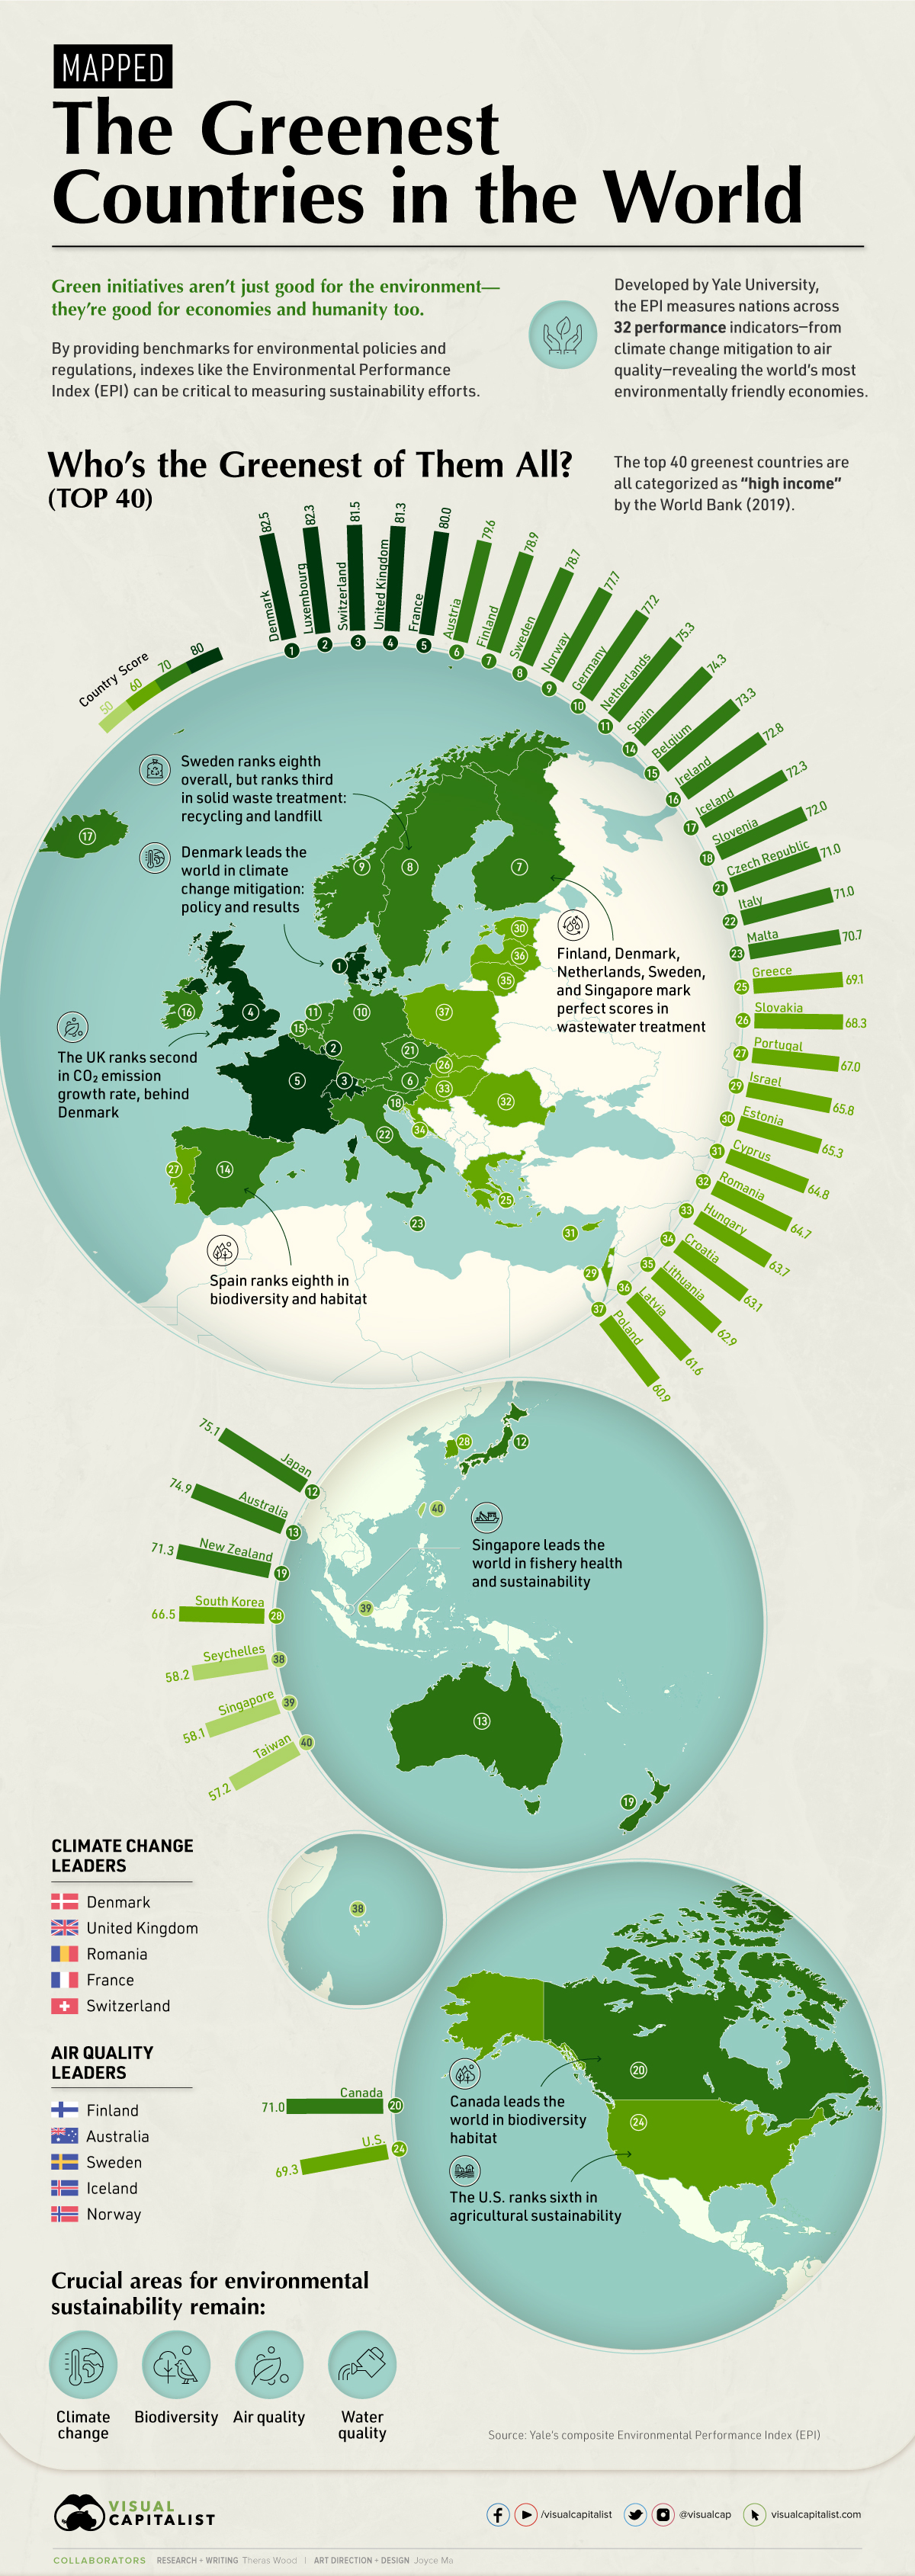
Research reveals that when a sustainable ethos is applied to policy and business, it typically bodes well for economies and people alike. By providing benchmarks for those decisions, indexes like Yale’s Environmental Performance Index (EPI) can be critical to measuring national sustainability efforts.
The above map interprets the EPI ranking of 180 economies across 32 environmental health indicators by narrowing in on the top 40 greenest countries.
Who’s the Greenest of them All?
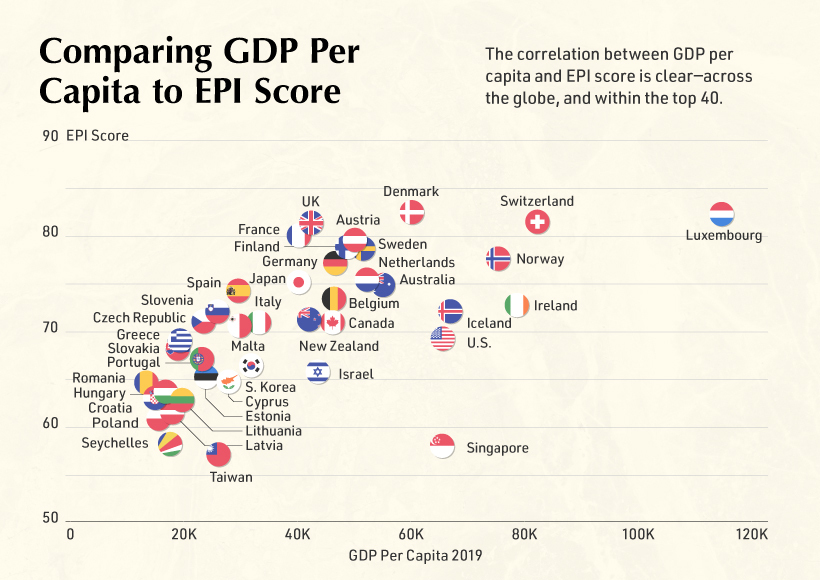
Despite the decades-long trend of globalization, national environmental policies have proved to be widely divergent. The EPI report confirms that those policies—and their positive results—are highly correlated with national wealth.
This is evidenced in the global EPI distributions, seen below:
| OVERALL RANK | COUNTRY | SCORE | REGIONAL RANK |
|---|---|---|---|
| 1 | Denmark | 82.5 | 1 |
| 2 | Luxembourg | 82.3 | 2 |
| 3 | Switzerland | 81.5 | 3 |
| 4 | United Kingdom | 81.3 | 4 |
| 5 | France | 80 | 5 |
| 6 | Austria | 79.6 | 6 |
| 7 | Finland | 78.9 | 7 |
| 8 | Sweden | 78.7 | 8 |
| 9 | Norway | 77.7 | 9 |
| 10 | Germany | 77.2 | 10 |
| 11 | Netherlands | 75.3 | 11 |
| 12 | Japan | 75.1 | 1 |
| 13 | Australia | 74.9 | 12 |
| 14 | Spain | 74.3 | 13 |
| 15 | Belgium | 73.3 | 14 |
| 16 | Ireland | 72.8 | 15 |
| 17 | Iceland | 72.3 | 16 |
| 18 | Slovenia | 72 | 1 |
| 19 | New Zealand | 71.3 | 17 |
| 20 | Canada | 71 | 18 |
| 21 | Czech Republic | 71 | 2 |
| 22 | Italy | 71 | 18 |
| 23 | Malta | 70.7 | 20 |
| 24 | United States of America | 69.3 | 21 |
| 25 | Greece | 69.1 | 3 |
| 26 | Slovakia | 68.3 | 4 |
| 27 | Portugal | 67 | 22 |
| 28 | South Korea | 66.5 | 2 |
| 29 | Israel | 65.8 | 1 |
| 30 | Estonia | 65.3 | 5 |
| 31 | Cyprus | 64.8 | 6 |
| 32 | Romania | 64.7 | 7 |
| 33 | Hungary | 63.7 | 8 |
| 34 | Croatia | 63.1 | 9 |
| 35 | Lithuania | 62.9 | 10 |
| 36 | Latvia | 61.6 | 11 |
| 37 | Poland | 60.9 | 12 |
| 38 | Seychelles | 58.2 | 1 |
| 39 | Singapore | 58.1 | 3 |
| 40 | Taiwan | 57.2 | 4 |
| 41 | Bulgaria | 57 | 13 |
| 42 | United Arab Emirates | 55.6 | 2 |
| 43 | North Macedonia | 55.4 | 14 |
| 44 | Chile | 55.3 | 1 |
| 45 | Serbia | 55.2 | 15 |
| 46 | Brunei Darussalam | 54.8 | 5 |
| 47 | Kuwait | 53.6 | 3 |
| 48 | Jordan | 53.4 | 4 |
| 49 | Belarus | 53 | 1 |
| 50 | Colombia | 52.9 | 2 |
| 51 | Mexico | 52.6 | 3 |
| 52 | Costa Rica | 52.5 | 4 |
| 53 | Armenia | 52.3 | 2 |
| 54 | Argentina | 52.2 | 5 |
| 55 | Brazil | 51.2 | 6 |
| 56 | Bahrain | 51 | 5 |
| 57 | Ecuador | 51 | 7 |
| 58 | Russia | 50.5 | 3 |
| 59 | Venezuela | 50.3 | 8 |
| 60 | Ukraine | 49.5 | 4 |
| 61 | Uruguay | 49.1 | 9 |
| 62 | Albania | 49 | 16 |
| 63 | Antigua and Barbuda | 48.5 | 10 |
| 64 | Cuba | 48.4 | 11 |
| 65 | St. Vincent and Grenadines | 48.4 | 11 |
| 66 | Jamaica | 48.2 | 13 |
| 67 | Iran | 48 | 6 |
| 68 | Malaysia | 47.9 | 6 |
| 69 | Trinidad and Tobago | 47.5 | 14 |
| 70 | Panama | 47.3 | 15 |
| 71 | Tunisia | 46.7 | 7 |
| 72 | Azerbaijan | 46.5 | 5 |
| 73 | Paraguay | 46.4 | 16 |
| 74 | Dominican Republic | 46.3 | 17 |
| 75 | Montenegro | 46.3 | 17 |
| 76 | Gabon | 45.8 | 2 |
| 77 | Barbados | 45.6 | 18 |
| 78 | Bosnia and Herzegovina | 45.4 | 18 |
| 79 | Lebanon | 45.4 | 8 |
| 80 | Thailand | 45.4 | 7 |
| 81 | Suriname | 45.2 | 19 |
| 82 | Mauritius | 45.1 | 3 |
| 83 | Tonga | 45.1 | 8 |
| 84 | Algeria | 44.8 | 9 |
| 85 | Kazakhstan | 44.7 | 6 |
| 86 | Dominica | 44.6 | 20 |
| 87 | Moldova | 44.4 | 7 |
| 88 | Bolivia | 44.3 | 21 |
| 89 | Uzbekistan | 44.3 | 8 |
| 90 | Peru | 44 | 22 |
| 91 | Saudi Arabia | 44 | 10 |
| 92 | Turkmenistan | 43.9 | 9 |
| 93 | Bahamas | 43.5 | 23 |
| 94 | Egypt | 43.3 | 11 |
| 95 | El Salvador | 43.1 | 24 |
| 96 | Grenada | 43.1 | 24 |
| 97 | Saint Lucia | 43.1 | 24 |
| 98 | South Africa | 43.1 | 4 |
| 99 | Turkey | 42.6 | 19 |
| 100 | Morocco | 42.3 | 12 |
| 101 | Belize | 41.9 | 27 |
| 102 | Georgia | 41.3 | 10 |
| 103 | Botswana | 40.4 | 5 |
| 104 | Namibia | 40.2 | 6 |
| 105 | Kyrgyzstan | 39.8 | 11 |
| 106 | Iraq | 39.5 | 13 |
| 107 | Bhutan | 39.3 | 1 |
| 108 | Nicaragua | 39.2 | 28 |
| 109 | Sri Lanka | 39 | 2 |
| 110 | Oman | 38.5 | 14 |
| 111 | Philippines | 38.4 | 9 |
| 112 | Burkina Faso | 38.3 | 7 |
| 113 | Malawi | 38.3 | 7 |
| 114 | Tajikistan | 38.2 | 12 |
| 115 | Equatorial Guinea | 38.1 | 9 |
| 116 | Honduras | 37.8 | 29 |
| 117 | Indonesia | 37.8 | 10 |
| 118 | Kiribati | 37.7 | 11 |
| 119 | São Tomé and Príncipe | 37.6 | 10 |
| 120 | China | 37.3 | 12 |
| 121 | Samoa | 37.3 | 12 |
| 122 | Qatar | 37.1 | 15 |
| 123 | Zimbabwe | 37 | 11 |
| 124 | Central African Republic | 36.9 | 12 |
| 125 | Dem. Rep. Congo | 36.4 | 13 |
| 126 | Guyana | 35.9 | 30 |
| 127 | Maldives | 35.6 | 3 |
| 128 | Uganda | 35.6 | 14 |
| 129 | Timor-Leste | 35.3 | 14 |
| 130 | Laos | 34.8 | 15 |
| 131 | Sudan | 34.8 | 16 |
| 132 | Kenya | 34.7 | 15 |
| 133 | Zambia | 34.7 | 15 |
| 134 | Ethiopia | 34.4 | 17 |
| 135 | Fiji | 34.4 | 16 |
| 136 | Mozambique | 33.9 | 18 |
| 137 | Eswatini | 33.8 | 19 |
| 138 | Rwanda | 33.8 | 19 |
| 139 | Cambodia | 33.6 | 17 |
| 140 | Cameroon | 33.6 | 21 |
| 141 | Viet Nam | 33.4 | 18 |
| 142 | Pakistan | 33.1 | 4 |
| 143 | Micronesia | 33 | 19 |
| 144 | Cabo Verde | 32.8 | 22 |
| 145 | Nepal | 32.7 | 5 |
| 146 | Papua New Guinea | 32.4 | 20 |
| 147 | Mongolia | 32.2 | 21 |
| 148 | Comoros | 32.1 | 23 |
| 149 | Guatemala | 31.8 | 31 |
| 150 | Tanzania | 31.1 | 24 |
| 151 | Nigeria | 31 | 25 |
| 152 | Marshall Islands | 30.8 | 22 |
| 153 | Niger | 30.8 | 26 |
| 154 | Republic of Congo | 30.8 | 26 |
| 155 | Senegal | 30.7 | 28 |
| 156 | Eritrea | 30.4 | 29 |
| 157 | Benin | 30 | 30 |
| 158 | Angola | 29.7 | 31 |
| 159 | Togo | 29.5 | 32 |
| 160 | Mali | 29.4 | 33 |
| 161 | Guinea-Bissau | 29.1 | 34 |
| 162 | Bangladesh | 29 | 6 |
| 163 | Vanuatu | 28.9 | 23 |
| 164 | Djibouti | 28.1 | 35 |
| 165 | Lesotho | 28 | 36 |
| 166 | Gambia | 27.9 | 37 |
| 167 | Mauritania | 27.7 | 38 |
| 168 | Ghana | 27.6 | 39 |
| 169 | India | 27.6 | 7 |
| 170 | Burundi | 27 | 40 |
| 171 | Haiti | 27 | 32 |
| 172 | Chad | 26.7 | 41 |
| 173 | Solomon Islands | 26.7 | 24 |
| 174 | Madagascar | 26.5 | 42 |
| 175 | Guinea | 26.4 | 43 |
| 176 | Côte d'Ivoire | 25.8 | 44 |
| 177 | Sierra Leone | 25.7 | 45 |
| 178 | Afghanistan | 25.5 | 8 |
| 179 | Myanmar | 25.1 | 25 |
| 180 | Liberia | 22.6 | 46 |
Regional grouping in the report include: Global West, Asia-Pacific, Eastern Europe, Former Soviet States, Greater Middle East, Latin America & Caribbean, Southern Asia, and Sub-Saharan Africa
Scandinavian countries, which tend to have a high GDP per capita, show strong and consistent results across EPI parameters. Denmark for instance—which ranks first overall—leads the world in slowing its growth in CO2 emissions. Meanwhile, neighbor Sweden leads in landfill and recycling treatment, while wastewater treatment is led by a handful of countries within and beyond Scandinavia including Denmark, Finland, the Netherlands, Singapore, and Sweden.
In North America, Canada claims top spot in the biodiversity and habitat category, while the U.S. ranks sixth in agricultural diversity globally. In Asia, Singapore leads the world in fishery health and sustainability.
Ultimately, it appears the world’s greenest countries tend to focus on all areas of sustainability, while laggard countries show more uneven performance across categories.
What Does “Green” Mean?
Each high-level performance indicator with the EPI, like “environmental health”, is broken into subsections. Nations are scored on each subsector on a scale up to 100. As a result, multiple countries can rank first in any given category.
By evaluating national sustainability on a scale that is unrelated to other nations, we get a clearer idea of comparative national progress, beyond a basic ranking.
For instance, 30 countries tie for first in marine protection, all with scores of 100. This shows that many economies are prioritizing this area of sustainability.
The EPI categories and subsectors are shown in the diagram below:
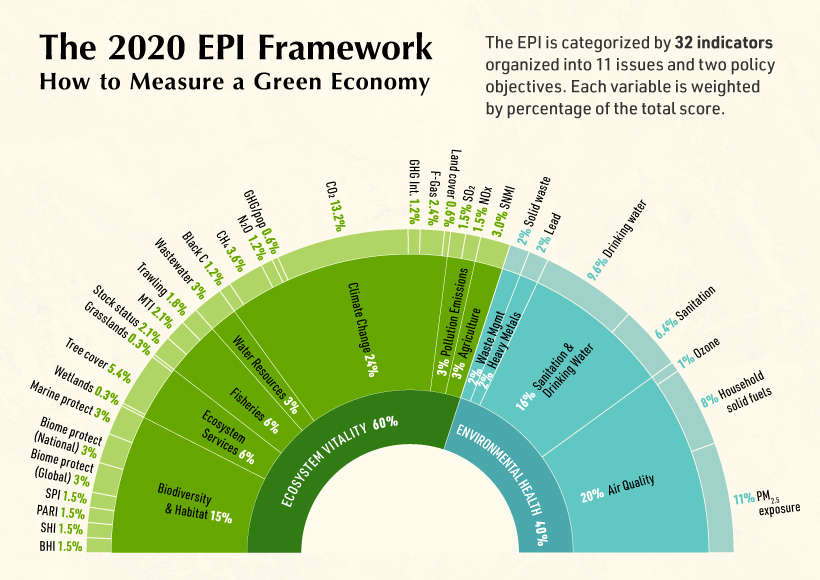
Each section is weighted differently, and is reflected as a percentage within the index. For example, Ecosystem Vitality accounts for 60% of the EPI, Climate Change makes up 24% of a country’s score, and CO2 emission reduction is weighted at 13.2%.
The Cost of Being Green
Infrastructure costs are one reason why wealthier nations tend to fare better across sustainability measures. Everything from air pollution reduction and water treatment, to hazardous waste control and mitigation of public health crises are especially expensive—but have a huge potential impact on citizens.
This trend can be seen the scatterplot, which demonstrates the distribution of economies evaluated by the EPI:
For a more detailed look, the table below highlights the GDP per capita of each of the top 40 greenest countries, based on data from the World Bank and Statista:
| COUNTRY | EPI SCORE | GDP Per Capita | RANK |
|---|---|---|---|
| Denmark | 82.5 | 60,170 | 1 |
| Luxembourg | 82.3 | 114,705 | 2 |
| Switzerland | 81.5 | 81,994 | 3 |
| United Kingdom | 81.3 | 42,330 | 4 |
| France | 80 | 40,494 | 5 |
| Austria | 79.6 | 50,138 | 6 |
| Finland | 78.9 | 48,783 | 7 |
| Sweden | 78.7 | 51,615 | 8 |
| Norway | 77.7 | 75,420 | 9 |
| Germany | 77.2 | 46,445 | 10 |
| Netherlands | 75.3 | 52,331 | 11 |
| Japan | 75.1 | 40,247 | 12 |
| Australia | 74.9 | 55,060 | 13 |
| Spain | 74.3 | 29,600 | 14 |
| Belgium | 73.3 | 46,421 | 15 |
| Ireland | 72.8 | 78,661 | 16 |
| Iceland | 72.3 | 66,945 | 17 |
| Slovenia | 72 | 25,946 | 18 |
| New Zealand | 71.3 | 42,084 | 19 |
| Canada | 71 | 46,195 | 20 |
| Czech Republic | 71 | 23,495 | 21 |
| Italy | 71 | 33,228 | 22 |
| Malta | 70.7 | 29,821 | 23 |
| United States of America | 69.3 | 65,298 | 24 |
| Greece | 69.1 | 19,583 | 25 |
| Slovakia | 68.3 | 19,266 | 26 |
| Portugal | 67 | 23,252 | 27 |
| South Korea | 66.5 | 31,846 | 28 |
| Israel | 65.8 | 43,592 | 29 |
| Estonia | 65.3 | 23,723 | 30 |
| Cyprus | 64.8 | 27,858 | 31 |
| Romania | 64.7 | 12,920 | 32 |
| Hungary | 63.7 | 16,732 | 33 |
| Croatia | 63.1 | 14,936 | 34 |
| Lithuania | 62.9 | 19,602 | 35 |
| Latvia | 61.6 | 17,829 | 36 |
| Poland | 60.9 | 15,693 | 37 |
| Seychelles | 58.2 | 17,448 | 38 |
| Singapore | 58.1 | 65,233 | 39 |
| Taiwan | 57.2 | 25,873 | 40 |
Despite the strong correlation between GDP per capita and EPI score, developing countries do not have to abandon sustainability efforts. China for instance leads the world in the adoption of electric vehicle technology.
Post-Pandemic Outlook
Although some rankings can seem prosaic, indexes like the EPI provide a helpful benchmark for economies to compare efforts. It also allows governments to iterate and build upon environmental strategies and investments by highlighting what is and isn’t working.
CO2 emissions, for instance, are a major driver of climate change. Although the global economic stall has led to a temporary dip of CO2 emissions in early 2020 (a slower growth rate than the 11% expected rise), global emissions still continue.
However, the EPI shows that investments have impact. High-level sustainability efforts—political commitment, media coverage, regulations—can deliver results, even at the grassroots level.


Politics
Charted: How Much Do Countries Trust the United Nations?
Which countries trust the United Nations to do the right thing the most, and the least?
How Much Do Countries Trust the United Nations?
This was originally posted on our Voronoi app. Download the app for free on iOS or Android and discover incredible data-driven charts from a variety of trusted sources.
Do you trust the United Nations (UN) in carrying out its objectives of maintaining peace and security, protecting human rights, and upholding international law?
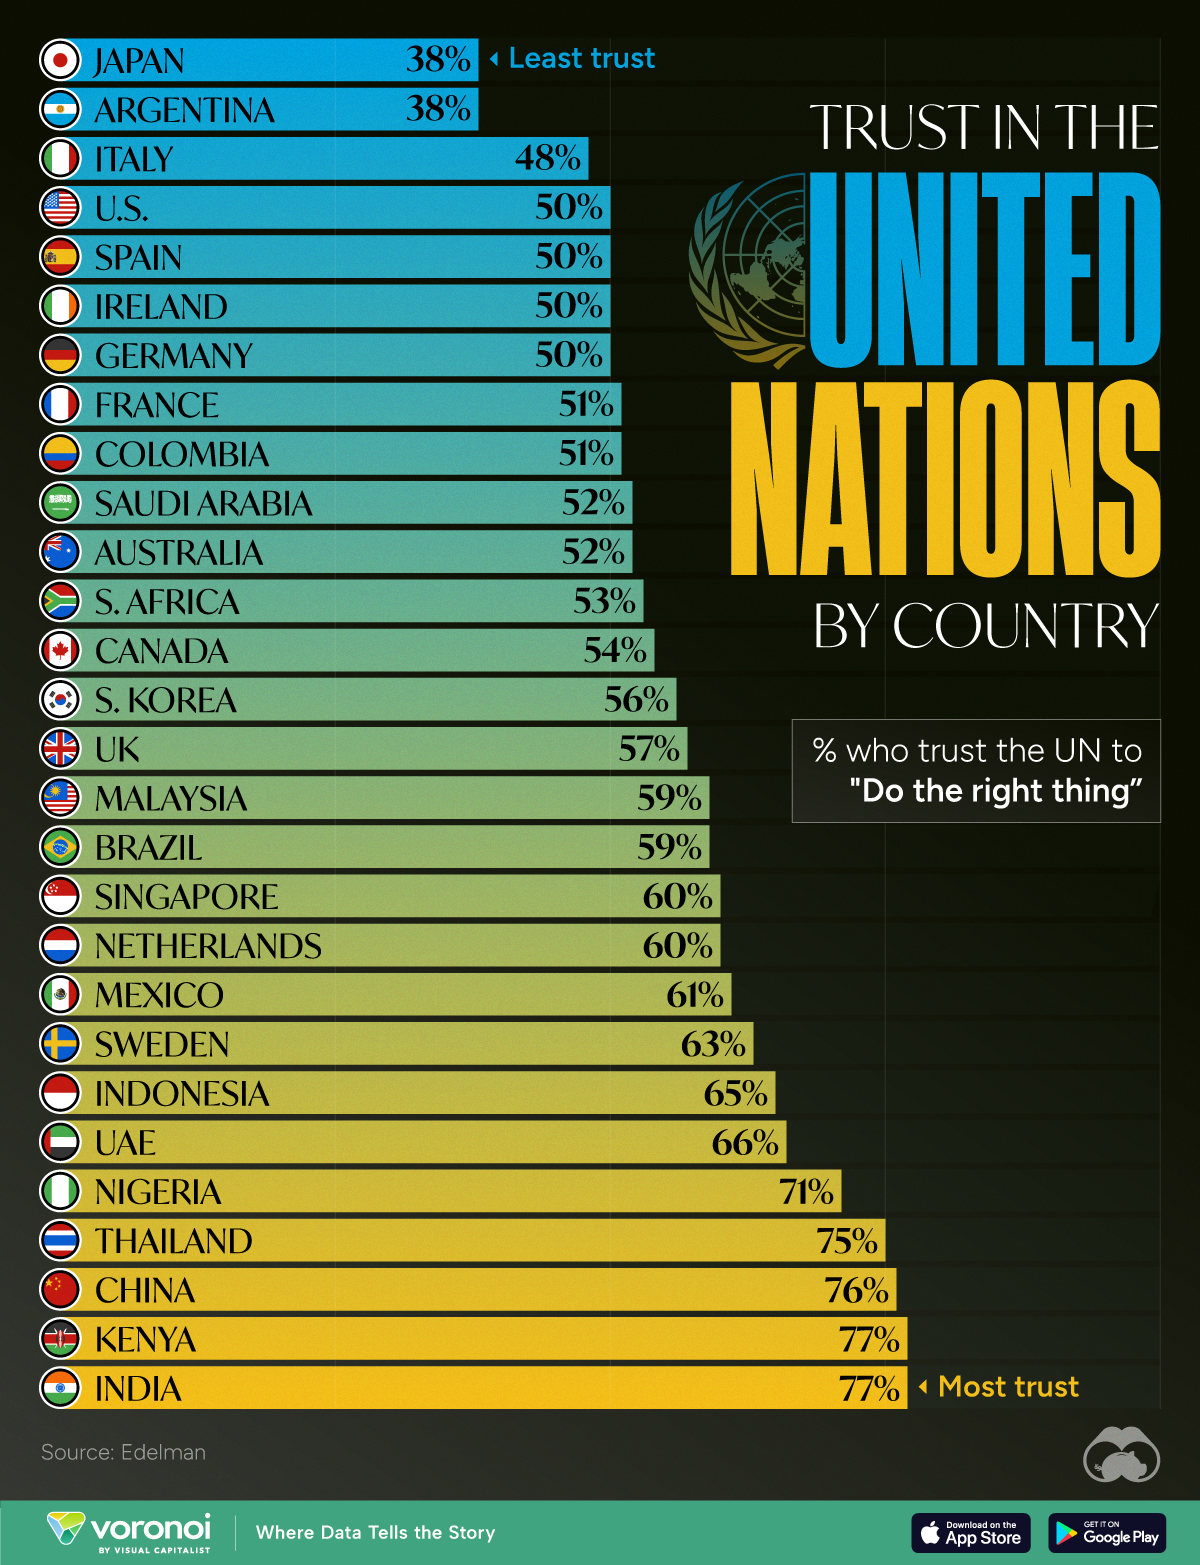
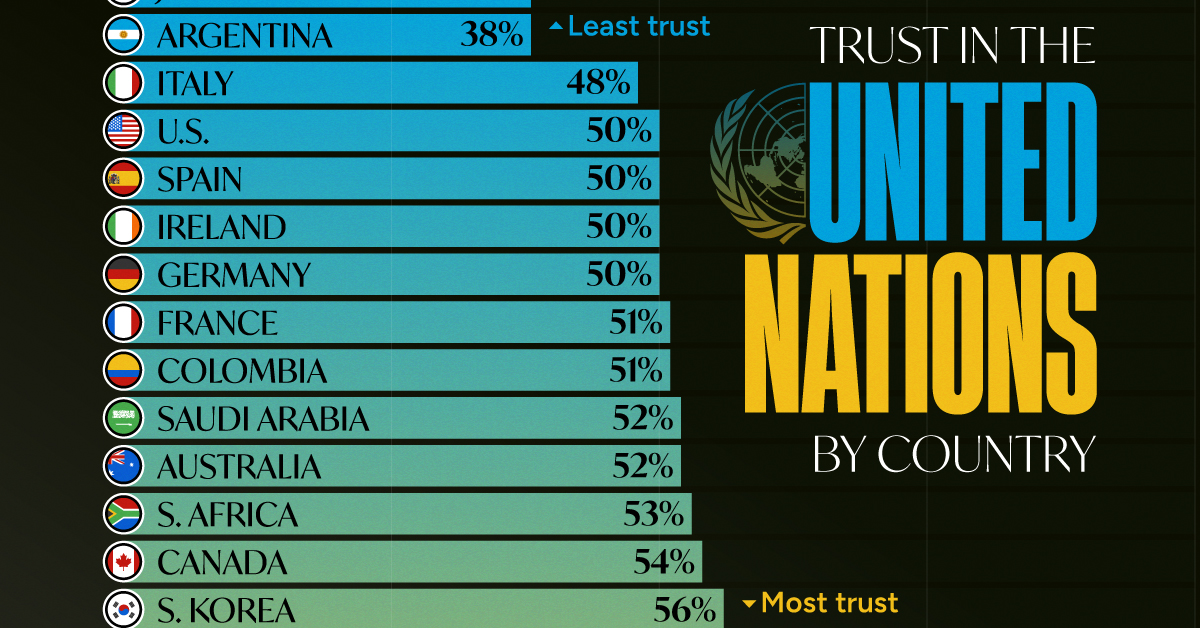
Survey results from Edelman’s 2024 Trust Barometer Global Report show that some countries’ citizens believe strongly in the UN to “do the right thing,” while others are less trusting.
Ranked: 28 Countries Trust Levels in the United Nations in 2024
To gauge trust in the United Nations, Edelman surveyed more than 32,000 respondents between 28 countries in November 2023. Each country sample of 1,150 people is statistically significant and representative.
According to the results, respondents from Japan and Argentina had the least amount of trust in the UN when it came to “doing the right thing.”
| Country | % who trust the UN to "Do the right thing" |
|---|---|
| 🇯🇵 Japan | 38% |
| 🇦🇷 Argentina | 38% |
| 🇮🇹 Italy | 48% |
| 🇺🇸 U.S. | 50% |
| 🇪🇸 Spain | 50% |
| 🇮🇪 Ireland | 50% |
| 🇩🇪 Germany | 50% |
| 🇫🇷 France | 51% |
| 🇨🇴 Colombia | 51% |
| 🇸🇦 Saudi Arabia | 52% |
| 🇦🇺 Australia | 52% |
| 🇿🇦 South Africa | 53% |
| 🇨🇦 Canada | 54% |
| 🇰🇷 South Korea | 56% |
| 🇬🇧 UK | 57% |
| 🇲🇾 Malaysia | 59% |
| 🇧🇷 Brazil | 59% |
| 🇸🇬 Singapore | 60% |
| 🇳🇱 Netherlands | 60% |
| 🇲🇽 Mexico | 61% |
| 🇸🇪 Sweden | 63% |
| 🇮🇩 Indonesia | 65% |
| 🇦🇪 UAE | 66% |
| 🇳🇬 Nigeria | 71% |
| 🇹🇭 Thailand | 75% |
| 🇨🇳 China | 76% |
| 🇰🇪 Kenya | 77% |
| 🇮🇳 India | 77% |
Just 38% of Japanese and Argentinian people had faith in the UN, by far the lowest levels of trust. Only one other country was below the 50% trust mark: Italy at 48%.
Many major economies and G7 countries had trust levels hovering between 50–60%, including the U.S. and Germany at 50% and the UK at 57%.
Meanwhile, India and Kenya had the highest levels of trust in the UN at 77%, with China right behind at 76%. In general, African and Asian nations tended to have higher levels of trust in the UN, though there were exceptions like South Africa (53%) and South Korea (56%)
It’s also worth noting that views within countries can differ significantly. Separate data on this topic from Pew Research shows that public opinion of the UN is split along ideological lines. In the U.S., there’s a 45 percentage point difference, with more conservative respondents having significantly lower trust in the UN.

-

 Technology6 days ago
All of the Grants Given by the U.S. CHIPS Act
-

 Uranium2 weeks ago
The World’s Biggest Nuclear Energy Producers
-

 Education2 weeks ago
How Hard Is It to Get Into an Ivy League School?
-

 Debt2 weeks ago
How Debt-to-GDP Ratios Have Changed Since 2000
-

 Sports2 weeks ago
The Highest Earning Athletes in Seven Professional Sports
-

 Science2 weeks ago
Visualizing the Average Lifespans of Mammals
-

 Brands1 week ago
How Tech Logos Have Evolved Over Time
-

 Energy1 week ago
Ranked: The Top 10 EV Battery Manufacturers in 2023