Economy
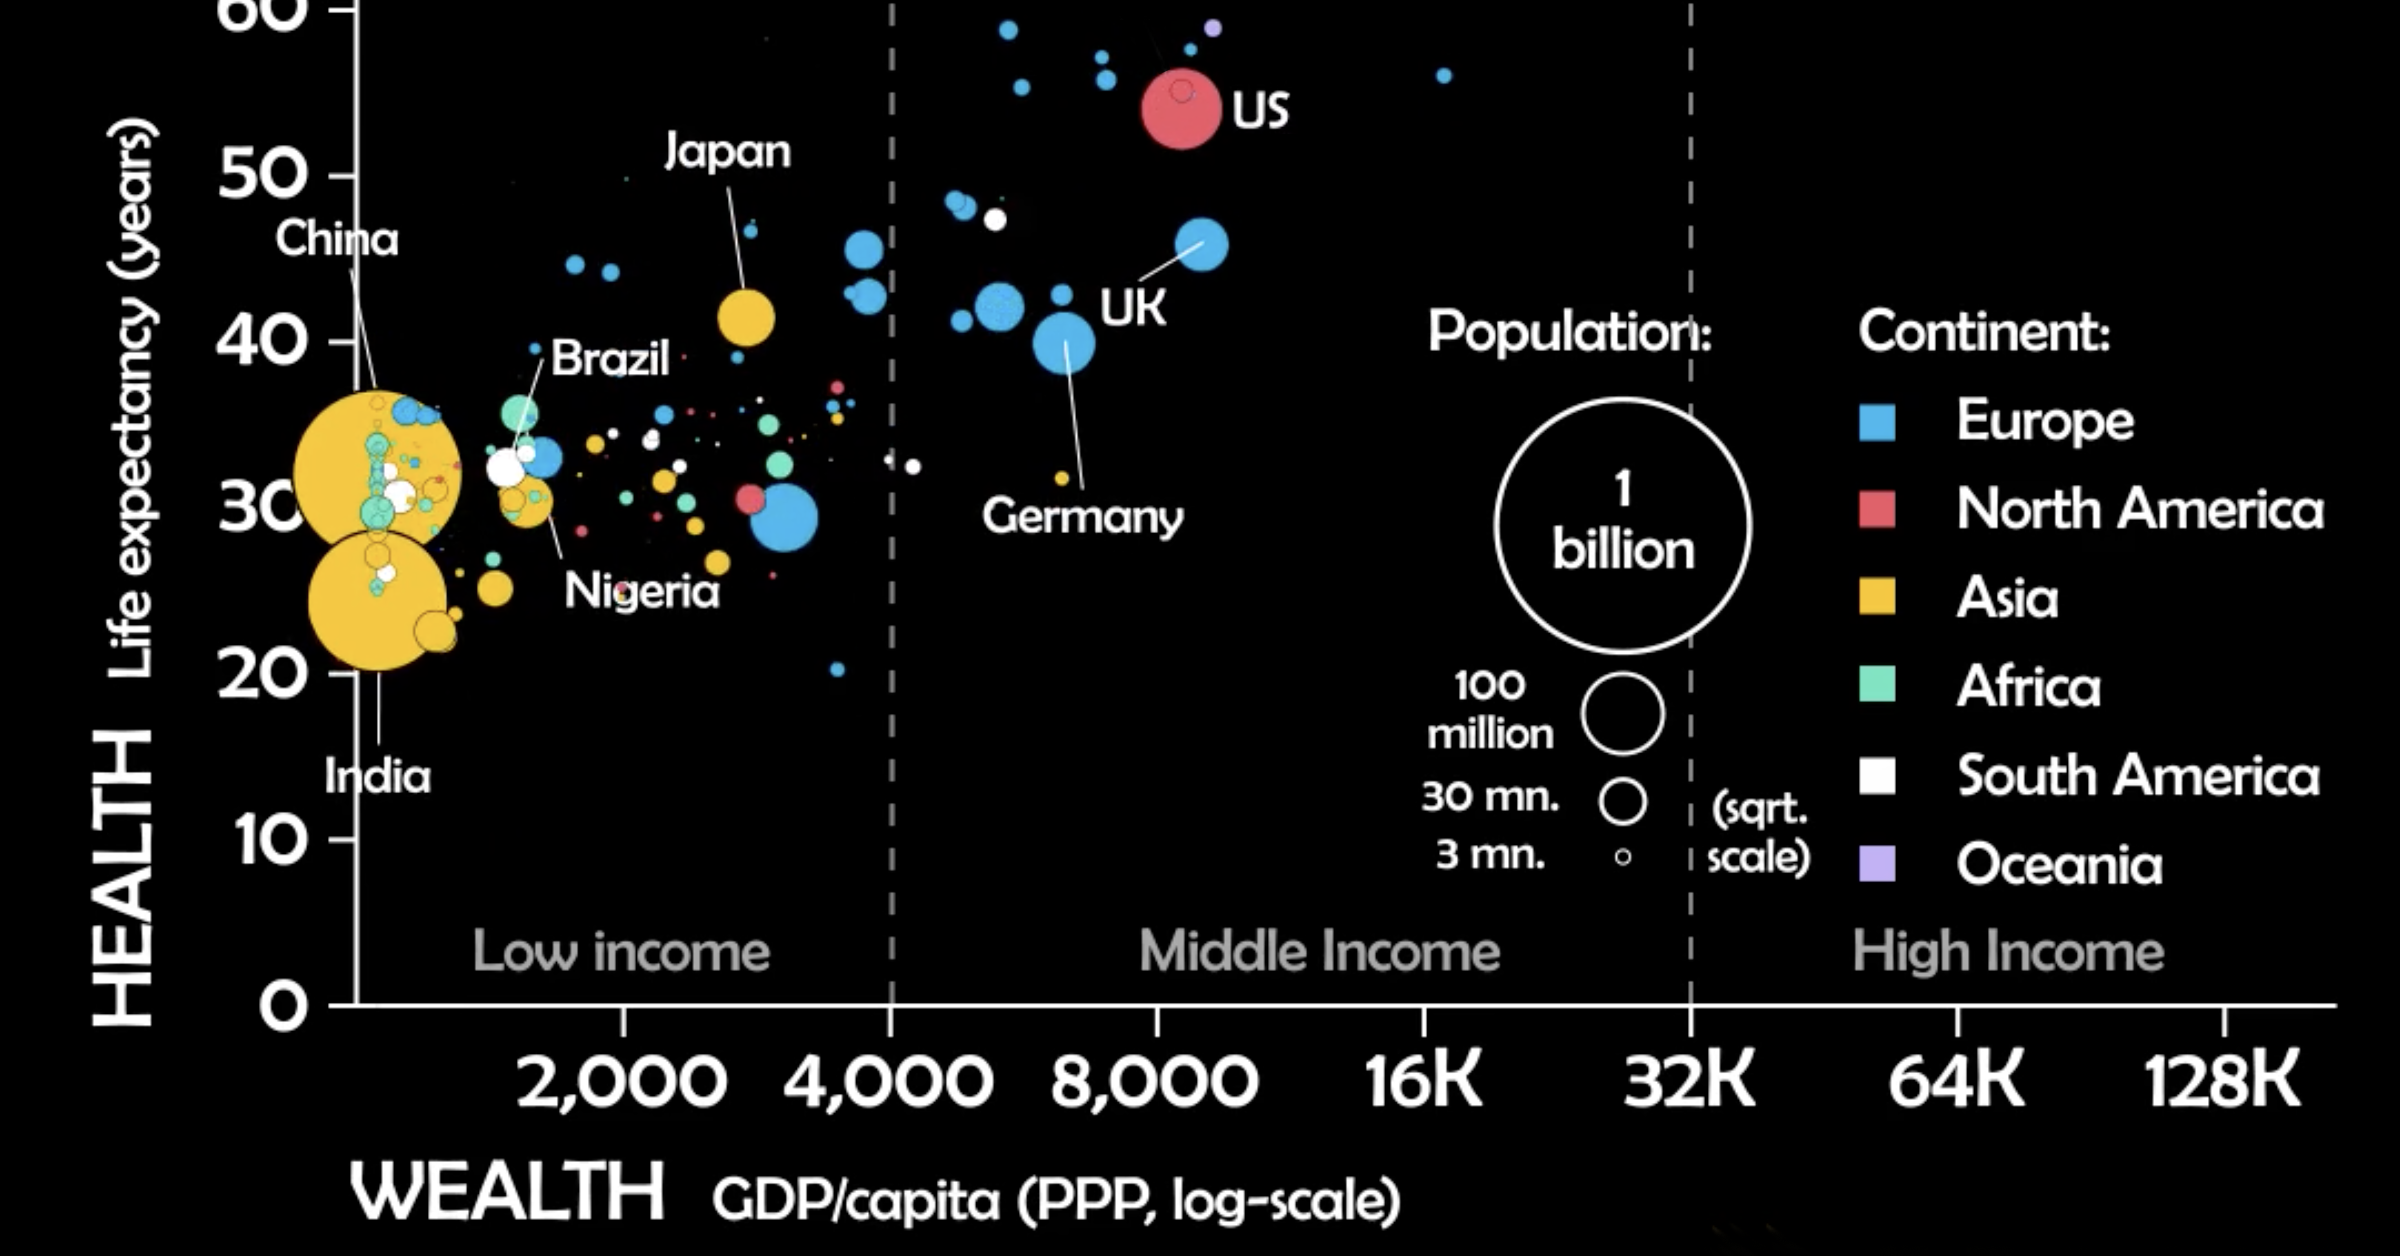
How Global Health and Wealth Has Changed Over Two Centuries
How Global Health and Wealth Has Changed Over 221 Years
At the dawn of the 19th century, global life expectancy was only 28.5 years.
Outbreaks, war, and famine would still kill millions of people at regular intervals. These issues are still stubbornly present in 21st century society, but broadly speaking, the situation around the world has vastly improved. Today, most of humanity lives in countries where the life expectancy is above the typical retirement age of 65.
At the same time, while inequality remains a hot button topic within countries, income disparity between countries is slowing beginning to narrow.
This animated visualization, created by James Eagle, tracks the evolution of health and wealth factors in countries around the world. For further exploration, Gapminder also has a fantastic interactive chart that showcases the same dataset.
The Journey to the Upper-Right Quadrant
In general terms, history has seen health practices improve and countries become increasingly wealthy–trends that are reflected in this visualization. In fact, most countries drift towards the upper-right quadrant over the 221 years covered in the dataset.
However, that path to the top-right, which indicates high levels of both life expectancy and GDP per capita, is rarely a linear journey. Here are some of the noteworthy events and milestones to watch out for while viewing the animation.
1880s: Breaking the 50-Year Barrier
In the late 19th century, Nordic countries such as Sweden and Norway already found themselves past the 50-year life expectancy mark. This was a significant milestone considering the global life expectancy was a full 20 years shorter at the time. It wasn’t until the year 1960 that the global life expectancy would catch up.
1918: The Spanish Flu and WWI
At times, a confluence of factors can impact health and wealth in countries and regions. In this case, World War I coincided with one of the deadliest pandemics in history, leading to global implications. In the animation, this is abundantly clear as the entire cluster of circles takes a nose dive for a short period of time.
1933, 1960: Communist Famines
At various points in history, human decisions can have catastrophic consequences. This was the case in the Soviet Union (1933) and the People’s Republic of China (1960), where life expectancy plummeted during famines that killed millions of people. These extreme events are easy to spot in the animation due to the large populations of the countries in question.
1960s: Oil Economies Kick into High Gear
During this time, Iran, Iraq, and Saudi Arabia all experience massive booms in wealth, and in the following decade, smaller countries such as the United Arab Emirates and Kuwait rocket to the right edge of the visualization.
In following decades, both Iran and Iraq can be seen experiencing wild fluctuations in both health and wealth as regime changes and conflict begin to destabilize the region.
1990s: AIDS in Africa
In the animation, a number of countries plummet in unison at the end of the 20th century. These are sub-Saharan African countries that were hit hard by the AIDS pandemic. At its peak in the early ’00s, the disease accounted for more than half of deaths in some countries.
1995: Breaking the 65-Year Barrier
Global life expectancy reaches retirement age. At this point in time, there is a clear divide in both health and wealth between African and South Asian countries and the rest of the world. Thankfully, that gap is would continue to narrow in coming years.
1990-2000s: China’s Economic Rise
With a population well over a billion people, it’s impossible to ignore China in any global overview. Starting from the early ’90s, China begins its march from the left to right side of the chart, highlighting the unprecedented economic growth it experienced during that time.
What the Future Holds
If current trends continue, global life expectancy is expected to surpass the 80-year mark by 2100. And, sub-Saharan Africa, which has the lowest life expectancy today, is expected to mostly close the gap, reaching 75 years of age.
Wealth is also expected to increase nearly across the board, with the biggest gains coming from places like Vietnam, Nigeria, and the Philippines. Some experts are projecting the world economy as a whole to double in size by 2050.
There are always bumps along the way, but it appears that the journey to the upper-right quadrant is still very much underway.


Economy
Economic Growth Forecasts for G7 and BRICS Countries in 2024
The IMF has released its economic growth forecasts for 2024. How do the G7 and BRICS countries compare?


G7 & BRICS Real GDP Growth Forecasts for 2024
The International Monetary Fund’s (IMF) has released its real gross domestic product (GDP) growth forecasts for 2024, and while global growth is projected to stay steady at 3.2%, various major nations are seeing declining forecasts.
This chart visualizes the 2024 real GDP growth forecasts using data from the IMF’s 2024 World Economic Outlook for G7 and BRICS member nations along with Saudi Arabia, which is still considering an invitation to join the bloc.
Get the Key Insights of the IMF’s World Economic Outlook
Want a visual breakdown of the insights from the IMF’s 2024 World Economic Outlook report?
This visual is part of a special dispatch of the key takeaways exclusively for VC+ members.
Get the full dispatch of charts by signing up to VC+.
Mixed Economic Growth Prospects for Major Nations in 2024
Economic growth projections by the IMF for major nations are mixed, with the majority of G7 and BRICS countries forecasted to have slower growth in 2024 compared to 2023.
Only three BRICS-invited or member countries, Saudi Arabia, the UAE, and South Africa, have higher projected real GDP growth rates in 2024 than last year.
| Group | Country | Real GDP Growth (2023) | Real GDP Growth (2024P) |
|---|---|---|---|
| G7 | 🇺🇸 U.S. | 2.5% | 2.7% |
| G7 | 🇨🇦 Canada | 1.1% | 1.2% |
| G7 | 🇯🇵 Japan | 1.9% | 0.9% |
| G7 | 🇫🇷 France | 0.9% | 0.7% |
| G7 | 🇮🇹 Italy | 0.9% | 0.7% |
| G7 | 🇬🇧 UK | 0.1% | 0.5% |
| G7 | 🇩🇪 Germany | -0.3% | 0.2% |
| BRICS | 🇮🇳 India | 7.8% | 6.8% |
| BRICS | 🇨🇳 China | 5.2% | 4.6% |
| BRICS | 🇦🇪 UAE | 3.4% | 3.5% |
| BRICS | 🇮🇷 Iran | 4.7% | 3.3% |
| BRICS | 🇷🇺 Russia | 3.6% | 3.2% |
| BRICS | 🇪🇬 Egypt | 3.8% | 3.0% |
| BRICS-invited | 🇸🇦 Saudi Arabia | -0.8% | 2.6% |
| BRICS | 🇧🇷 Brazil | 2.9% | 2.2% |
| BRICS | 🇿🇦 South Africa | 0.6% | 0.9% |
| BRICS | 🇪🇹 Ethiopia | 7.2% | 6.2% |
| 🌍 World | 3.2% | 3.2% |
China and India are forecasted to maintain relatively high growth rates in 2024 at 4.6% and 6.8% respectively, but compared to the previous year, China is growing 0.6 percentage points slower while India is an entire percentage point slower.
On the other hand, four G7 nations are set to grow faster than last year, which includes Germany making its comeback from its negative real GDP growth of -0.3% in 2023.
Faster Growth for BRICS than G7 Nations
Despite mostly lower growth forecasts in 2024 compared to 2023, BRICS nations still have a significantly higher average growth forecast at 3.6% compared to the G7 average of 1%.
While the G7 countries’ combined GDP is around $15 trillion greater than the BRICS nations, with continued higher growth rates and the potential to add more members, BRICS looks likely to overtake the G7 in economic size within two decades.
BRICS Expansion Stutters Before October 2024 Summit
BRICS’ recent expansion has stuttered slightly, as Argentina’s newly-elected president Javier Milei declined its invitation and Saudi Arabia clarified that the country is still considering its invitation and has not joined BRICS yet.
Even with these initial growing pains, South Africa’s Foreign Minister Naledi Pandor told reporters in February that 34 different countries have submitted applications to join the growing BRICS bloc.
Any changes to the group are likely to be announced leading up to or at the 2024 BRICS summit which takes place October 22-24 in Kazan, Russia.
Get the Full Analysis of the IMF’s Outlook on VC+
This visual is part of an exclusive special dispatch for VC+ members which breaks down the key takeaways from the IMF’s 2024 World Economic Outlook.
For the full set of charts and analysis, sign up for VC+.

-

 Mining1 week ago
Gold vs. S&P 500: Which Has Grown More Over Five Years?
-

 Markets2 weeks ago
Ranked: The Most Valuable Housing Markets in America
-

 Money2 weeks ago
Which States Have the Highest Minimum Wage in America?
-

 AI2 weeks ago
Ranked: Semiconductor Companies by Industry Revenue Share
-

 Markets2 weeks ago
Ranked: The World’s Top Flight Routes, by Revenue
-

 Countries2 weeks ago
Population Projections: The World’s 6 Largest Countries in 2075
-

 Markets2 weeks ago
The Top 10 States by Real GDP Growth in 2023
-

 Demographics2 weeks ago
The Smallest Gender Wage Gaps in OECD Countries