Markets
Animated: Global Debt Projections (2005-2027P)
Animated Chart: Global Debt Projections
Total global debt stands at nearly $305 trillion as of the first quarter of 2023.
Over the next five years, it is projected to jump even further—raising concerns about government leverage in a high interest rate and slower growth environment.
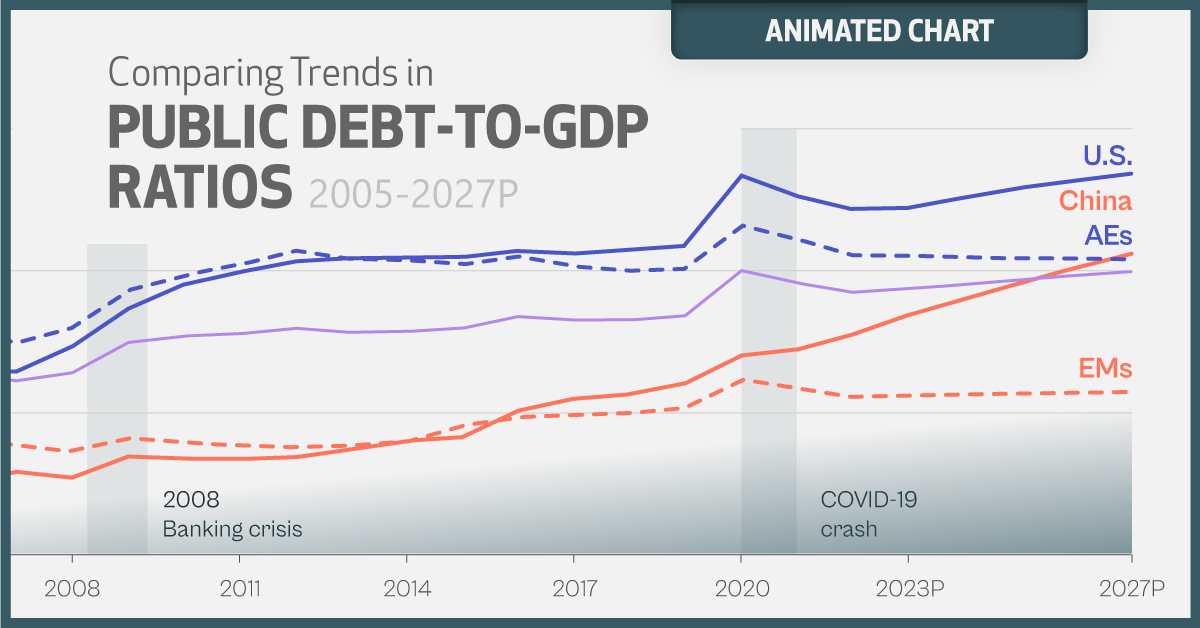
As global debt continues to climb, this animated graphic shows data and projections for public debt-to-GDP ratios using the World Economic Outlook (April 2023 update) from the IMF.
Growing Global Debt Projections
After rising steadily for years, government debt first ballooned to almost 100% of GDP in 2020. While this ratio has fallen amid an economic rebound and high inflation in 2021 and 2022, it is projected to regain ground and continue climbing.
World government debt is now projected to rise to 99.5% of GDP by 2027. Here’s data going back to 2005, as well as the forecast for global public debt-to-GDP:
| Year | 🇺🇸 U.S. | 🇨🇳 China | 🌎 Global Average |
|---|---|---|---|
| 2027P | 134.0% | 105.9% | 99.5% |
| 2026P | 131.8% | 101.0% | 98.2% |
| 2025P | 129.2% | 95.7% | 96.8% |
| 2024P | 125.9% | 90.1% | 95.1% |
| 2023P | 122.2% | 84.4% | 93.6% |
| 2022 | 121.7% | 77.5% | 92.3% |
| 2021 | 126.4% | 72.3% | 95.7% |
| 2020 | 133.5% | 70.1% | 99.8% |
| 2019 | 108.7% | 60.4% | 84.2% |
| 2018 | 107.4% | 56.7% | 82.8% |
| 2017 | 106.2% | 55.0% | 82.6% |
| 2016 | 107.2% | 50.7% | 83.8% |
| 2015 | 105.1% | 41.5% | 79.9% |
| 2014 | 104.5% | 40.0% | 78.6% |
| 2013 | 104.5% | 37.0% | 78.3% |
| 2012 | 103.0% | 34.4% | 79.7% |
| 2011 | 99.5% | 33.8% | 77.9% |
| 2010 | 95.1% | 33.9% | 76.9% |
| 2009 | 86.6% | 34.6% | 74.7% |
| 2008 | 73.4% | 27.2% | 64.3% |
| 2007 | 64.6% | 29.2% | 61.3% |
| 2006 | 64.2% | 25.6% | 64.3% |
| 2005 | 65.4% | 26.3% | 68.1% |
Debt sharply increased in both 2020 and 2009 in conjunction with economic downturns. Historically, debt levels compared to GDP tend to increase as little as 4% and much as 15% in the five years after a global recession has ended.
In the U.S., public debt-to-GDP is set to reach a record 134% by 2027. The sharp rise in interest rates is increasing net debt servicing costs, which stood at $475 billion last year. Over the next 10 years, net interest costs on U.S. debt are projected to total $10.6 trillion.
China’s debt has also risen rapidly, and is projected to eclipse 100% by 2026. Public debt as a percentage of GDP is forecast to jump fourfold between 2005 and 2027. This year alone, new government debt issuance is projected to hit record levels. A large portion of this debt consists of infrastructure bonds that are focused on boosting the economy.
Comparing Trends Across Global Economies
Below, we show how the public debt-to-GDP ratios for advanced economies compare with emerging markets and low-income countries. Both the U.S. and China are excluded here:
| Year | Advanced Economies | Emerging Markets | Low-Income Countries |
|---|---|---|---|
| 2027P | 103.8% | 57.2% | 43.8% |
| 2026P | 104.1% | 56.9% | 44.5% |
| 2025P | 104.4% | 56.6% | 45.3% |
| 2024P | 104.5% | 56.1% | 46.3% |
| 2023P | 105.2% | 55.7% | 47.6% |
| 2022 | 105.5% | 55.2% | 47.9% |
| 2021 | 111.3% | 58.6% | 47.9% |
| 2020 | 115.8% | 61.4% | 48.0% |
| 2019 | 100.8% | 51.6% | 42.6% |
| 2018 | 100.0% | 49.8% | 41.5% |
| 2017 | 101.7% | 49.1% | 41.2% |
| 2016 | 104.9% | 48.3% | 38.6% |
| 2015 | 102.3% | 45.2% | 35.1% |
| 2014 | 103.4% | 39.9% | 31.2% |
| 2013 | 104.0% | 38.4% | 30.9% |
| 2012 | 107.1% | 38.0% | 29.9% |
| 2011 | 102.2% | 38.3% | 29.9% |
| 2010 | 98.4% | 39.6% | 28.4% |
| 2009 | 93.1% | 41.1% | 29.9% |
| 2008 | 79.9% | 36.4% | 27.5% |
| 2007 | 74.7% | 38.4% | 29.4% |
| 2006 | 78.8% | 41.0% | 33.0% |
| 2005 | 82.2% | 45.9% | 42.0% |
In a retreat from 2020 highs, public debt is projected to fall meaningfully compared to GDP by 2027 for advanced economies excluding America. Emerging markets are also projected to see this leverage ratio decline.
Low-income countries have smaller debt levels compared to output, which is expected to continue over the next five years. Despite this, 39 of these countries are in debt distress—or are close to it—as high interest rates add pressure to government balance sheets.
Are High Global Debt Levels Sustainable?
The good news is that 60% of economies are forecast to see their public debt-to-GDP ratios fall below COVID-19 peaks by 2027.
On the other hand, many large advanced and emerging economies, including China, Brazil, Japan, and Türkiye are projected to face steeper debt. In the U.S., payments on public debt have soared to record levels due to rising interest rates.
This comes as aging populations, slower economic growth, and healthcare costs are straining government spending, a trend seen across many advanced economies.
Countries with economic growth rising faster than real interest rates may be more likely to sustain high debt levels. But sticky inflation, prompting higher interest rates, will likely make these debt piles even more fragile.


Markets
Visualizing Global Inflation Forecasts (2024-2026)
Here are IMF forecasts for global inflation rates up to 2026, highlighting a slow descent of price pressures amid resilient global growth.


Visualizing Global Inflation Forecasts (2024-2026)
Global inflation rates are gradually descending, but progress has been slow.
Today, the big question is if inflation will decline far enough to trigger easing monetary policy. So far, the Federal Reserve has held rates for nine months amid stronger than expected core inflation, which excludes volatile energy and food prices.
Yet looking further ahead, inflation forecasts from the International Monetary Fund (IMF) suggest that inflation will decline as price pressures ease, but the path of disinflation is not without its unknown risks.
This graphic shows global inflation forecasts, based on data from the April 2024 IMF World Economic Outlook.
Get the Key Insights of the IMF’s World Economic Outlook
Want a visual breakdown of the insights from the IMF’s 2024 World Economic Outlook report?
This visual is part of a special dispatch of the key takeaways exclusively for VC+ members.
Get the full dispatch of charts by signing up to VC+.
The IMF’s Inflation Outlook
Below, we show the IMF’s latest projections for global inflation rates through to 2026:
| Year | Global Inflation Rate (%) | Advanced Economies Inflation Rate (%) | Emerging Market and Developing Economies Inflation Rate (%) |
|---|---|---|---|
| 2019 | 3.5 | 1.4 | 5.1 |
| 2020 | 3.2 | 0.7 | 5.2 |
| 2021 | 4.7 | 3.1 | 5.9 |
| 2022 | 8.7 | 7.3 | 9.8 |
| 2023 | 6.8 | 4.6 | 8.3 |
| 2024 | 5.9 | 2.6 | 8.3 |
| 2025 | 4.5 | 2.0 | 6.2 |
| 2026 | 3.7 | 2.0 | 4.9 |
After hitting a peak of 8.7% in 2022, global inflation is projected to fall to 5.9% in 2024, reflecting promising inflation trends amid resilient global growth.
While inflation has largely declined due to falling energy and goods prices, persistently high services inflation poses challenges to mitigating price pressures. In addition, the IMF highlights the potential risk of an escalating conflict in the Middle East, which could lead to energy price shocks and higher shipping costs.
These developments could negatively affect inflation scenarios and prompt central banks to adopt tighter monetary policies. Overall, by 2026, global inflation is anticipated to decline to 3.7%—still notably above the 2% target set by several major economies.
Adding to this, we can see divergences in the path of inflation between advanced and emerging economies. While affluent nations are forecast to see inflation edge closer to the 2% target by 2026, emerging economies are projected to have inflation rates reach 4.9%—falling closer to their pre-pandemic averages.
Get the Full Analysis of the IMF’s Outlook on VC+
This visual is part of an exclusive special dispatch for VC+ members which breaks down the key takeaways from the IMF’s 2024 World Economic Outlook.
For the full set of charts and analysis, sign up for VC+.

-

 Culture6 days ago
The World’s Top Media Franchises by All-Time Revenue
-

 Science2 weeks ago
Visualizing the Average Lifespans of Mammals
-

 Brands2 weeks ago
How Tech Logos Have Evolved Over Time
-

 Energy2 weeks ago
Ranked: The Top 10 EV Battery Manufacturers in 2023
-

 Countries2 weeks ago
Countries With the Largest Happiness Gains Since 2010
-

 Economy2 weeks ago
VC+: Get Our Key Takeaways From the IMF’s World Economic Outlook
-

 Demographics1 week ago
The Countries That Have Become Sadder Since 2010
-

 Money1 week ago
Charted: Who Has Savings in This Economy?