Markets
3 Insights From the FED’s Latest Economic Snapshot
3 Insights From the Latest U.S. Economic Data
Each month, the Federal Reserve Bank of New York publishes monthly economic snapshots.
To make this report accessible to a wider audience, we’ve identified the three most important takeaways from the report and compiled them into one infographic.
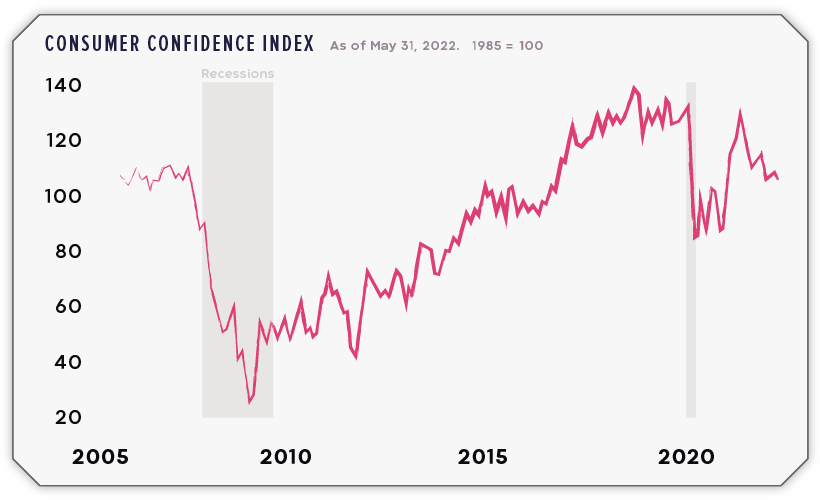
1. Growth figures in Q2 will make or break a recession
Generally speaking, a recession begins when an economy exhibits two consecutive quarters of negative GDP growth. Because U.S. GDP shrank by -1.5% in Q1 2022 (January to March), a lot rests on the Q2 figure (April to June) which should be released on July 28th.
Referencing strong business activity and continued growth in consumer spending, economists predict that U.S. GDP will grow by +2.1% in Q2. This would mark a decisive reversal from Q1, and put an end to recessionary fears for the time being.
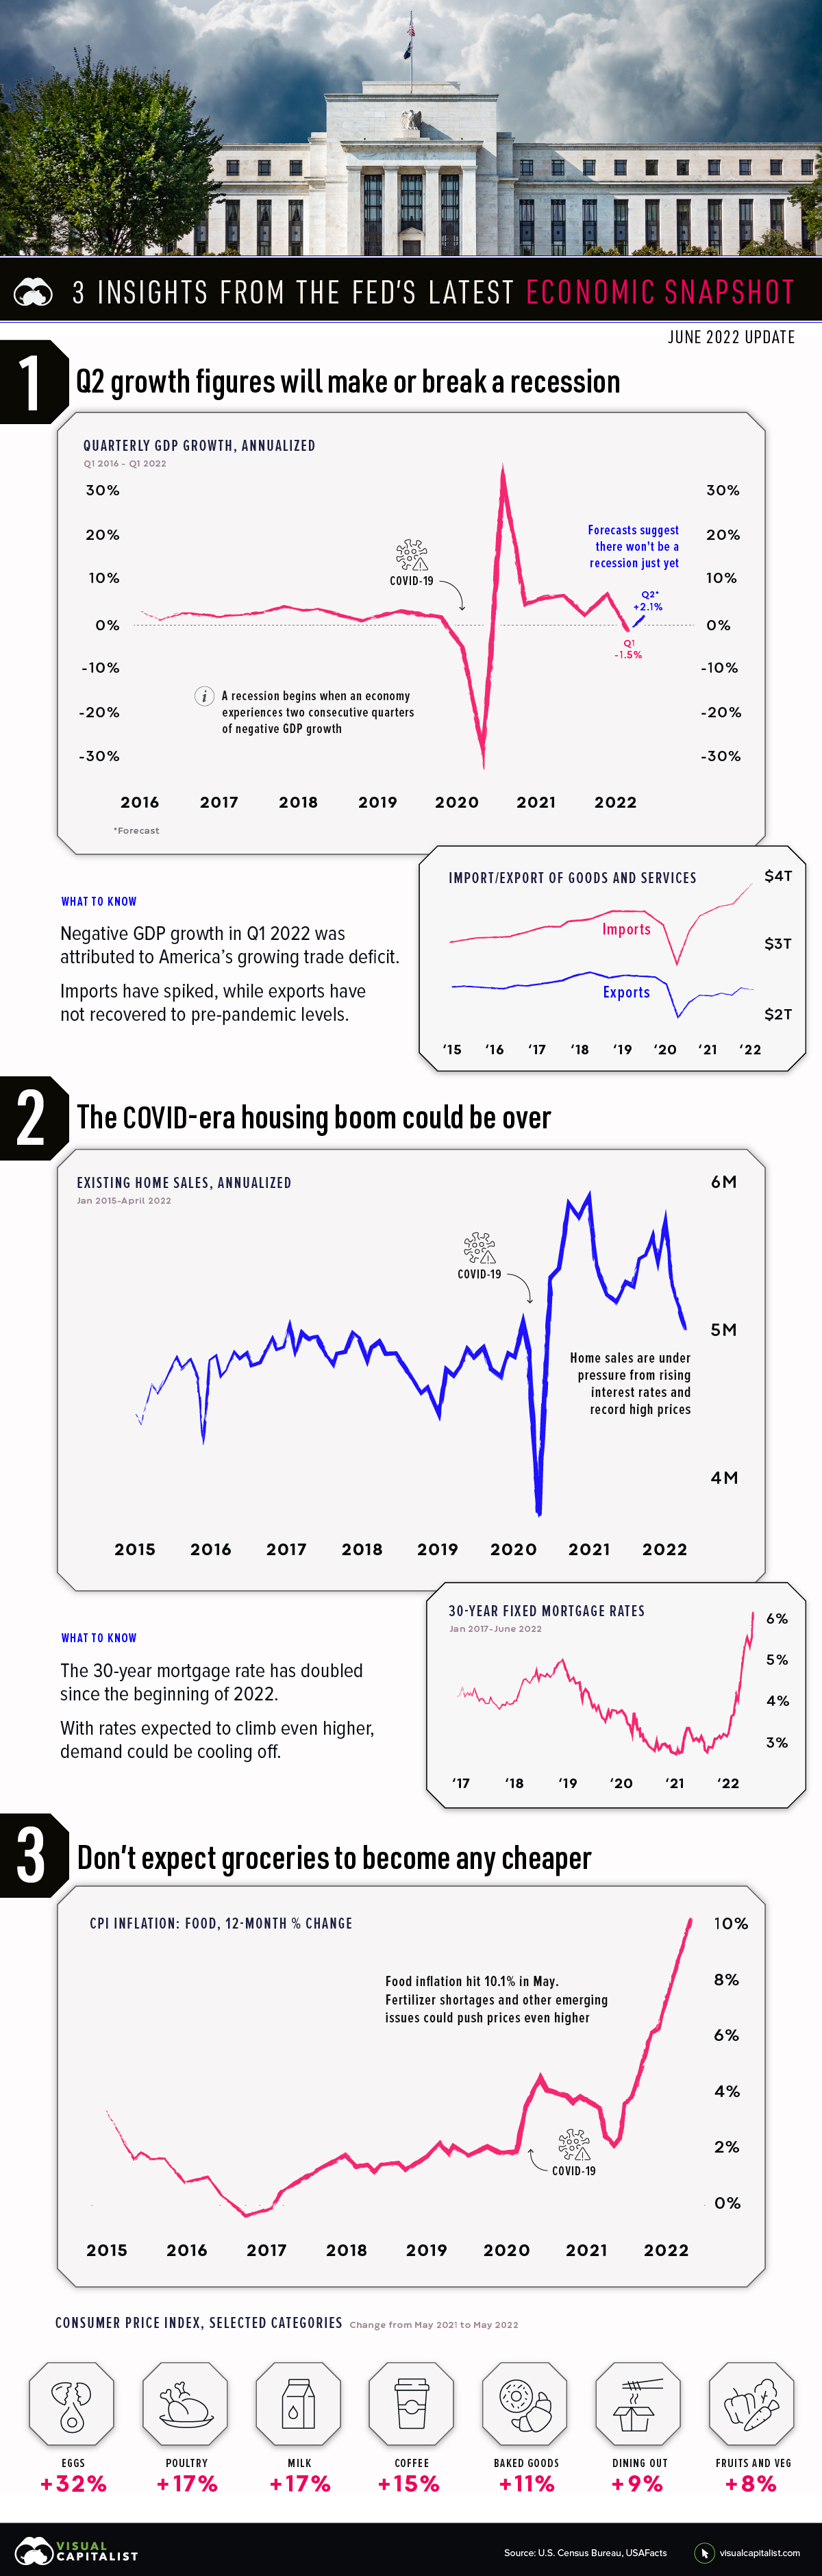
Unfortunately, inflation is the top financial concern for Americans, and this is dampening consumer confidence. Shown below, the consumer confidence index reflects the public’s short-term outlook for income, business, and labor conditions.
Falling consumer confidence suggests that more people will delay big purchases such as cars, major appliances, and vacations.
2. The COVID-era housing boom could be over
Housing markets have been riding high since the beginning of the COVID-19 pandemic, but this run is likely coming to an end. Here’s a summary of what’s happened since 2020:
- Lockdowns in early 2020 created lots of pent-up demand for homes
- Greater household savings and record-low mortgage rates pushed demand even further
- Supply chain disruptions greatly increased the cost of materials like lumber
- Construction of new homes couldn’t keep up, and housing supply fell to historic lows
Today, home prices are at record highs and the cost of borrowing is rapidly rising. For evidence, look no further than the 30-year fixed mortgage rate, which has doubled to more than 6% since the beginning of 2022.
Given these developments, the drop in the number of home sales could be a sign that many Americans are being priced out of the market.
3. Don’t expect groceries to become any cheaper
Inflation has been a hot topic this year, especially with gas prices reaching $5 a gallon. But there’s one category of goods that’s perhaps even more alarming: food.
The following table includes food inflation over the past three years, as the percent change over the past 12 months.
| Date | CPI Food Component (%) |
|---|---|
| 2018-02-01 | 1.4% |
| 2019-05-01 | 2.0% |
| 2019-06-01 | 1.9% |
| 2019-07-01 | 1.8% |
| 2019-08-01 | 1.7% |
| 2019-09-01 | 1.8% |
| 2019-10-01 | 2.1% |
| 2019-11-01 | 2.0% |
| 2019-12-01 | 1.8% |
| 2020-01-01 | 1.8% |
| 2020-02-01 | 1.8% |
| 2020-03-01 | 1.9% |
| 2020-04-01 | 3.5% |
| 2020-05-01 | 4.0% |
| 2020-06-01 | 4.5% |
| 2020-07-01 | 4.1% |
| 2020-08-01 | 4.1% |
| 2020-09-01 | 4.0% |
| 2020-10-01 | 3.9% |
| 2020-11-01 | 3.7% |
| 2020-12-01 | 3.9% |
| 2021-01-01 | 3.8% |
| 2021-02-01 | 3.6% |
| 2021-03-01 | 3.5% |
| 2021-04-01 | 2.4% |
| 2021-05-01 | 2.1% |
| 2021-06-01 | 2.4% |
| 2021-07-01 | 3.4% |
| 2021-08-01 | 3.7% |
| 2021-09-01 | 4.6% |
| 2021-10-01 | 5.3% |
| 2021-11-01 | 6.1% |
| 2021-12-01 | 6.3% |
| 2022-01-01 | 7.0% |
| 2022-02-01 | 7.9% |
| 2022-03-01 | 8.8% |
| 2022-04-01 | 9.4% |
| 2022-05-01 | 10.1% |
From this data, we can see that food inflation really picked up speed in April 2020, jumping to +3.5% from +1.9% in the previous month. This was due to supply chain disruptions and a sudden rebound in global demand.
Fast forward to today, and food inflation is running rampant at 10.1%. A contributing factor is the impending fertilizer shortage, which stems from the Ukraine war. As it turns out, Russia is not only a massive exporter of oil, but wheat and fertilizer as well.


Markets
Mapped: Europe’s GDP Per Capita, by Country
Which European economies are richest on a GDP per capita basis? This map shows the results for 44 countries across the continent.


Mapped: Europe’s GDP Per Capita, by Country (2024)
This was originally posted on our Voronoi app. Download the app for free on iOS or Android and discover incredible data-driven charts from a variety of trusted sources.
Europe is home to some of the largest and most sophisticated economies in the world. But how do countries in the region compare with each other on a per capita productivity basis?
In this map, we show Europe’s GDP per capita levels across 44 nations in current U.S. dollars. Data for this visualization and article is sourced from the International Monetary Fund (IMF) via their DataMapper tool, updated April 2024.
Europe’s Richest and Poorest Nations, By GDP Per Capita
Luxembourg, Ireland, and Switzerland, lead the list of Europe’s richest nations by GDP per capita, all above $100,000.
| Rank | Country | GDP Per Capita (2024) |
|---|---|---|
| 1 | 🇱🇺 Luxembourg | $131,380 |
| 2 | 🇮🇪 Ireland | $106,060 |
| 3 | 🇨🇭 Switzerland | $105,670 |
| 4 | 🇳🇴 Norway | $94,660 |
| 5 | 🇮🇸 Iceland | $84,590 |
| 6 | 🇩🇰 Denmark | $68,900 |
| 7 | 🇳🇱 Netherlands | $63,750 |
| 8 | 🇸🇲 San Marino | $59,410 |
| 9 | 🇦🇹 Austria | $59,230 |
| 10 | 🇸🇪 Sweden | $58,530 |
| 11 | 🇧🇪 Belgium | $55,540 |
| 12 | 🇫🇮 Finland | $55,130 |
| 13 | 🇩🇪 Germany | $54,290 |
| 14 | 🇬🇧 UK | $51,070 |
| 15 | 🇫🇷 France | $47,360 |
| 16 | 🇦🇩 Andorra | $44,900 |
| 17 | 🇲🇹 Malta | $41,740 |
| 18 | 🇮🇹 Italy | $39,580 |
| 19 | 🇨🇾 Cyprus | $37,150 |
| 20 | 🇪🇸 Spain | $34,050 |
| 21 | 🇸🇮 Slovenia | $34,030 |
| 22 | 🇪🇪 Estonia | $31,850 |
| 23 | 🇨🇿 Czech Republic | $29,800 |
| 24 | 🇵🇹 Portugal | $28,970 |
| 25 | 🇱🇹 Lithuania | $28,410 |
| 26 | 🇸🇰 Slovakia | $25,930 |
| 27 | 🇱🇻 Latvia | $24,190 |
| 28 | 🇬🇷 Greece | $23,970 |
| 29 | 🇭🇺 Hungary | $23,320 |
| 30 | 🇵🇱 Poland | $23,010 |
| 31 | 🇭🇷 Croatia | $22,970 |
| 32 | 🇷🇴 Romania | $19,530 |
| 33 | 🇧🇬 Bulgaria | $16,940 |
| 34 | 🇷🇺 Russia | $14,390 |
| 35 | 🇹🇷 Türkiye | $12,760 |
| 36 | 🇲🇪 Montenegro | $12,650 |
| 37 | 🇷🇸 Serbia | $12,380 |
| 38 | 🇦🇱 Albania | $8,920 |
| 39 | 🇧🇦 Bosnia & Herzegovina | $8,420 |
| 40 | 🇲🇰 North Macedonia | $7,690 |
| 41 | 🇧🇾 Belarus | $7,560 |
| 42 | 🇲🇩 Moldova | $7,490 |
| 43 | 🇽🇰 Kosovo | $6,390 |
| 44 | 🇺🇦 Ukraine | $5,660 |
| N/A | 🇪🇺 EU Average | $44,200 |
Note: Figures are rounded.
Three Nordic countries (Norway, Iceland, Denmark) also place highly, between $70,000-90,000. Other Nordic peers, Sweden and Finland rank just outside the top 10, between $55,000-60,000.
Meanwhile, Europe’s biggest economies in absolute terms, Germany, UK, and France, rank closer to the middle of the top 20, with GDP per capitas around $50,000.
Finally, at the end of the scale, Eastern Europe as a whole tends to have much lower per capita GDPs. In that group, Ukraine ranks last, at $5,660.
A Closer Look at Ukraine
For a broader comparison, Ukraine’s per capita GDP is similar to Iran ($5,310), El Salvador ($5,540), and Guatemala ($5,680).
According to experts, Ukraine’s economy has historically underperformed to expectations. After the fall of the Berlin Wall, the economy contracted for five straight years. Its transition to a Western, liberalized economic structure was overshadowed by widespread corruption, a limited taxpool, and few revenue sources.
Politically, its transformation from authoritarian regime to civil democracy has proved difficult, especially when it comes to institution building.
Finally, after the 2022 invasion of the country, Ukraine’s GDP contracted by 30% in a single year—the largest loss since independence. Large scale emigration—to the tune of six million refugees—is also playing a role.
Despite these challenges, the country’s economic growth has somewhat stabilized while fighting continues.

-

 Markets6 days ago
The World’s Fastest Growing Emerging Markets (2024-2029 Forecast)
-

 Technology2 weeks ago
All of the Grants Given by the U.S. CHIPS Act
-

 Green2 weeks ago
The Carbon Footprint of Major Travel Methods
-

 United States2 weeks ago
Visualizing the Most Common Pets in the U.S.
-

 Culture2 weeks ago
The World’s Top Media Franchises by All-Time Revenue
-

 Visual Capitalist1 week ago
Best Visualizations of April on the Voronoi App
-

 Wealth1 week ago
Charted: Which Country Has the Most Billionaires in 2024?
-

 Markets1 week ago
The Top Private Equity Firms by Country