Markets
All of the World’s Exports by Country, in One Chart
Article/Editing:
All of the World’s Exports by Country, in One Chart
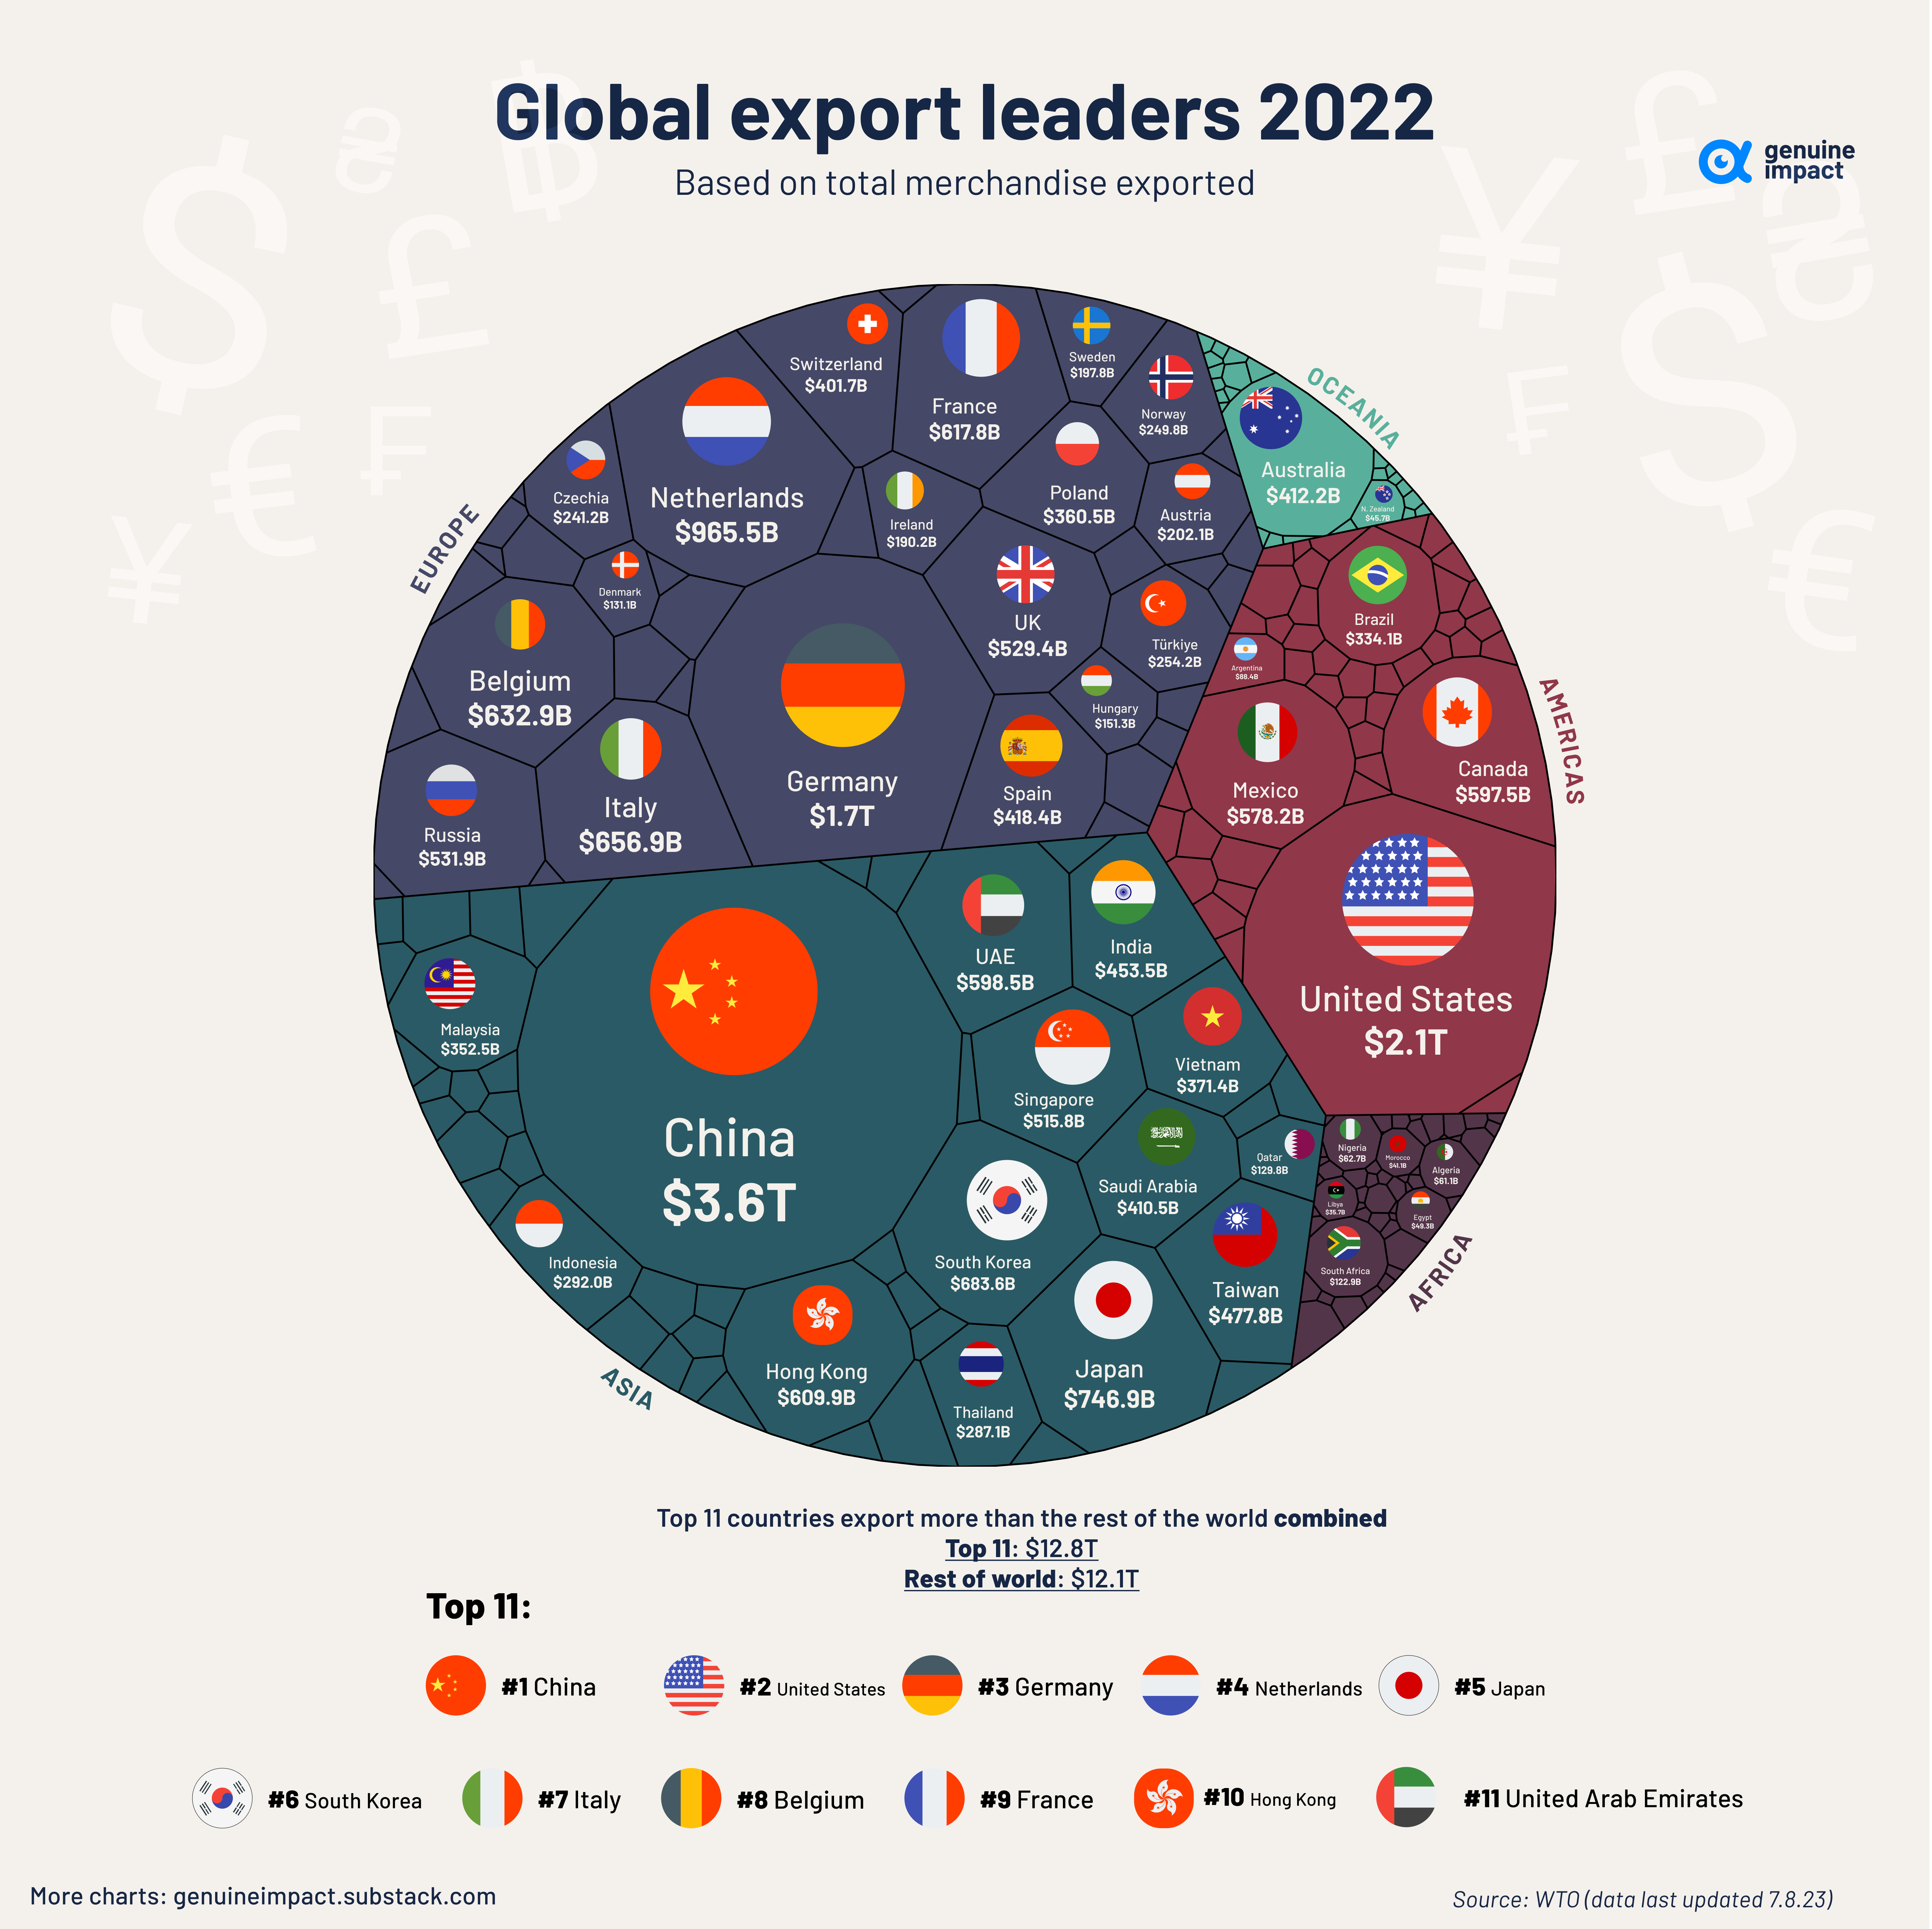
In 2022, the total export value of global goods reached nearly $25 trillion.
With the evolution of international trade, the effects of globalization, and progress in technology, global trade has increased by around 300% over the last 20 years.
This visualization by Truman Du uses data from the World Trade Organization (WTO) to chart the world’s top exporters by country.
China is Still the “World’s Factory”
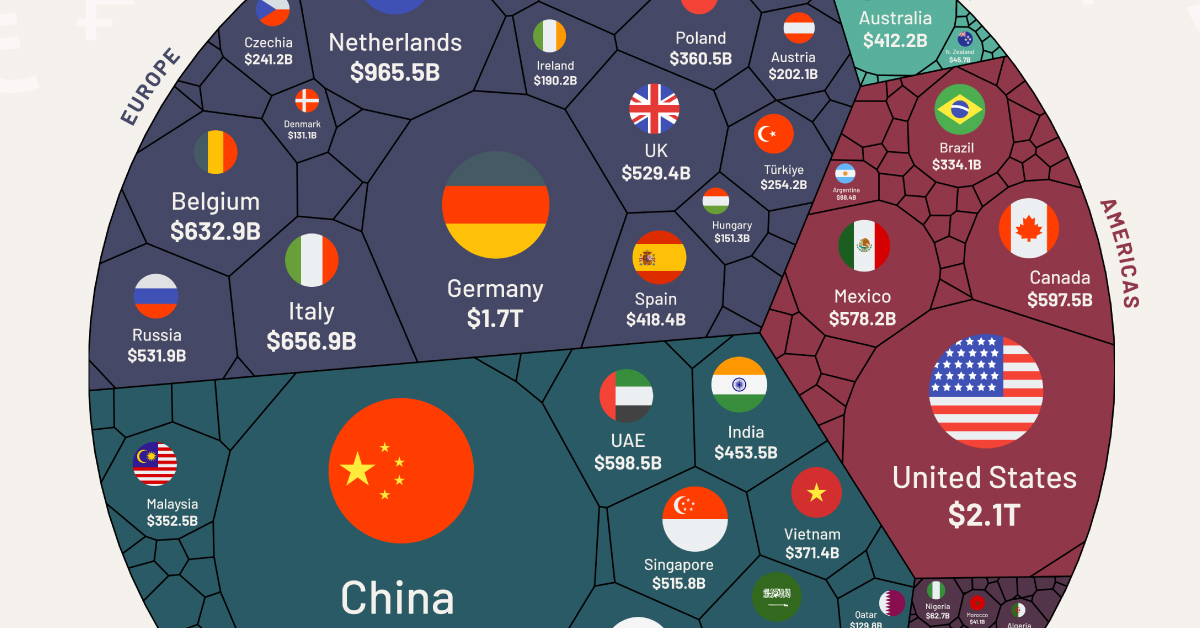
The world’s largest 11 exporters shipped out $12.8 trillion of goods in 2022, more than the rest of the world combined ($12.1 trillion).
The list is headed by China, with $3.6 trillion or 14% of total exports. The country has been the largest exporter of goods in the world since 2009.
| Top 11 | Country | Exports (USD) |
|---|---|---|
| 1 | 🇨🇳 China | $3.6T |
| 2 | 🇺🇸 U.S. | $2.1T |
| 3 | 🇩🇪 Germany | $1.7T |
| 4 | 🇳🇱 Netherlands | $965.5B |
| 5 | 🇯🇵 Japan | $746.9B |
| 6 | 🇰🇷 South Korea | $683.6B |
| 7 | 🇮🇹 Italy | $656.9B |
| 8 | 🇧🇪 Belgium | $632.9B |
| 9 | 🇫🇷 France | $617.8B |
| 10 | 🇭🇰 Hong Kong | $609.9B |
| 11 | 🇦🇪 United Arab Emirates | $598.5B |
In 2022, the top products exported from China by value were phones (including smartphones), computers, optical readers, integrated circuits, solar power diodes, and semiconductors.
Two of China’s primary trading partners are neighboring countries Japan and South Korea.
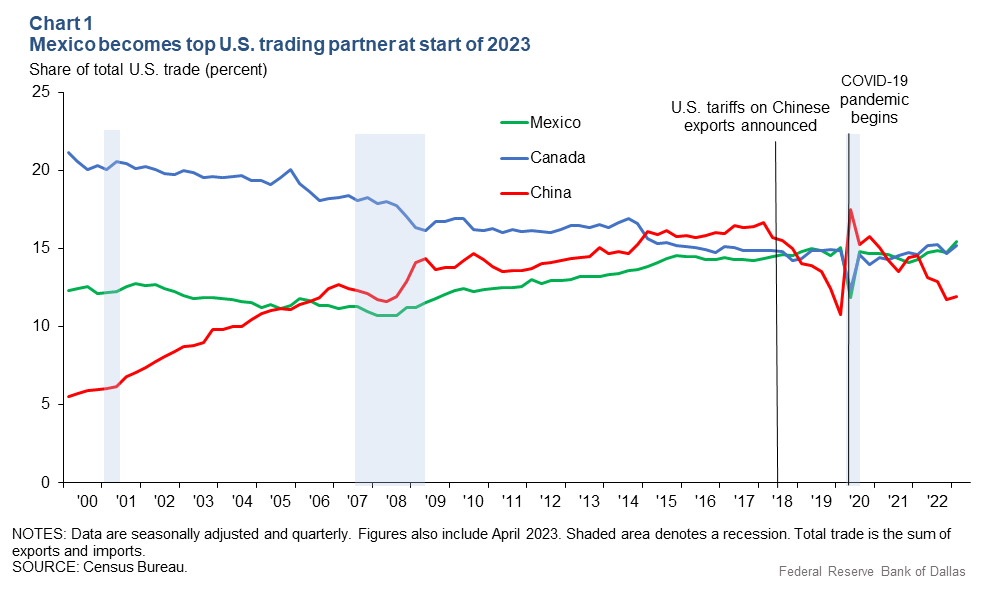
Mexico Surpasses China as America’s Largest Trading Partner
China has built up significant trade relations with the European Union and the United States, two of the world’s largest markets for goods.
However, recent trade tensions have led to China losing its status as the United States’ biggest trading partner in 2023.
Mexico has now overtaken China as the largest seller to the United States. This shift in trade dynamics is part of a broader effort by the U.S. to import goods from closer to home and reduce its dependence on geopolitical rivals.
The U.S. itself is the world’s second largest goods exporter, with over $2 trillion annually.
Canada was the largest purchaser of U.S. exports in 2022, accounting for 17% of total exports, followed by Mexico, China, Japan, and the United Kingdom.
The top exports of the United States are refined petroleum, petroleum gas, crude petroleum, cars, and integrated circuits.
The Regional View of Exports by Country
From a regional perspective, it’s clear Asia dominates the trading market with over 36% of the total exports, followed by Europe with 34%.
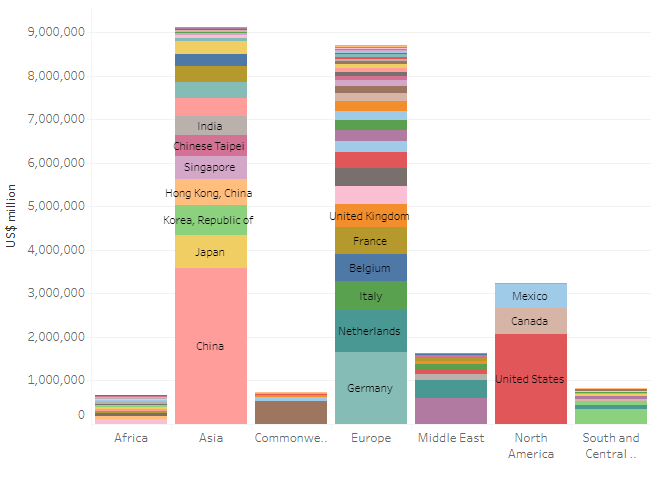
Source: World Trade Organization
While Asian, European, and North American countries have manufactured and technology products among their main exports, African and South American countries mostly export commodities such as oil, gold, diamonds, cocoa, timber, and precious metals.
A New Era of Deglobalization?
International trade grew immensely at the beginning of the 21st century, from $15.6 trillion in 2001 to $40.7 trillion in 2008.
Since then, protectionist trade policies such as taxes on foreign goods and import quotas have increased by 663%. Similarly, global trade as a percent of GDP has also stalled out, peaking in 2008 and going sideways ever since.
Despite many countries reducing their interdependence and integration in the post-COVID era, global exports are still set to grow by 70% between 2020 and 2030, reaching $29.7 trillion by 2030, according to Standard Chartered.

This article was published as a part of Visual Capitalist's Creator Program, which features data-driven visuals from some of our favorite Creators around the world.


Economy
Economic Growth Forecasts for G7 and BRICS Countries in 2024
The IMF has released its economic growth forecasts for 2024. How do the G7 and BRICS countries compare?


G7 & BRICS Real GDP Growth Forecasts for 2024
The International Monetary Fund’s (IMF) has released its real gross domestic product (GDP) growth forecasts for 2024, and while global growth is projected to stay steady at 3.2%, various major nations are seeing declining forecasts.
This chart visualizes the 2024 real GDP growth forecasts using data from the IMF’s 2024 World Economic Outlook for G7 and BRICS member nations along with Saudi Arabia, which is still considering an invitation to join the bloc.
Get the Key Insights of the IMF’s World Economic Outlook
Want a visual breakdown of the insights from the IMF’s 2024 World Economic Outlook report?
This visual is part of a special dispatch of the key takeaways exclusively for VC+ members.
Get the full dispatch of charts by signing up to VC+.
Mixed Economic Growth Prospects for Major Nations in 2024
Economic growth projections by the IMF for major nations are mixed, with the majority of G7 and BRICS countries forecasted to have slower growth in 2024 compared to 2023.
Only three BRICS-invited or member countries, Saudi Arabia, the UAE, and South Africa, have higher projected real GDP growth rates in 2024 than last year.
| Group | Country | Real GDP Growth (2023) | Real GDP Growth (2024P) |
|---|---|---|---|
| G7 | 🇺🇸 U.S. | 2.5% | 2.7% |
| G7 | 🇨🇦 Canada | 1.1% | 1.2% |
| G7 | 🇯🇵 Japan | 1.9% | 0.9% |
| G7 | 🇫🇷 France | 0.9% | 0.7% |
| G7 | 🇮🇹 Italy | 0.9% | 0.7% |
| G7 | 🇬🇧 UK | 0.1% | 0.5% |
| G7 | 🇩🇪 Germany | -0.3% | 0.2% |
| BRICS | 🇮🇳 India | 7.8% | 6.8% |
| BRICS | 🇨🇳 China | 5.2% | 4.6% |
| BRICS | 🇦🇪 UAE | 3.4% | 3.5% |
| BRICS | 🇮🇷 Iran | 4.7% | 3.3% |
| BRICS | 🇷🇺 Russia | 3.6% | 3.2% |
| BRICS | 🇪🇬 Egypt | 3.8% | 3.0% |
| BRICS-invited | 🇸🇦 Saudi Arabia | -0.8% | 2.6% |
| BRICS | 🇧🇷 Brazil | 2.9% | 2.2% |
| BRICS | 🇿🇦 South Africa | 0.6% | 0.9% |
| BRICS | 🇪🇹 Ethiopia | 7.2% | 6.2% |
| 🌍 World | 3.2% | 3.2% |
China and India are forecasted to maintain relatively high growth rates in 2024 at 4.6% and 6.8% respectively, but compared to the previous year, China is growing 0.6 percentage points slower while India is an entire percentage point slower.
On the other hand, four G7 nations are set to grow faster than last year, which includes Germany making its comeback from its negative real GDP growth of -0.3% in 2023.
Faster Growth for BRICS than G7 Nations
Despite mostly lower growth forecasts in 2024 compared to 2023, BRICS nations still have a significantly higher average growth forecast at 3.6% compared to the G7 average of 1%.
While the G7 countries’ combined GDP is around $15 trillion greater than the BRICS nations, with continued higher growth rates and the potential to add more members, BRICS looks likely to overtake the G7 in economic size within two decades.
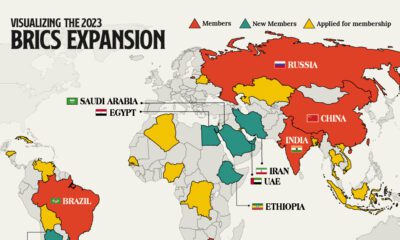
BRICS Expansion Stutters Before October 2024 Summit
BRICS’ recent expansion has stuttered slightly, as Argentina’s newly-elected president Javier Milei declined its invitation and Saudi Arabia clarified that the country is still considering its invitation and has not joined BRICS yet.
Even with these initial growing pains, South Africa’s Foreign Minister Naledi Pandor told reporters in February that 34 different countries have submitted applications to join the growing BRICS bloc.
Any changes to the group are likely to be announced leading up to or at the 2024 BRICS summit which takes place October 22-24 in Kazan, Russia.
Get the Full Analysis of the IMF’s Outlook on VC+
This visual is part of an exclusive special dispatch for VC+ members which breaks down the key takeaways from the IMF’s 2024 World Economic Outlook.
For the full set of charts and analysis, sign up for VC+.

-

 Sports1 week ago
The Highest Earning Athletes in Seven Professional Sports
-

 Countries2 weeks ago
Population Projections: The World’s 6 Largest Countries in 2075
-

 Markets2 weeks ago
The Top 10 States by Real GDP Growth in 2023
-

 Demographics2 weeks ago
The Smallest Gender Wage Gaps in OECD Countries
-

 United States2 weeks ago
Where U.S. Inflation Hit the Hardest in March 2024
-

 Green2 weeks ago
Top Countries By Forest Growth Since 2001
-

 United States2 weeks ago
Ranked: The Largest U.S. Corporations by Number of Employees
-

 Maps2 weeks ago
The Largest Earthquakes in the New York Area (1970-2024)