Culture
Animated Chart: The Rise and Fall of Music Sales, by Format (1973-2021)
Article/Editing:
The Rise and Fall of Music Sales, by Format (1973-2021)
We live in a world of music. Whether when driving to work or jamming out at home, people around the world like to have their favorite tunes playing in the background.
But while our love for music has been constant, the way we consume media has evolved drastically. The past 50 years have seen many different music formats used to access these tunes, mirroring society’s shift from analog to digital.
This video, created by James Eagle using data from the Recording Industry Association of America (RIAA), highlights sales of different music formats in the U.S. over the last 50 years.
Vinyl
Up until the late 1980s, vinyl dominated the music format industry, earning billions of dollars in sales annually. Records of Bruce Springsteen’s Born to Run or Pink Floyd’s Dark Side of the Moon were some of the top selling albums available.
Vinyl is said to provide its listeners with analog sounds that reverberate and the warm notes of almost-live music. For vinyl users and enthusiasts to this day, the music produced by these sleek yet massive records is unparalleled.
8-Track
If you’re a millennial (or younger), you may have never heard of the 8-track. But this music format played an integral part in the history of music.
When the booming automotive vehicle industry found it challenging to translate the music experience to cars using vinyl, it looked to the “Stereo 8” eight-track cartridge, better known as the 8-track. This cartridge used an analog magnetic tape and provided 90 minutes of continuous music play time.
8-track carved a niche for itself much before the advent of cassettes and CDs. And through the proliferation of vehicles, 8-track sales climbed to reach a peak revenue of $900 million in 1978.
Cassettes
The era of cassettes pushed 8-tracks into the history of music in the early 1980s. These pocket-sized tapes were more convenient to use than 8Tracks and quickly spread worldwide.
By 1989, the cassette format reached its peak revenues of $3.7 billion.
CDs
First released in 1982, the Compact Disc or CD came into the music market as the successor to the vinyl record.
Developed by Philips and Sony, sales of the sleek and portable CD grew quickly as home and car stereos alike added CD functionality. The format brought in $13.3 billion in revenue in both 1999 and 2000. To date, no other music format has reached the same milestone since.
Digital Music Formats
When it comes to preferred music formats over time, convenience (and cost) seem to have been the biggest catalysts of change.
From the start of the early 2000s, CDs had started to be replaced by other forms of digital storage and distribution. The massive shift to internet consumption and the introduction of digital music, available through downloads, pushed audio CD sales down rapidly.
The launch of streaming platforms like Spotify in 2006 exacerbated this decline, with CD sales dropping by around $4 billion in five years.
Digital sales continued to evolve. Ringtone sales alone brought in $1.1 billion in 2007, and in 2012, the revenues from downloads shot up to a peak of $2.9 billion. But music streaming platforms kept climbing through 2021, and will likely continue to be the future face of music consumption.
| Rank | Music formats | Revenue in 2021 |
|---|---|---|
| 1 | Streaming | $11.5 billion |
| 2 | Vinyl | $1.0 billion |
| 3 | CD | $0.6 billion |
| 4 | Downloads | $0.5 billion |
| Other | $1.4 billion | |
| Total | $15.1 billion |
Music streaming and subscription services pushed the accessibility of music to new highs, especially with free ad-supported platforms.
In 2021, streaming secured the music industry a whopping $11.5 billion in sales, good for 76% of the total. If it keeps growing in popularity and accessibility, the format could potentially challenge the peak popularity of CDs in the late 90s.
The Vintage Comeback?
There’s no doubt that digital music formats are getting increasingly popular with every passing year. However, one of our vintage and beloved music formats—the vinyl record—seems to be making a comeback.
According to the RIAA database, the revenue earned by LP/EP sales has shot up to $1.0 billion in 2021, its highest total since the mid-1980s.


This article was published as a part of Visual Capitalist's Creator Program, which features data-driven visuals from some of our favorite Creators around the world.


Culture
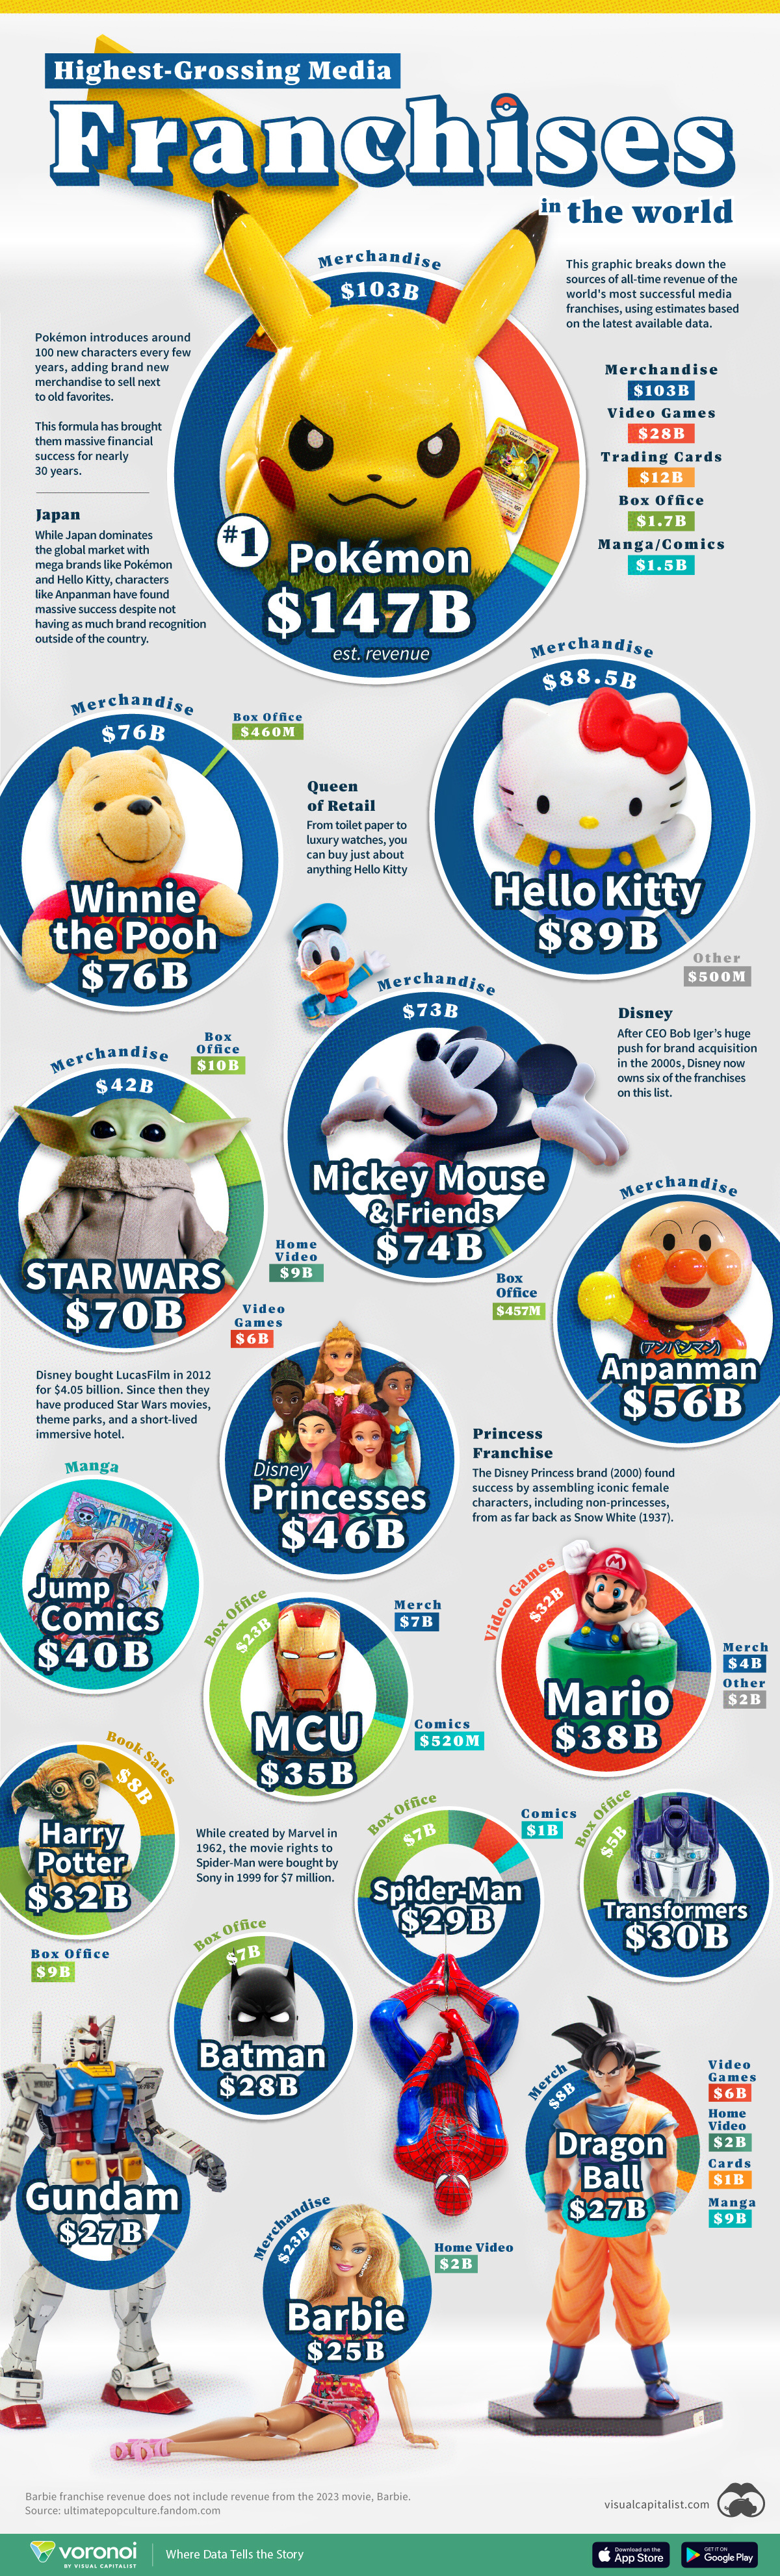
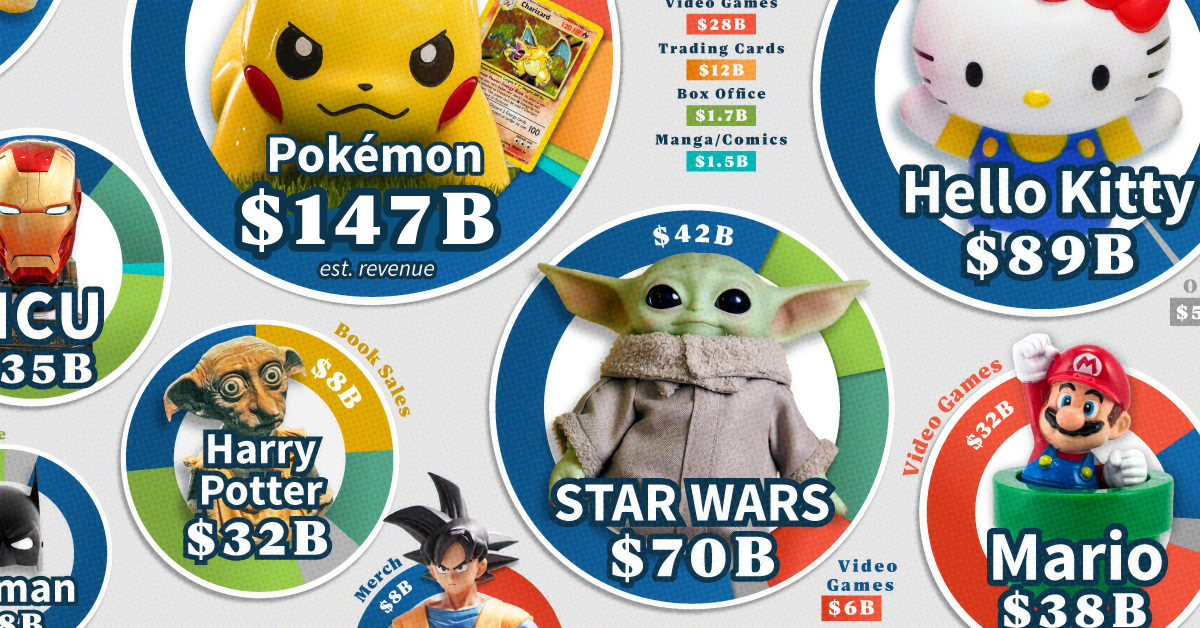
The World’s Top Media Franchises by All-Time Revenue
From Pokémon to Hello Kitty, some media franchises are globally recognizable. How do media franchises compare in terms of all-time revenue?
Global Media Franchises by All-Time Revenue
This was originally posted on our Voronoi app. Download the app for free on iOS or Android and discover incredible data-driven charts from a variety of trusted sources.
From Pikachu to Hello Kitty, some media franchises become so big that their iconic characters are recognizable to nearly everyone in the world. But how exactly do these mega media franchises make their money, and how do they compare in terms of all-time revenue?
This graphic visualizes and ranks the world’s largest media franchises by their all-time revenue, showing the main revenue sources for each media franchise using data from Fandom.
Japan’s Media Franchises Reign
With more than half of the media franchises in this graphic originating from Japan, the Asian country dominates when it comes to modern popular media franchises.
The country has produced some of the biggest media franchises which span across mediums, whether it’s video games with Pokémon and Mario, or comics, animated series, and toys with franchises like Dragon Ball and Transformers.
| Media Franchise | Total Estimated Revenue | Merchandise Revenue | Video Games Revenue | Trading Cards Revenue | Box Office Revenue | Manga/Comics Revenue | Book Sales Revenue | Home Video Revenue | Other Revenue |
|---|---|---|---|---|---|---|---|---|---|
| Pokémon | $147.0B | $102.9B | $27.6B | $12.1B | $1.8B | $1.5B | - | $0.9B | - |
| Hello Kitty | $89.0B | $88.5B | - | - | - | $0.02B | - | - | - |
| Winnie the Pooh | $76.0B | $76.2B | - | - | $0.5B | - | - | - | - |
| Mickey Mouse & Friends | $74.0B | $73.4B | - | - | $0.5B | $0.0005B | - | - | - |
| Star Wars | $70.0B | $42.2B | $6.0B | - | $10.3B | - | $1.8B | $9.1B | $0.3B |
| Anpanman | $56.0B | $56.4B | - | - | $0.1B | - | - | - | $0.03B |
| Disney Princess | $46.0B | $46.3B | - | - | - | - | - | - | - |
| Jump Comics (Shōnen Jump) | $40.0B | - | $0.2B | - | - | $39.8B | - | - | - |
| Mario | $38.0B | $4.3B | $32.4B | - | $0.0B | $1.6B | - | - | - |
| Marvel Cinematic Universe (MCU) | $35.0B | $12.5B | - | - | $22.6B | $0.001B | - | - | - |
| Harry Potter | $32.0B | $12.3B | $1.6B | - | $9.9B | - | $7.7B | - | $1.1B |
| Transformers | $30.0B | $12.2B | - | - | $4.9B | - | - | - | $0.9B |
| Spider-Man | $29.0B | $15.9B | $1.7B | - | $7.2B | $1.1B | - | $2.2B | $1.4B |
| Batman | $28.0B | $21.3B | - | - | $6.1B | - | - | $1.2B | $0.3B |
| Dragon Ball | $27.0B | $7.7B | $6.2B | $1.0B | $0.8B | $9.2B | - | $2.1B | $0.05B |
| Gundam | $26.9B | $26.4B | - | - | - | $0.2B | - | - | $0.3B |
| Barbie* | $24.7B | $22.7B | - | - | $0.01B | - | - | $2.0B | - |
*Barbie’s revenue does not include revenue from the 2023 movie Barbie.
Even Japanese media franchises which have had less international exposure and revenue, like Anpanman and Jump Comics, have netted tens of billions in revenue mostly from their domestic popularity.
Besides Japan, Disney is the other dominant force when it comes to global media franchises, with all of the 10 largest franchises either hailing from Japan or owned by Disney.
Disney’s Major Media Acquisitions
Over the past two decades, Disney has built up a significant catalog of major media franchises through two key multi-billion dollar acquisitions.
Disney’s acquisitions of Marvel Entertainment for $4.4 billion in 2009 and Lucasfilm for $4.05 billion in 2012 added massive media franchises to their portfolio like Star Wars, the Marvel Cinematic Universe, and Spider-Man.
While Sony bought the movie rights to Spider-Man for just $7 million from Marvel in 1999, Disney owns the rights to Spider-Man in all other forms, including merchandising, television, and comics.
Movies Make their Comeback for Media Franchises
This past decade has seen various popular media franchises take another stab at expanding into the medium of movies and TV shows, this time finding significant success.
Whether it’s animated movies like The Super Mario Bros. Movie or live-action adaptations like Barbie or Netflix’s series of Jump Comics properties like One Piece, these film forays have been successful in revenue terms and in expanding their franchise fanbases.
On top of this, companies like Nintendo are tapping into their franchises to expand beyond movies, with Mario now also the leading mascot for the Super Nintendo World theme park area which has locations at both Universal Studios Japan and Hollywood.

-

 Science1 week ago
Visualizing the Average Lifespans of Mammals
-

 Markets2 weeks ago
The Top 10 States by Real GDP Growth in 2023
-

 Demographics2 weeks ago
The Smallest Gender Wage Gaps in OECD Countries
-

 United States2 weeks ago
Where U.S. Inflation Hit the Hardest in March 2024
-

 Green2 weeks ago
Top Countries By Forest Growth Since 2001
-

 United States2 weeks ago
Ranked: The Largest U.S. Corporations by Number of Employees
-

 Maps2 weeks ago
The Largest Earthquakes in the New York Area (1970-2024)
-

 Green2 weeks ago
Ranked: The Countries With the Most Air Pollution in 2023