Misc
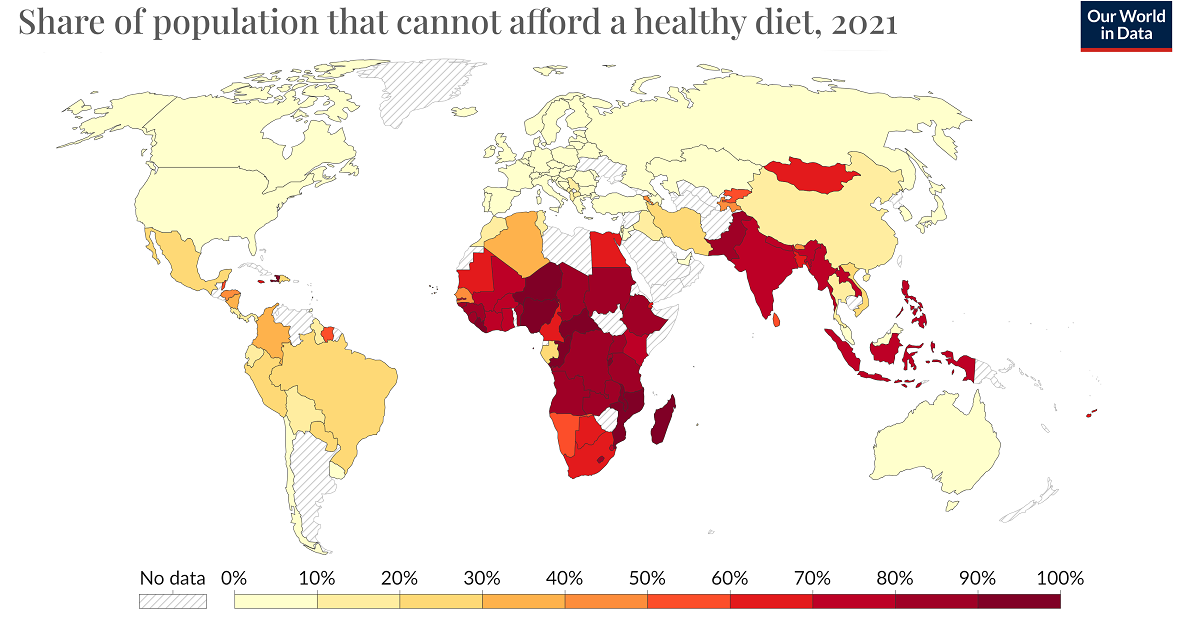
Mapped: Food Unaffordability Across the World
Article/Editing:
Mapped: Food Unaffordability Across the World
Food is the palate’s poetry, the body’s fuel, and a shared language transcending cultures—when people can afford it.
The World Health Organization found that the COVID-19 pandemic and war in Ukraine pushed 122 million more people into food insecurity between 2019 and 2022. Higher food prices, combined with increasing poverty, have resulted in rising food unaffordability, especially in certain regions of the world.
Our World in Data uses statistics gathered by the World Bank to map the share of the population that cannot afford a healthy diet in every country it has data for.
Ranked: Food Unaffordability as a Share of Population
A healthy diet—in this case, one that meets government dietary guidelines—is considered unaffordable in a country when its cost exceeds 52% of per capita income per day.
Immediate trends in food unaffordability are discoverable from a glance at the map. The wash of red in Africa, South Asia, and Southeast Asia indicates the regions where the majority of the population cannot afford a healthy diet.
Ranking the countries by pure percentages in the table below allows us to get a closer look at country-level issues.
| Rank | Country | Can't Afford Healthy Diet |
|---|---|---|
| 1 | 🇲🇬 Madagascar | 97.8% |
| 2 | 🇧🇮 Burundi | 95.9% |
| 3 | 🇲🇼 Malawi | 95.9% |
| 4 | 🇨🇫 Central African Republic | 94.6% |
| 5 | 🇳🇬 Nigeria | 93.5% |
| 6 | 🇱🇷 Liberia | 92.8% |
| 7 | 🇭🇹 Haiti | 92.6% |
| 8 | 🇲🇿 Mozambique | 92.5% |
| 9 | 🇳🇪 Niger | 92.0% |
| 10 | 🇨🇬 Congo | 91.5% |
| 11 | 🇿🇲 Zambia | 90.0% |
| 12 | 🇬🇳 Guinea | 89.1% |
| 13 | 🇦🇴 Angola | 88.0% |
| 14 | 🇱🇸 Lesotho | 87.9% |
| 15 | 🇨🇩 DRC | 85.5% |
| 16 | 🇸🇩 Sudan | 85.4% |
| 17 | 🇹🇿 Tanzania | 85.0% |
| 18 | 🇬🇼 Guinea-Bissau | 84.6% |
| 19 | 🇪🇹 Ethiopia | 83.8% |
| 20 | 🇸🇱 Sierra Leone | 83.5% |
| 21 | 🇹🇩 Chad | 83.1% |
| 22 | 🇵🇰 Pakistan | 82.8% |
| 23 | 🇧🇯 Benin | 82.6% |
| 24 | 🇷🇼 Rwanda | 82.0% |
| 25 | 🇺🇬 Uganda | 81.7% |
| 26 | 🇸🇹 Sao Tome & Principe | 78.2% |
| 27 | 🇧🇫 Burkina Faso | 77.6% |
| 28 | 🇬🇭 Ghana | 77.4% |
| 29 | 🇳🇵 Nepal | 76.4% |
| 30 | 🇮🇳 India | 74.1% |
| 31 | 🇰🇪 Kenya | 74.0% |
| 32 | 🇱🇦 Laos | 74.0% |
| 33 | 🇵🇭 Philippines | 74.0% |
| 34 | 🇸🇿 Eswatini | 73.8% |
| 35 | 🇲🇲 Myanmar | 73.8% |
| 36 | 🇨🇮 Cote d'Ivoire | 72.9% |
| 37 | 🇬🇲 Gambia | 72.2% |
| 38 | 🇲🇱 Mali | 72.0% |
| 39 | 🇮🇩 Indonesia | 70.8% |
| 40 | 🇿🇦 South Africa | 66.7% |
| 41 | 🇧🇩 Bangladesh | 66.1% |
| 42 | 🇩🇯 Djibouti | 65.3% |
| 43 | 🇲🇳 Mongolia | 64.1% |
| 44 | 🇫🇯 Fiji | 63.7% |
| 45 | 🇯🇲 Jamaica | 62.6% |
| 46 | 🇲🇷 Mauritania | 62.4% |
| 47 | 🇪🇬 Egypt | 61.6% |
| 48 | 🇨🇲 Cameroon | 60.5% |
| 49 | 🇧🇼 Botswana | 60.3% |
| 50 | 🇳🇦 Namibia | 59.5% |
| 51 | 🇸🇷 Suriname | 58.6% |
| 52 | 🇰🇬 Kyrgyzstan | 58.2% |
| 53 | 🇱🇰 Sri Lanka | 55.5% |
| 54 | 🇧🇿 Belize | 53.0% |
| 55 | 🇧🇹 Bhutan | 45.2% |
| 56 | 🇸🇳 Senegal | 45.0% |
| 57 | 🇭🇳 Honduras | 44.8% |
| 58 | 🇹🇯 Tajikistan | 44.3% |
| 59 | 🇦🇲 Armenia | 41.4% |
| 60 | 🇨🇻 Cape Verde | 41.2% |
| 61 | 🇳🇮 Nicaragua | 34.2% |
| 62 | 🇩🇿 Algeria | 32.4% |
| 63 | 🇨🇴 Colombia | 31.3% |
| 64 | 🇮🇷 Iran | 30.0% |
| 65 | 🇬🇦 Gabon | 29.9% |
| 66 | 🇱🇨 Saint Lucia | 27.2% |
| 67 | 🇩🇴 Dominican Republic | 25.8% |
| 68 | 🇵🇪 Peru | 25.7% |
| 69 | 🇧🇷 Brazil | 22.4% |
| 70 | 🇻🇳 Vietnam | 21.0% |
| 71 | 🇵🇾 Paraguay | 20.4% |
| 72 | 🇲🇽 Mexico | 20.2% |
| 73 | 🇪🇨 Ecuador | 19.7% |
| 74 | 🇬🇾 Guyana | 18.5% |
| 75 | 🇮🇶 Iraq | 18.4% |
| 76 | 🇹🇭 Thailand | 18.0% |
| 77 | 🇹🇳 Tunisia | 17.1% |
| 78 | 🇵🇦 Panama | 17.0% |
| 79 | 🇦🇱 Albania | 15.9% |
| 80 | 🇲🇦 Morocco | 15.5% |
| 81 | 🇲🇰 North Macedonia | 15.5% |
| 82 | 🇵🇸 Palestine | 15.4% |
| 83 | 🇧🇴 Bolivia | 15.1% |
| 84 | 🇲🇪 Montenegro | 14.9% |
| 85 | 🇨🇷 Costa Rica | 14.2% |
| 86 | 🇲🇺 Mauritius | 14.0% |
| 87 | 🇨🇳 China | 10.9% |
| 88 | 🇷🇸 Serbia | 10.9% |
| 89 | 🇹🇹 Trinidad & Tobago | 9.9% |
| 90 | 🇸🇨 Seychelles | 7.3% |
| 91 | 🇷🇴 Romania | 7.2% |
| 92 | 🇯🇴 Jordan | 7.1% |
| 93 | 🇹🇷 Turkey | 6.0% |
| 94 | 🇺🇾 Uruguay | 5.2% |
| 95 | 🇧🇬 Bulgaria | 4.2% |
| 96 | 🇲🇩 Moldova | 3.8% |
| 97 | 🇨🇱 Chile | 3.5% |
| 98 | 🇧🇦 Bosnia & Herzegovina | 3.0% |
| 99 | 🇷🇺 Russia | 2.6% |
| 100 | 🇲🇾 Malaysia | 2.5% |
| 101 | 🇰🇿 Kazakhstan | 2.3% |
| 102 | 🇸🇰 Slovakia | 2.3% |
| 103 | 🇬🇷 Greece | 2.2% |
| 104 | 🇯🇵 Japan | 2.0% |
| 105 | 🇭🇷 Croatia | 1.8% |
| 106 | 🇪🇸 Spain | 1.8% |
| 107 | 🇭🇺 Hungary | 1.5% |
| 108 | 🇮🇹 Italy | 1.5% |
| 109 | 🇱🇻 Latvia | 1.5% |
| 110 | 🇰🇷 South Korea | 1.5% |
| 111 | 🇮🇱 Israel | 1.2% |
| 112 | 🇲🇻 Maldives | 1.2% |
| 113 | 🇵🇹 Portugal | 1.2% |
| 114 | 🇺🇸 U.S. | 1.2% |
| 115 | 🇦🇹 Austria | 0.9% |
| 116 | 🇪🇪 Estonia | 0.8% |
| 117 | 🇲🇹 Malta | 0.8% |
| 118 | 🇦🇺 Australia | 0.7% |
| 119 | 🇱🇹 Lithuania | 0.7% |
| 120 | 🇸🇪 Sweden | 0.6% |
| 121 | 🇧🇾 Belarus | 0.5% |
| 122 | 🇵🇱 Poland | 0.5% |
| 123 | 🇨🇦 Canada | 0.4% |
| 124 | 🇬🇧 UK | 0.4% |
| 125 | 🇳🇴 Norway | 0.3% |
| 126 | 🇩🇰 Denmark | 0.2% |
| 127 | 🇫🇷 France | 0.2% |
| 128 | 🇩🇪 Germany | 0.2% |
| 129 | 🇧🇪 Belgium | 0.1% |
| 130 | 🇨🇿 Czechia | 0.1% |
| 131 | 🇮🇸 Iceland | 0.1% |
| 132 | 🇮🇪 Ireland | 0.1% |
| 133 | 🇳🇱 Netherlands | 0.1% |
| 134 | 🇦🇪 UAE | 0.1% |
| 135 | 🇦🇿 Azerbaijan | 0.0% |
| 136 | 🇨🇾 Cyprus | 0.0% |
| 137 | 🇫🇮 Finland | 0.0% |
| 138 | 🇱🇺 Luxembourg | 0.0% |
| 139 | 🇸🇮 Slovenia | 0.0% |
| 140 | 🇨🇭 Switzerland | 0.0% |
At the top of the list, nearly 98% of Madagascar’s population cannot afford a healthy diet. The country is facing a prolonged drought in the southern region since 2019, affecting agriculture. A series of cyclones in 2021–2022 destroyed rice fields and damaged critical infrastructure, like road networks, putting further pressure on food prices. Finally, the rising price of oil due to the Russian invasion has pushed up transport costs. All these factors have resulted in food prices jumping nearly 20% in three years.
As a result, food insecurity in Madagascar has risen dramatically—by nearly one million people every year since 2019, of which 250,000 are classified under a “famine situation.”
A mix of similar factors affect the next five countries with the highest share of population unable to afford food—Burundi, Malawi, Central African Republic, Nigeria, and Liberia.
In Haiti, ranked 7th, a reliance on food imports makes the country vulnerable to inflation and price volatility, which has been markedly worse in the last two years.
On the other hand, predictably, the top five countries with the least food unaffordability—Cyprus, Finland, Luxembourg, Slovenia, and Switzerland—are all from Europe with 0% of the population unable to afford a healthy diet.
| Region | Can't Afford a Healthy Diet |
|---|---|
| Sub-Saharan Africa | 83.5% |
| South Asia | 74.2% |
| Middle East & North Africa | 34.0% |
| East Asia & the Pacific | 22.8% |
| Latin America & the Caribbean | 22.7% |
| Europe & Central Asia | 3.1% |
| North America | 1.1% |
| World | 42.2% |
Geographically, eight out of 10 people in sub-Saharan Africa and seven out of 10 people in South Asia cannot afford a healthy diet versus three out of 10 in Europe and one out of 10 in North America.
Healthy Diet vs. Nutrient and Calorie Sufficiency
When reducing the quality of diet, food becomes a little more affordable.
For example, in Indonesia, nearly 71% of the population cannot afford a healthy diet. However this drops to 64% for a nutrient-sufficient diet, and only 3% for a calorie-sufficient diet.
| Country | Can't Afford a Healthy Diet | Can't Afford a Nutrient-Sufficient Diet | Can't afford a Calorie-Sufficient Diet |
|---|---|---|---|
| 🇦🇱 Albania | 15.9% | 8.9% | 0.0% |
| 🇩🇿 Algeria | 32.4% | 6.2% | 0.1% |
| 🇦🇴 Angola | 88.0% | 71.1% | 36.0% |
| 🇦🇷 Argentina | N/A | 4.0% | 0.2% |
| 🇦🇲 Armenia | 41.4% | 14.3% | 0.5% |
| 🇦🇺 Australia | 0.7% | 0.5% | 0.2% |
| 🇦🇹 Austria | 0.9% | 0.5% | 0.2% |
| 🇦🇿 Azerbaijan | 0.0% | 0.0% | 0.0% |
| 🇧🇩 Bangladesh | 66.1% | 48.6% | 0.6% |
| 🇧🇾 Belarus | 0.5% | 0.2% | 0.0% |
| 🇧🇪 Belgium | 0.1% | 0.3% | 0.1% |
| 🇧🇿 Belize | 53.0% | 57.0% | 19.6% |
| 🇧🇯 Benin | 82.6% | 81.9% | 13.7% |
| 🇧🇹 Bhutan | 45.2% | 26.2% | 0.7% |
| 🇧🇴 Bolivia | 15.1% | 19.1% | 6.8% |
| 🇧🇦 Bosnia & Herzegovina | 3.0% | 2.4% | 0.0% |
| 🇧🇼 Botswana | 60.3% | 44.3% | 1.3% |
| 🇧🇷 Brazil | 22.4% | 18.1% | 3.5% |
| 🇧🇬 Bulgaria | 4.2% | 6.3% | 0.3% |
| 🇧🇫 Burkina Faso | 77.6% | 76.2% | 5.4% |
| 🇧🇮 Burundi | 95.9% | 84.1% | 41.5% |
| 🇨🇲 Cameroon | 60.5% | 48.6% | 15.7% |
| 🇨🇦 Canada | 0.4% | 0.5% | 0.0% |
| 🇨🇻 Cape Verde | 41.2% | 29.7% | 0.3% |
| 🇨🇫 Central African Republic | 94.6% | 83.3% | 67.0% |
| 🇹🇩 Chad | 83.1% | 60.6% | 11.3% |
| 🇨🇱 Chile | 3.5% | 1.6% | 0.2% |
| 🇨🇳 China | 10.9% | 9.7% | 0.2% |
| 🇨🇴 Colombia | 31.3% | 20.3% | 3.5% |
| 🇨🇬 Congo | 91.5% | 80.8% | 39.9% |
| 🇨🇷 Costa Rica | 14.2% | 7.8% | 0.7% |
| 🇨🇮 Cote d'Ivoire | 72.9% | 39.6% | 8.4% |
| 🇭🇷 Croatia | 1.8% | 3.3% | 0.3% |
| 🇨🇾 Cyprus | 0.0% | 0.1% | 0.0% |
| 🇨🇿 Czechia | 0.1% | 0.1% | 0.0% |
| 🇨🇩 DRC | 85.5% | 86.9% | 27.9% |
| 🇩🇰 Denmark | 0.2% | 0.2% | 0.1% |
| 🇩🇯 Djibouti | 65.3% | 59.0% | 5.6% |
| 🇩🇴 Dominican Republic | 25.8% | 15.8% | 1.3% |
| 🇪🇨 Ecuador | 19.7% | 14.8% | 4.4% |
| 🇪🇬 Egypt | 61.6% | 33.5% | 1.0% |
| 🇪🇪 Estonia | 0.8% | 0.8% | 0.2% |
| 🇸🇿 Eswatini | 73.8% | 64.4% | 26.6% |
| 🇪🇹 Ethiopia | 83.8% | 62.7% | 7.7% |
| 🇫🇯 Fiji | 63.7% | 21.3% | 0.2% |
| 🇫🇮 Finland | 0.0% | 0.1% | 0.1% |
| 🇫🇷 France | 0.2% | 0.0% | 0.0% |
| 🇬🇦 Gabon | 29.9% | 16.3% | 1.3% |
| 🇬🇲 Gambia | 72.2% | 63.9% | 10.6% |
| 🇩🇪 Germany | 0.2% | 0.7% | 0.2% |
| 🇬🇭 Ghana | 77.4% | 62.9% | 14.9% |
| 🇬🇷 Greece | 2.2% | 2.5% | 0.5% |
| 🇬🇳 Guinea | 89.1% | 61.6% | 8.6% |
| 🇬🇼 Guinea-Bissau | 84.6% | 59.7% | 18.3% |
| 🇬🇾 Guyana | 18.5% | 31.7% | 4.4% |
| 🇭🇹 Haiti | 92.6% | 73.8% | 23.5% |
| 🇭🇳 Honduras | 44.8% | 49.9% | 14.3% |
| 🇭🇺 Hungary | 1.5% | 1.9% | 0.3% |
| 🇮🇸 Iceland | 0.1% | 0.0% | 0.0% |
| 🇮🇳 India | 74.1% | 64.0% | 3.2% |
| 🇮🇩 Indonesia | 70.8% | 7.0% | 4.3% |
| 🇮🇷 Iran | 30.0% | 5.0% | 0.2% |
| 🇮🇶 Iraq | 18.4% | 5.8% | 0.1% |
| 🇮🇪 Ireland | 0.1% | 0.3% | 0.2% |
| 🇮🇱 Israel | 1.2% | 1.2% | 0.2% |
| 🇮🇹 Italy | 1.5% | 2.1% | 1.0% |
| 🇯🇲 Jamaica | 62.6% | 36.6% | 0.9% |
| 🇯🇵 Japan | 2.0% | 1.4% | 1.2% |
| 🇯🇴 Jordan | 7.1% | 0.1% | 0.0% |
| 🇰🇿 Kazakhstan | 2.3% | 0.5% | 0.0% |
| 🇰🇪 Kenya | 74.0% | 57.0% | 11.6% |
| 🇰🇬 Kyrgyzstan | 58.2% | 38.9% | 0.7% |
| 🇱🇦 Laos | 74.0% | 61.1% | 0.8% |
| 🇱🇻 Latvia | 1.5% | 1.7% | 0.2% |
| 🇱🇸 Lesotho | 87.9% | 63.3% | 10.7% |
| 🇱🇷 Liberia | 92.8% | 82.7% | 20.2% |
| 🇱🇹 Lithuania | 0.7% | 1.6% | 0.8% |
| 🇱🇺 Luxembourg | 0.0% | 0.4% | 0.1% |
| 🇲🇬 Madagascar | 97.8% | 96.0% | 78.3% |
| 🇲🇼 Malawi | 95.9% | 83.2% | 2.4% |
| 🇲🇾 Malaysia | 2.5% | 0.9% | 0.0% |
| 🇲🇻 Maldives | 1.2% | 0.6% | 0.0% |
| 🇲🇱 Mali | 72.0% | 57.5% | 1.9% |
| 🇲🇹 Malta | 0.8% | 0.3% | 0.1% |
| 🇲🇷 Mauritania | 62.4% | 48.3% | 2.7% |
| 🇲🇺 Mauritius | 14.0% | 4.4% | 0.0% |
| 🇲🇽 Mexico | 20.2% | 17.2% | 0.7% |
| 🇲🇩 Moldova | 3.8% | 0.3% | 0.0% |
| 🇲🇳 Mongolia | 64.1% | 14.4% | 0.1% |
| 🇲🇪 Montenegro | 14.9% | 9.1% | 1.6% |
| 🇲🇦 Morocco | 15.5% | 6.5% | 0.0% |
| 🇲🇿 Mozambique | 92.5% | 83.3% | 13.2% |
| 🇲🇲 Myanmar | 73.8% | 42.7% | 0.7% |
| 🇳🇦 Namibia | 59.5% | 33.6% | 13.9% |
| 🇳🇵 Nepal | 76.4% | 51.0% | 2.6% |
| 🇳🇱 Netherlands | 0.1% | 0.3% | 0.0% |
| 🇳🇮 Nicaragua | 34.2% | 21.2% | 5.7% |
| 🇳🇪 Niger | 92.0% | 77.1% | 13.6% |
| 🇳🇬 Nigeria | 93.5% | 69.4% | 44.4% |
| 🇲🇰 North Macedonia | 15.5% | 16.8% | 2.6% |
| 🇳🇴 Norway | 0.3% | 0.5% | 0.3% |
| 🇵🇰 Pakistan | 82.8% | 40.9% | 0.3% |
| 🇵🇸 Palestine | 15.4% | 2.4% | 0.6% |
| 🇵🇦 Panama | 17.0% | 12.1% | 2.2% |
| 🇵🇾 Paraguay | 20.4% | 24.4% | 0.5% |
| 🇵🇪 Peru | 25.7% | 16.5% | 2.7% |
| 🇵🇭 Philippines | 74.0% | 53.1% | 6.9% |
| 🇵🇱 Poland | 0.5% | 0.1% | 0.0% |
| 🇵🇹 Portugal | 1.2% | 0.7% | 0.1% |
| 🇷🇴 Romania | 7.2% | 8.0% | 0.9% |
| 🇷🇺 Russia | 2.6% | 0.8% | 0.0% |
| 🇷🇼 Rwanda | 82.0% | 61.3% | 28.1% |
| 🇱🇨 Saint Lucia | 27.2% | 16.7% | 4.6% |
| 🇸🇹 Sao Tome & Principe | 78.2% | 63.4% | 8.0% |
| 🇸🇳 Senegal | 45.0% | 43.2% | 3.3% |
| 🇷🇸 Serbia | 10.9% | 14.3% | 3.2% |
| 🇸🇨 Seychelles | 7.3% | 2.5% | 0.1% |
| 🇸🇱 Sierra Leone | 83.5% | 73.3% | 34.9% |
| 🇸🇰 Slovakia | 2.3% | 1.4% | 0.1% |
| 🇸🇮 Slovenia | 0.0% | 0.0% | 0.0% |
| 🇿🇦 South Africa | 66.7% | 60.3% | 24.2% |
| 🇰🇷 South Korea | 1.5% | 1.5% | 0.0% |
| 🇪🇸 Spain | 1.8% | 1.0% | 0.5% |
| 🇱🇰 Sri Lanka | 55.5% | 22.8% | 0.6% |
| 🇸🇩 Sudan | 85.4% | 58.7% | 15.3% |
| 🇸🇷 Suriname | 58.6% | 34.2% | 15.8% |
| 🇸🇪 Sweden | 0.6% | 0.4% | 0.2% |
| 🇨🇭 Switzerland | 0.0% | 0.0% | 0.0% |
| 🇹🇼 Taiwan | N/A | 0.2% | 0.0% |
| 🇹🇯 Tajikistan | 44.3% | 33.3% | 2.3% |
| 🇹🇿 Tanzania | 85.0% | 75.6% | 36.8% |
| 🇹🇭 Thailand | 18.0% | 7.0% | 0.0% |
| 🇹🇹 Trinidad & Tobago | 9.9% | 3.4% | 0.2% |
| 🇹🇳 Tunisia | 17.1% | 1.9% | 0.0% |
| 🇹🇷 Turkey | 6.0% | 3.1% | 0.0% |
| 🇺🇬 Uganda | 81.7% | 68.9% | 13.9% |
| 🇦🇪 UAE | 0.1% | 0.0% | 0.0% |
| 🇬🇧 UK | 0.4% | 0.5% | 0.2% |
| 🇺🇸 U.S. | 1.2% | 1.5% | 1.2% |
| 🇺🇾 Uruguay | 5.2% | 0.8% | 0.0% |
| 🇻🇳 Vietnam | 21.0% | 11.7% | 0.7% |
| 🇿🇲 Zambia | 90.0% | 82.5% | 65.1% |
| 🇿🇼 Zimbabwe | N/A | 10.6% | 0.0% |
| 🌐 World | 42.20% | 31.90% | 4.90% |
While the aim is to have every single person able to afford a healthy diet, it is useful to track progress across diets to see which countries are making strides in food affordability, whether it comes from growing incomes or improved supply.
At a regional level, these nuances reveal geographic differences in food unaffordability.
| Region | Can't Afford a Healthy Diet | Can't Afford a Nutrient-Sufficient Diet | Can't afford a Calorie-Sufficient Diet |
|---|---|---|---|
| East Asia & the Pacific | 22.8% | 16.4% | 1.1% |
| Europe & Central Asia | 3.1% | 2.0% | 0.2% |
| Latin America & the Caribbean | 22.7% | 17.9% | 3.0% |
| Middle East & North Africa | 34.0% | 13.4% | 0.4% |
| North America | 1.1% | 1.4% | 1.1% |
| South Asia | 74.2% | 59.0% | 2.6% |
| Sub-Saharan Africa | 83.5% | 67.6% | 24.9% |
| World | 42.2% | 31.9% | 4.9% |
While sub-Saharan Africa and South Asia have comparable shares of population unable to afford healthy and nutrient sufficient diets, the gap widens immensely when looking at just calorie-sufficient diets, nearly 25% versus 2.6%.
For countries in South Asia, this could help target efforts to improve affordability for more than the most basic of diets.

This article was published as a part of Visual Capitalist's Creator Program, which features data-driven visuals from some of our favorite Creators around the world.


VC+
VC+: Get Our Key Takeaways From the IMF’s World Economic Outlook
A sneak preview of the exclusive VC+ Special Dispatch—your shortcut to understanding IMF’s World Economic Outlook report.

Have you read IMF’s latest World Economic Outlook yet? At a daunting 202 pages, we don’t blame you if it’s still on your to-do list.
But don’t worry, you don’t need to read the whole April release, because we’ve already done the hard work for you.
To save you time and effort, the Visual Capitalist team has compiled a visual analysis of everything you need to know from the report—and our VC+ Special Dispatch is available exclusively to VC+ members. All you need to do is log into the VC+ Archive.
If you’re not already subscribed to VC+, make sure you sign up now to access the full analysis of the IMF report, and more (we release similar deep dives every week).
For now, here’s what VC+ members get to see.
Your Shortcut to Understanding IMF’s World Economic Outlook
With long and short-term growth prospects declining for many countries around the world, this Special Dispatch offers a visual analysis of the key figures and takeaways from the IMF’s report including:
- The global decline in economic growth forecasts
- Real GDP growth and inflation forecasts for major nations in 2024
- When interest rate cuts will happen and interest rate forecasts
- How debt-to-GDP ratios have changed since 2000
- And much more!

Get the Full Breakdown in the Next VC+ Special Dispatch
VC+ members can access the full Special Dispatch by logging into the VC+ Archive, where you can also check out previous releases.
Make sure you join VC+ now to see exclusive charts and the full analysis of key takeaways from IMF’s World Economic Outlook.
Don’t miss out. Become a VC+ member today.
What You Get When You Become a VC+ Member
VC+ is Visual Capitalist’s premium subscription. As a member, you’ll get the following:
- Special Dispatches: Deep dive visual briefings on crucial reports and global trends
- Markets This Month: A snappy summary of the state of the markets and what to look out for
- The Trendline: Weekly curation of the best visualizations from across the globe
- Global Forecast Series: Our flagship annual report that covers everything you need to know related to the economy, markets, geopolitics, and the latest tech trends
- VC+ Archive: Hundreds of previously released VC+ briefings and reports that you’ve been missing out on, all in one dedicated hub
You can get all of the above, and more, by joining VC+ today.

-

 Misc1 week ago
How Hard Is It to Get Into an Ivy League School?
-

 Technology2 weeks ago
Ranked: Semiconductor Companies by Industry Revenue Share
-

 Markets2 weeks ago
Ranked: The World’s Top Flight Routes, by Revenue
-

 Countries2 weeks ago
Population Projections: The World’s 6 Largest Countries in 2075
-

 Markets2 weeks ago
The Top 10 States by Real GDP Growth in 2023
-

 Demographics2 weeks ago
The Smallest Gender Wage Gaps in OECD Countries
-

 United States2 weeks ago
Where U.S. Inflation Hit the Hardest in March 2024
-

 Green2 weeks ago
Top Countries By Forest Growth Since 2001