Markets
Animation: The Largest Public Companies by Market Cap (2000–2022)
Article/Editing:
The Largest Public Companies by Market Cap (2000–2022)
The 10 largest public companies in the world had a combined market capitalization of nearly $12 trillion as of July 2022.
But two decades ago, the players that made up the list of the largest companies by market capitalization were radically different—and as the years ticked by, emerging megatrends and market sentiment have worked to shuffle the deck multiple times.
This racing bar chart by Truman Du shows how the ranking of the top 10 largest public companies has changed from 2000 to 2022.
Market Cap vs. Market Value
Before diving in, it’s worth noting that market capitalization is just one of many metrics that can be used to help value a company.
Simply put, a company’s market cap measures the combined price of a company’s outstanding shares—in other words, it’s the price someone would pay if they wanted to purchase the company outright at current stock prices (theoretically speaking).
But while a market cap provides insight into what equity is worth at a given time, calculating the market value is far more complicated and nuanced. After all, a price paid might not reflect the actual value of a business. To get a measure of value, other metrics like a company’s price-to-sales (P/S) ratio, price-to-earnings (P/E) ratio, or return-on-equity (ROE) may be considered.
The Largest Public Companies by Market Cap (2000–2022)
Over the last two decades, investor sentiment has shifted as different trends have played out, and the types of companies buoyed up by the market have changed as well.
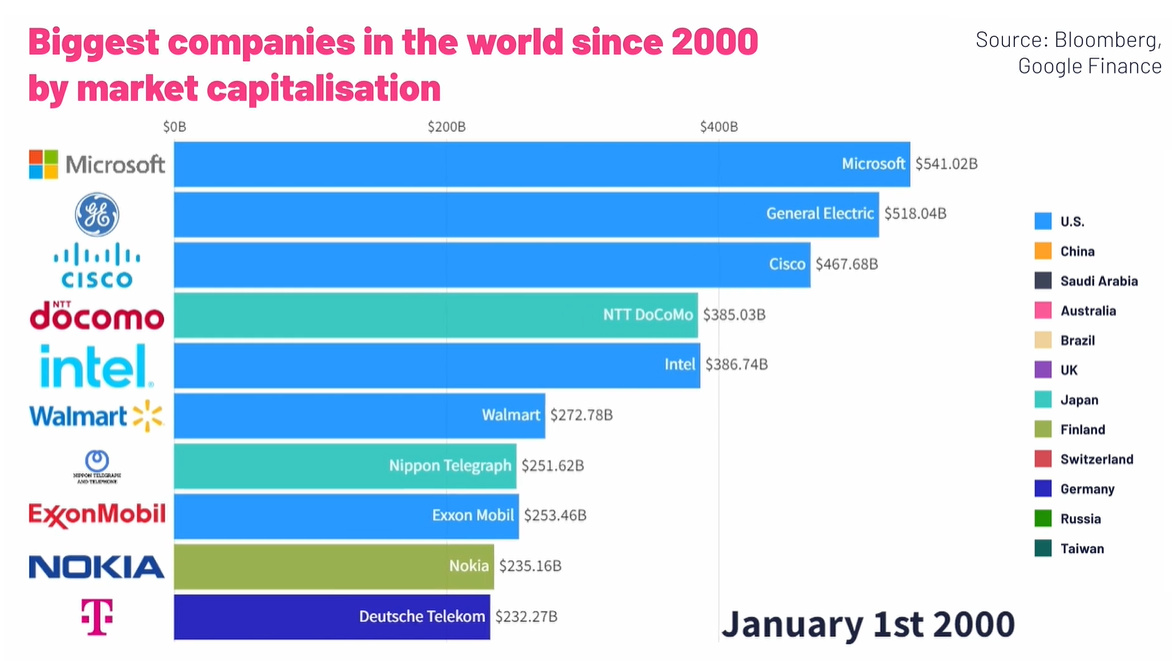
For instance, tech and telecom companies were big in the very early 2000s, as investors got excited about the seemingly endless potential of the newly-introduced World Wide Web.
Largest Companies by Market Cap (January 1, 2000)
| Rank | Company | Market Cap (Jan 1, 2000) |
|---|---|---|
| #1 | 🇺🇸 Microsoft | $606 billion |
| #2 | 🇺🇸 General Electric | $508 billion |
| #3 | 🇯🇵 NTT Docomo | $367 billion |
| #4 | 🇺🇸 Cisco | $352 billion |
| #5 | 🇺🇸 Walmart | $302 billion |
| #6 | 🇺🇸 Intel | $280 billion |
| #7 | 🇯🇵 Nippon Telegraph | $271 billion |
| #8 | 🇫🇮 Nokia | $219 billion |
| #9 | 🇺🇸 Pfizer | $206 billion |
| #10 | 🇩🇪 Deutsche Telekom | $197 billion |
In the middle of the Dotcom bubble, investors were pouring money into internet-related tech startups. As PC and internet adoption picked up, investors hoped to “get in early” before these companies started to really turn a profit. This overzealous sentiment is reflected in the market capitalizations of public companies at the time, especially in the tech or telecom companies that were seen as benefitting from the internet boom.
Of course, the Dotcom bubble was not meant to last, and by January 2004 the top 10 list was looking much more diverse. At this time, Microsoft had lost the top spot to General Electric, which had a market cap of $309 billion. Then in the late 2000s, energy companies such as ExxonMobil, PetroChina, Gazprom, and BP took over the list as oil prices spiked well over $100 per barrel.
But fast forward to 2022, and we’ve come full circle, with Big Tech back in the limelight again.
Largest Companies by Market Cap (July 1, 2022)
| Rank | Company | Market Cap (Jul 1, 2022) |
|---|---|---|
| #1 | 🇸🇦 Saudi Aramco | $2.27 trillion |
| #2 | 🇺🇸 Apple | $2.25 trillion |
| #3 | 🇺🇸 Microsoft | $1.94 trillion |
| #4 | 🇺🇸 Alphabet | $1.43 trillion |
| #5 | 🇺🇸 Amazon | $1.11 trillion |
| #6 | 🇺🇸 Tesla | $707 billion |
| #7 | 🇺🇸 Berkshire Hathaway | $612 billion |
| #8 | 🇺🇸 United Health Group | $485 billion |
| #9 | 🇺🇸 Johnson & Johnson | $472 billion |
| #10 | 🇨🇳 Tencent | $435 billion |
Four of the five largest companies are in tech, and Tencent also cracks the list. Meanwhile, Tesla is classified as an automotive company, but it is thought of as an “internet of cars” company by many investors.
Big Picture Trends in the Top 10 by Market Cap List
| Year | Description | Top Company (Market Cap USD) | Top 10 Description |
|---|---|---|---|
| 2000 | Dotcom Bubble | Microsoft ($606B) | Multiple tech/telecom companies in the mix |
| 2004 | Post-Bubble | GE ($309B) | Diverse mix of companies by industry |
| 2009 | Financial Crisis | PetroChina ($367B) | Six non-U.S. companies make the list |
| 2014 | $100 Oil | Apple ($560B) | Last year of oil-dominated list; tech starts ascending |
| 2022 | Big Tech Era | Aramco ($2,270B)* | Tech accounts for 80% of Top 5 companies |
*As of July 1, 2022. Since then, Saudi Aramco has been re-surpassed by Apple due to a reversal in oil prices.
Trending Downwards?
Amidst rising interest rates, crippling inflation, and political issues like the ongoing conflict in Ukraine, signs point towards a potential global recession. Tech companies fared well during the COVID-19 pandemic, but will likely not be immune to the impacts of a generalized economic slowdown.
It’ll be interesting to see how things pan out in 2023, and which companies (if any) will manage to stay on top throughout the turmoil.

This article was published as a part of Visual Capitalist's Creator Program, which features data-driven visuals from some of our favorite Creators around the world.


Markets
Visualizing Global Inflation Forecasts (2024-2026)
Here are IMF forecasts for global inflation rates up to 2026, highlighting a slow descent of price pressures amid resilient global growth.


Visualizing Global Inflation Forecasts (2024-2026)
Global inflation rates are gradually descending, but progress has been slow.
Today, the big question is if inflation will decline far enough to trigger easing monetary policy. So far, the Federal Reserve has held rates for nine months amid stronger than expected core inflation, which excludes volatile energy and food prices.
Yet looking further ahead, inflation forecasts from the International Monetary Fund (IMF) suggest that inflation will decline as price pressures ease, but the path of disinflation is not without its unknown risks.
This graphic shows global inflation forecasts, based on data from the April 2024 IMF World Economic Outlook.
Get the Key Insights of the IMF’s World Economic Outlook
Want a visual breakdown of the insights from the IMF’s 2024 World Economic Outlook report?
This visual is part of a special dispatch of the key takeaways exclusively for VC+ members.
Get the full dispatch of charts by signing up to VC+.
The IMF’s Inflation Outlook
Below, we show the IMF’s latest projections for global inflation rates through to 2026:
| Year | Global Inflation Rate (%) | Advanced Economies Inflation Rate (%) | Emerging Market and Developing Economies Inflation Rate (%) |
|---|---|---|---|
| 2019 | 3.5 | 1.4 | 5.1 |
| 2020 | 3.2 | 0.7 | 5.2 |
| 2021 | 4.7 | 3.1 | 5.9 |
| 2022 | 8.7 | 7.3 | 9.8 |
| 2023 | 6.8 | 4.6 | 8.3 |
| 2024 | 5.9 | 2.6 | 8.3 |
| 2025 | 4.5 | 2.0 | 6.2 |
| 2026 | 3.7 | 2.0 | 4.9 |
After hitting a peak of 8.7% in 2022, global inflation is projected to fall to 5.9% in 2024, reflecting promising inflation trends amid resilient global growth.
While inflation has largely declined due to falling energy and goods prices, persistently high services inflation poses challenges to mitigating price pressures. In addition, the IMF highlights the potential risk of an escalating conflict in the Middle East, which could lead to energy price shocks and higher shipping costs.
These developments could negatively affect inflation scenarios and prompt central banks to adopt tighter monetary policies. Overall, by 2026, global inflation is anticipated to decline to 3.7%—still notably above the 2% target set by several major economies.
Adding to this, we can see divergences in the path of inflation between advanced and emerging economies. While affluent nations are forecast to see inflation edge closer to the 2% target by 2026, emerging economies are projected to have inflation rates reach 4.9%—falling closer to their pre-pandemic averages.
Get the Full Analysis of the IMF’s Outlook on VC+
This visual is part of an exclusive special dispatch for VC+ members which breaks down the key takeaways from the IMF’s 2024 World Economic Outlook.
For the full set of charts and analysis, sign up for VC+.

-

 Best of6 days ago
Best Visualizations of April on the Voronoi App
-

 Brands2 weeks ago
How Tech Logos Have Evolved Over Time
-

 Energy2 weeks ago
Ranked: The Top 10 EV Battery Manufacturers in 2023
-

 Demographics2 weeks ago
Countries With the Largest Happiness Gains Since 2010
-

 VC+2 weeks ago
VC+: Get Our Key Takeaways From the IMF’s World Economic Outlook
-

 Demographics2 weeks ago
The Countries That Have Become Sadder Since 2010
-

 Money2 weeks ago
Charted: Who Has Savings in This Economy?
-

 Technology1 week ago
Visualizing AI Patents by Country