Environment
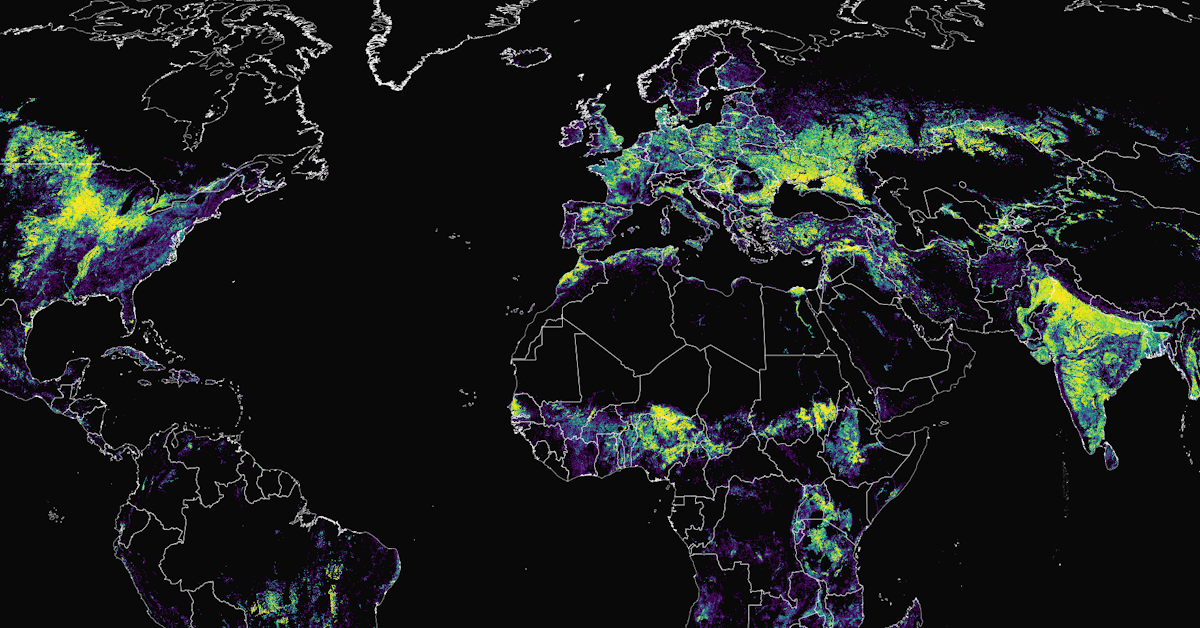
Mapped: How Much of the World is Covered by Croplands?
Article/Editing:
Click to view this graphic in a higher-resolution.
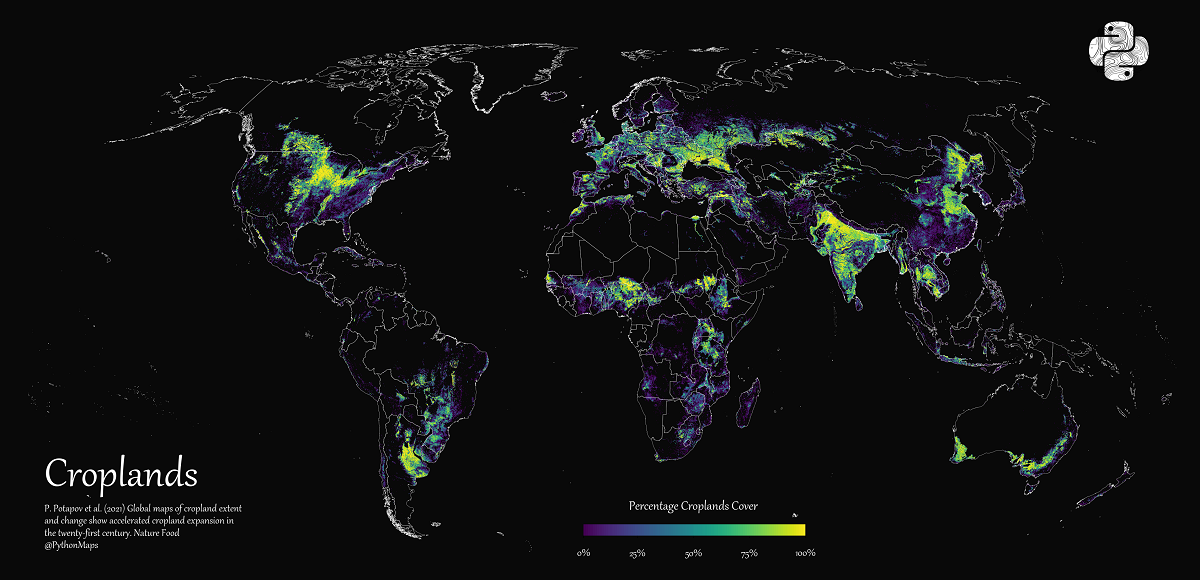
Mapping Cropland Cover Around the World
Over the last 50 years, the world’s human population worldwide has grown exponentially.
And this population explosion brought greater food production needs with it, through livestock breeding, cropland expansion, and other increases in land use.
But how evenly is this land distributed globally? In this graphic, Adam Symington maps global croplands as of 2019, based on a 2021 scientific paper published in Nature by Peter Potapov et al.
The World’s Croplands
Croplands are defined as land areas used to cultivate herbaceous crops for human consumption, forage, and biofuel. At the start of the 21st century, the world’s croplands spread across 1,142 million hectares (Mha) of land.
Some of these croplands have since been abandoned, lost in natural disasters, or repurposed for housing, irrigation, and other infrastructural needs.
Despite this, the creation of new croplands increased overall cropland cover by around 9% and the net primary (crop) production by 25%.
Africa and South America Lead Croplands Expansion
In 2019, croplands occupied 1,244 Mha of land worldwide, with the largest regions being Europe and North Asia and Southwest Asia at around 20% of total cover each.
Interestingly, even though Africa (17%) and South America (9%) held lower percentages of the world’s croplands, they saw the highest expansion in croplands since 2000:
| Region | Cropland Area (Mha, 2000–03) | Cropland Area (Mha, 2016–19) | Change (Mha) |
|---|---|---|---|
| Africa | 155.1 | 208.3 | +53.2 |
| South America | 75.5 | 112.6 | +37.1 |
| Southwest Asia | 237.3 | 244.8 | +7.5 |
| Australia and New Zealand | 37.3 | 40.3 | +3.0 |
| North and Central America | 192.1 | 193.9 | +1.8 |
| Europe and North Asia | 252.3 | 253.2 | +0.9 |
| Southeast Asia | 192.7 | 191.1 | -1.6 |
| World | 1,142.3 | 1,244.2 | +101.9 |
South American nations including Argentina, Brazil, and Uruguay witnessed a steep rise in crop production between 2000 and 2007. Agricultural growth in the region can be attributed to both modern agricultural technology adoption and the production of globally demanded crops like soybeans.
A similar expansion in croplands within Sub-Saharan African countries at the start of the 21st century continues to persist today, as producers ramp up crop production for both exports and to try and alleviate food scarcity.
Much of these the world’s croplands were once forests, drylands, plains, and lowlands. And this loss in green cover is clearly seen across Africa, South America, and parts of Asia.
However, some regions have also witnessed tree plantations, orchards, and aquaculture replacing former croplands. One such example is Vietnam’s Mekong Delta, and indeed Southeast Asia was the only region that saw an overall decline in cropland cover from 2000 to 2019.
Moving Towards Sustainable Agriculture
The expansion of croplands has also come at a cost, destroying large stretches of forest cover, and further contributing to wildlife fragmentation and greenhouse gas emissions.
However, hope for more sustainable development is not lost. Nations are finding ways to improve agricultural productivity in ways that free up land.
As global demand for food continues to increase, agricultural expansion and intensification seem imminent. But innovation, and a changing climate, may elevate alternative solutions in the future.

This article was published as a part of Visual Capitalist's Creator Program, which features data-driven visuals from some of our favorite Creators around the world.


Green
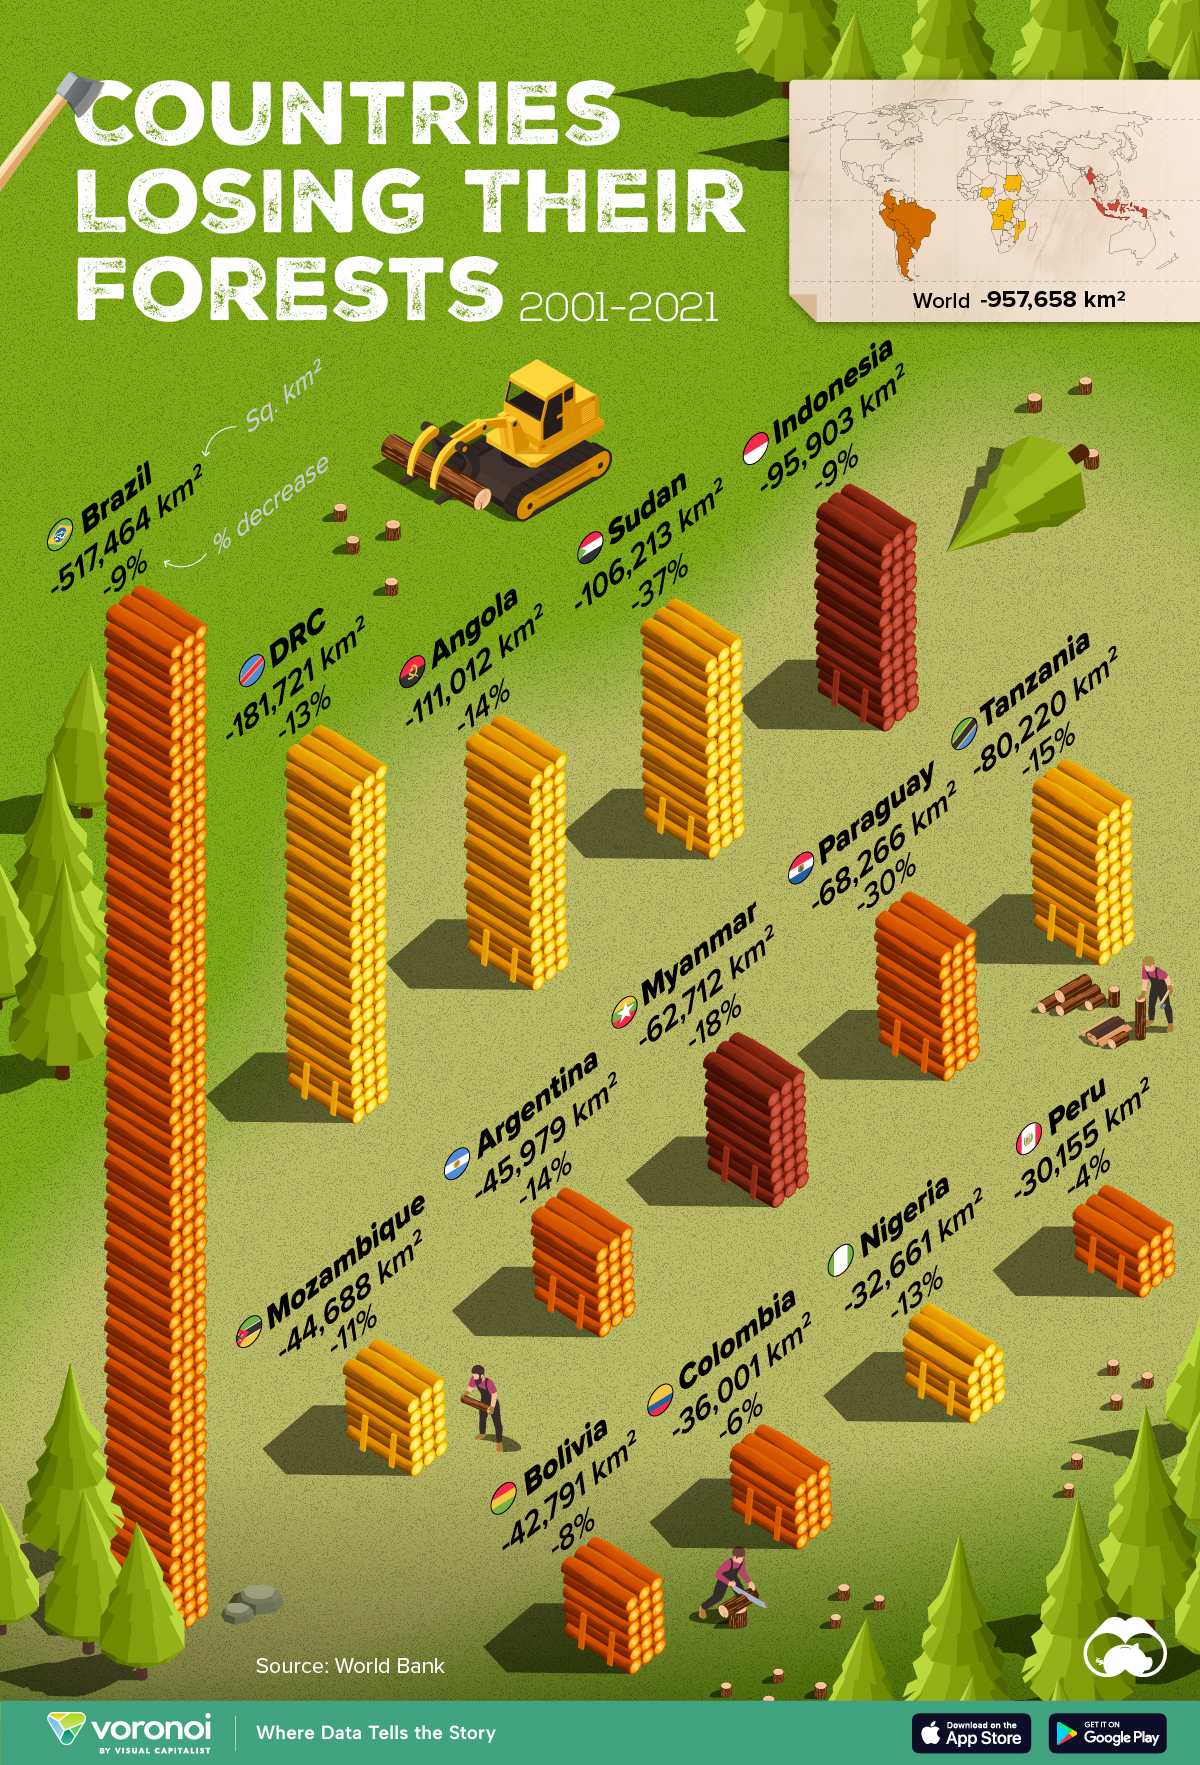
Ranked: Top Countries by Total Forest Loss Since 2001
The country with the most forest loss since 2001 lost as much forest cover as the next four countries combined.
Ranked: Top Countries By Total Forest Loss Since 2001
This was originally posted on our Voronoi app. Download the app for free on iOS or Android and discover incredible data-driven charts from a variety of trusted sources.
Forests are critical natural resources, often caught in the crosshairs of economic development. Thanks to expanding human settlement, agriculture, and industry, the world lost nearly 1 million square kilometers (km²) of forest cover since 2001.
But where has most of this deforestation occurred?
We rank the countries by the total decrease in their forest area between 2001 and 2021, measured in square kilometers along with their percentage decrease for context. All of this data was sourced from the World Bank.
A caveat to this data: countries are ranked by total forest loss, so countries with the largest forests feature predominantly on this list.
Which Country Has Lost the Most Forests (2001-2021)?
Brazil has lost more than half a million square kilometers of forest in the last two decades. Agricultural expansion for beef and soy production alongside mining and infrastructure growth are the primary drivers behind this large scale deforestation.
This has also caused periodic fires in the Amazon rainforest, drawing repeated alarm from around the world. In fact, Brazil has lost as much forest cover as the next four countries combined.
The table below lists the countries included in this graphic, as well as several others further down the ranking.
| Rank | Country | Region | 2001–21 Change (in km2) | % of Forest Loss |
|---|---|---|---|---|
| 1 | 🇧🇷 Brazil | South America | -517,464 | -9% |
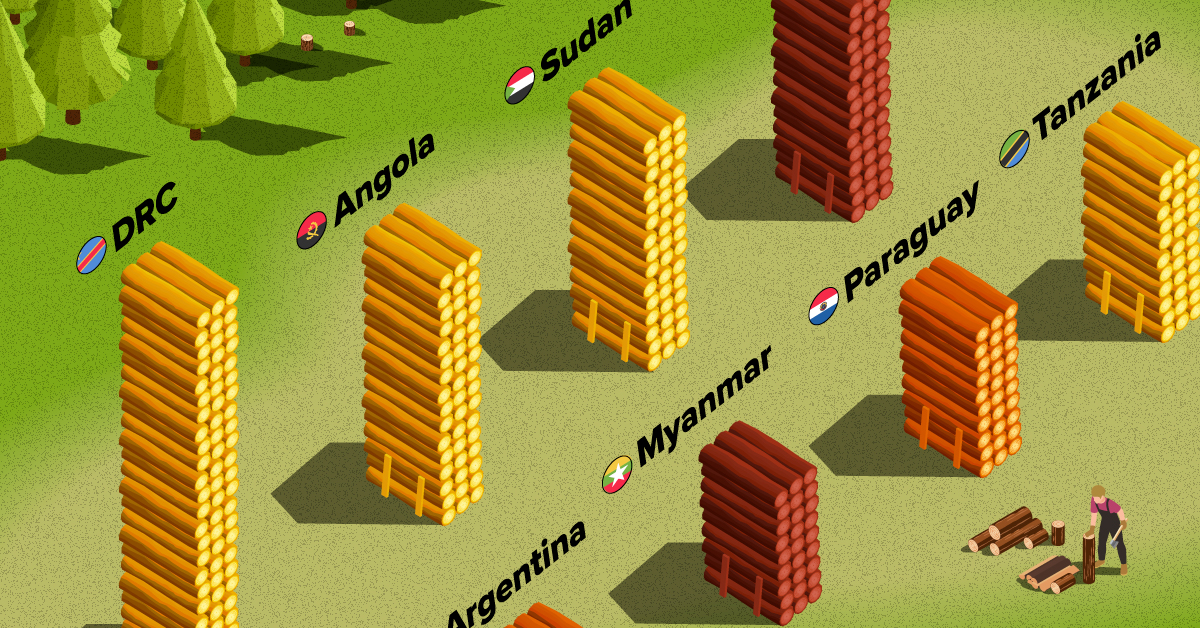
| 2 | 🇨🇩 DRC | Africa | -181,721 | -13% |
| 3 | 🇦🇴 Angola | Africa | -111,012 | -14% |
| 4 | 🇸🇩 Sudan | Africa | -106,213 | -37% |
| 5 | 🇮🇩 Indonesia | Asia | -95,903 | -9% |
| 6 | 🇹🇿 Tanzania | Africa | -80,220 | -15% |
| 7 | 🇵🇾 Paraguay | South America | -68,266 | -30% |
| 8 | 🇲🇲 Myanmar | Asia | -62,712 | -18% |
| 9 | 🇦🇷 Argentina | South America | -45,979 | -14% |
| 10 | 🇲🇿 Mozambique | Africa | -44,688 | -11% |
| 11 | 🇧🇴 Bolivia | South America | -42,791 | -8% |
| 12 | 🇨🇴 Colombia | South America | -36,001 | -6% |
| 13 | 🇳🇬 Nigeria | Africa | -32,661 | -13% |
| 14 | 🇵🇪 Peru | South America | -30,155 | -4% |
| 15 | 🇰🇭 Cambodia | Asia | -28,491 | -26% |
| 16 | 🇻🇪 Venezuela | South America | -28,130 | -6% |
| 17 | 🇲🇽 Mexico | North America | -26,732 | -4% |
| 18 | 🇿🇲 Zambia | Africa | -23,924 | -5% |
| 19 | 🇧🇼 Botswana | Africa | -23,660 | -14% |
| 20 | 🇨🇮 Cote d'Ivoire | Africa | -22,577 | -45% |
What is quickly apparent is how most of the countries on this list are from Africa and South America. A study found a correlation where developing economies tend to have higher deforestation rates than advanced economies. Former colonies have also experienced more forest loss than those that were not colonized.
In Asia, Indonesia’s burgeoning palm oil industry is a key driver to deforestation, though efforts are now being made to reverse its impact. Meanwhile, Cambodia experienced rapid clear-cutting for its growing rubber plantations and timber industry.
Finally, Myanmar has long contended with illegal logging, but the country’s ongoing civil war is styming conversation efforts.

-

 Science1 week ago
Visualizing the Average Lifespans of Mammals
-

 Demographics2 weeks ago
The Smallest Gender Wage Gaps in OECD Countries
-

 United States2 weeks ago
Where U.S. Inflation Hit the Hardest in March 2024
-

 Green2 weeks ago
Top Countries By Forest Growth Since 2001
-

 United States2 weeks ago
Ranked: The Largest U.S. Corporations by Number of Employees
-

 Maps2 weeks ago
The Largest Earthquakes in the New York Area (1970-2024)
-

 Green2 weeks ago
Ranked: The Countries With the Most Air Pollution in 2023
-

 Green2 weeks ago
Ranking the Top 15 Countries by Carbon Tax Revenue