Agriculture
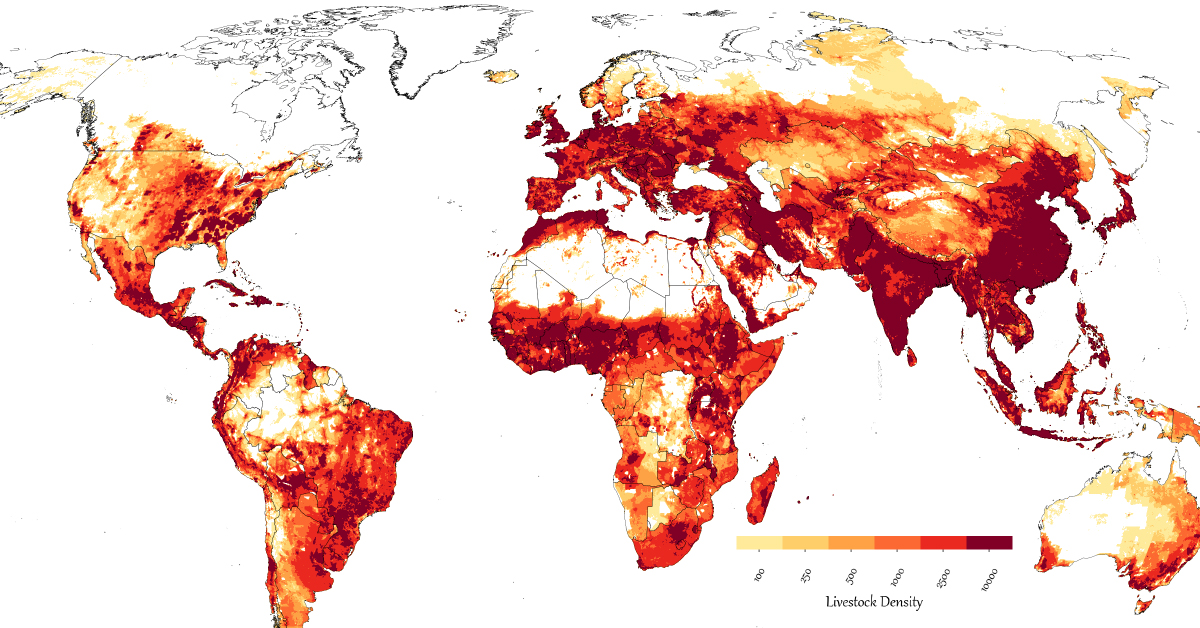
Mapped: Global Livestock Distribution and Density
Article/Editing:
Click to view this graphic in a higher-resolution.
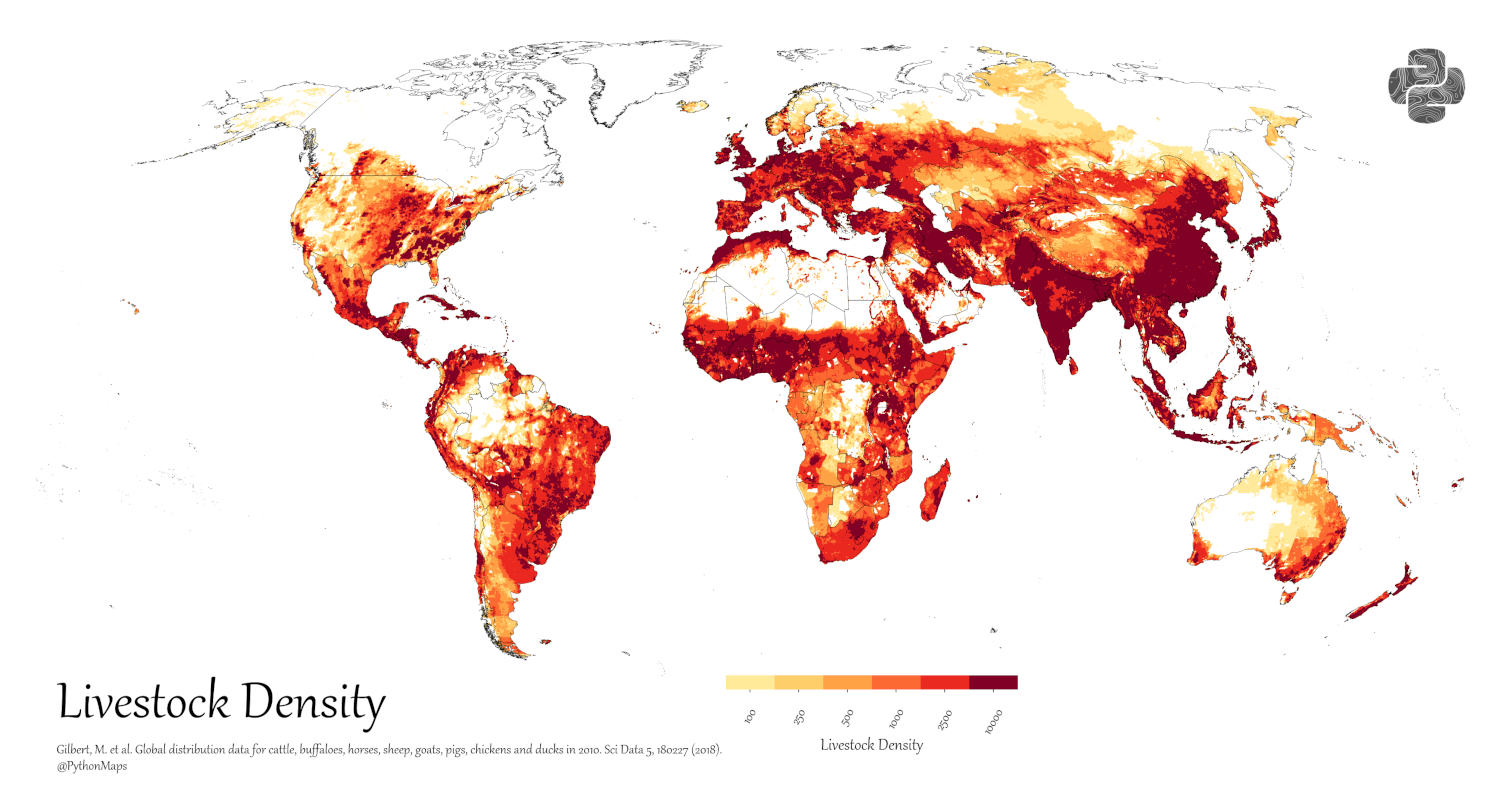
Mapped: Global Livestock Distribution and Density
Combined together, meat, dairy, and eggs make up nearly 18% of the average person’s diet.
But in order for these meat and animal products to reach consumers, a vast global livestock industry—one supporting the livelihoods of 1.3 billion people globally—operates in fields and farms largely unseen from major cities.
So where are the various types of livestock concentrated in the world? And how do national consumption habits influence animal husbandry?
These maps from Adam Symington help to answer these questions, using the Gridded Livestock of the World database from the UN Food and Agriculture Organization (FAO), which models livestock densities from 2010 around the world.
Chicken, Beef, and Pork Livestock Density
As a starting point, it’s worth noting that the above map of all livestock might seem reminiscent to a human population density map.
Though there is definite correlation, especially when it comes to natural obstacles for both humans and livestock like deserts, forests, and mountain ranges, the concentration of livestock spreads far further than the densest human cities.
We dive into each category of livestock below.
Chicken Livestock Density
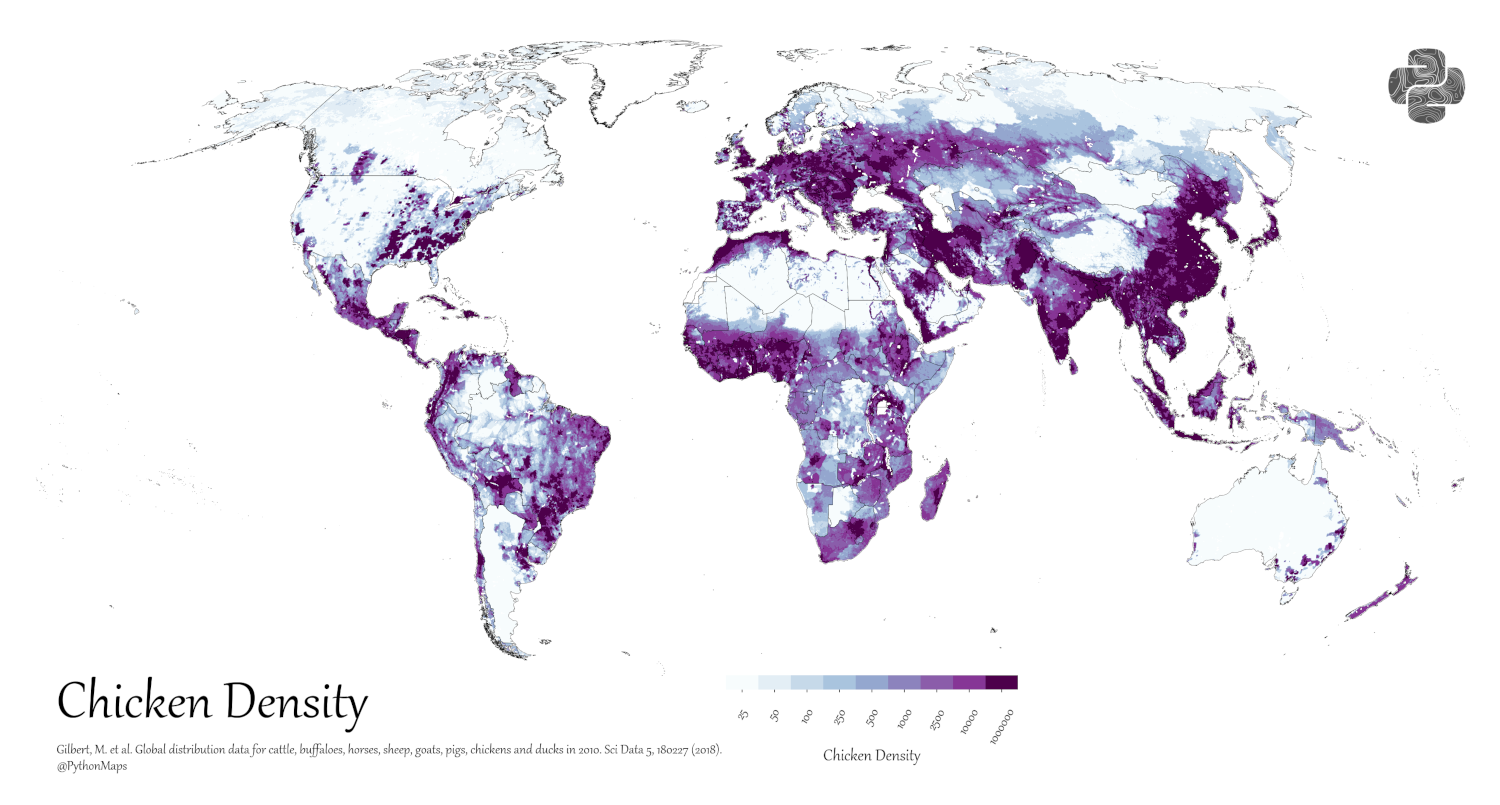
The UN FAO estimates that the world produced more than 121 million tonnes of chicken meat in 2021, making it the world’s most harvested meat. Chicken eggs are also estimated to account for 93% of the world’s 86 million tonnes of poultry eggs.
These numbers and the map below help illustrate the sheer number of chickens needed to support the world’s appetite for chicken goods.
Click to view this graphic in a higher-resolution.
Just by glancing at the heatmap map of chicken distribution, two things stand out clearly. First is how ubiquitous chickens are, with a high density of chicken livestock in almost all of the world’s populated regions.
But the map also gives us insight into where most farms are located. In the U.S. for example, Southern states including Georgia, North Carolina, Alabama, Mississippi, and Arkansas are major chicken producers. Likewise in countries like Brazil and China, the chicken industry can be seen continuing inland far beyond the more populated coastal regions.
Pig Livestock Density
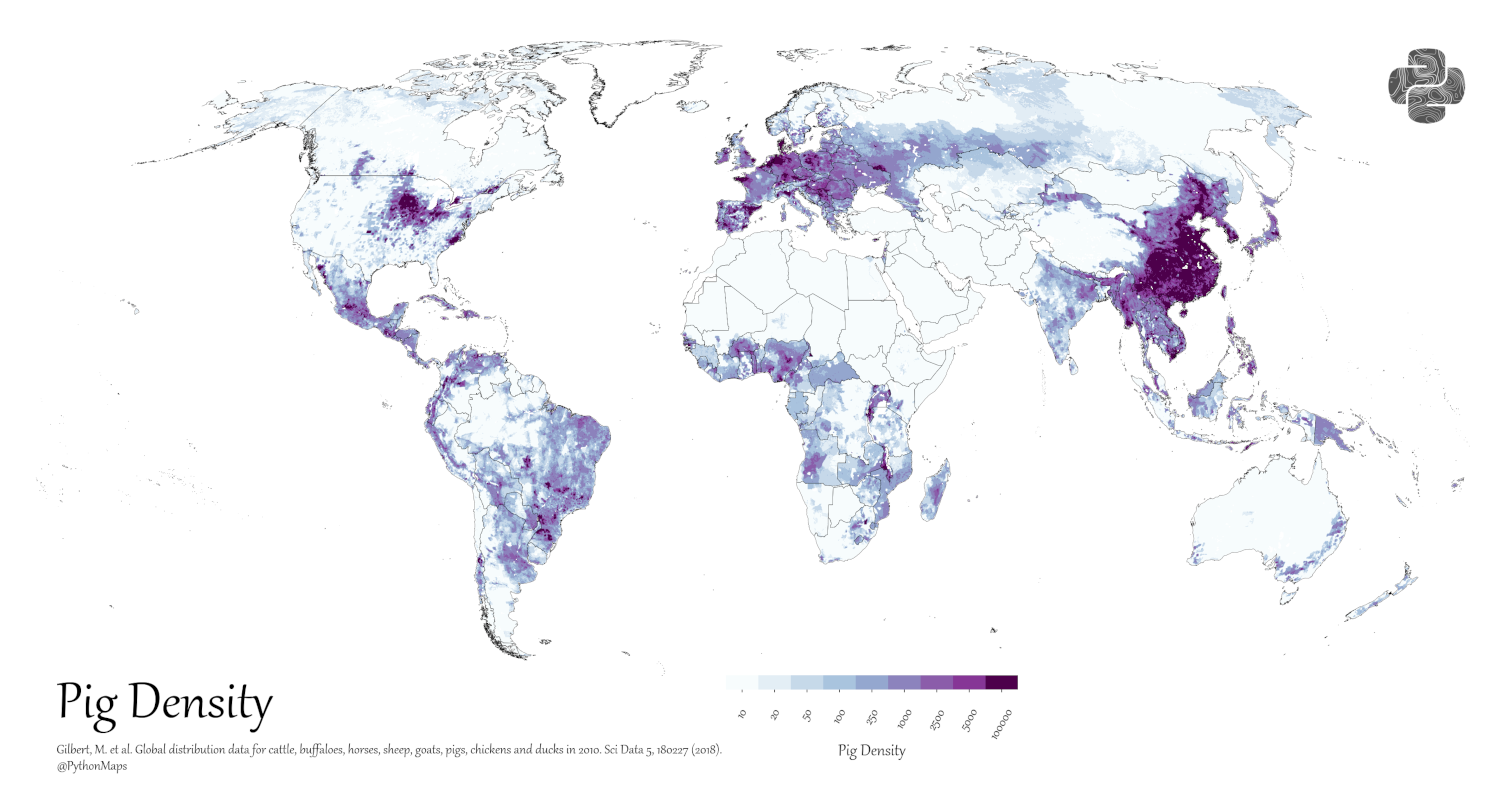
Shifting attention to pig livestock, we see densities begin to concentrate in a few specific regions.
Click to view this graphic in a higher-resolution.
China stands out on the map with large concentrations of pig livestock, which comes as no surprise given the country is far and away the world’s top producer of pork.
Also clear is the regionality of pork consumption. The U.S. has a strong concentration of pig livestock in the Midwest, while Central Europe has multiple countries with a noted history of pork consumption including Germany and Poland. Finally, partially thanks to its premium production of jamón ibérico, the country of Spain also stands out.
On the flip side, there is a clear absence of pig-rearing in countries of Islamic faith, across North Africa, the Middle East, and Central Asia, reflecting their religious prohibition.
Cattle Livestock Density
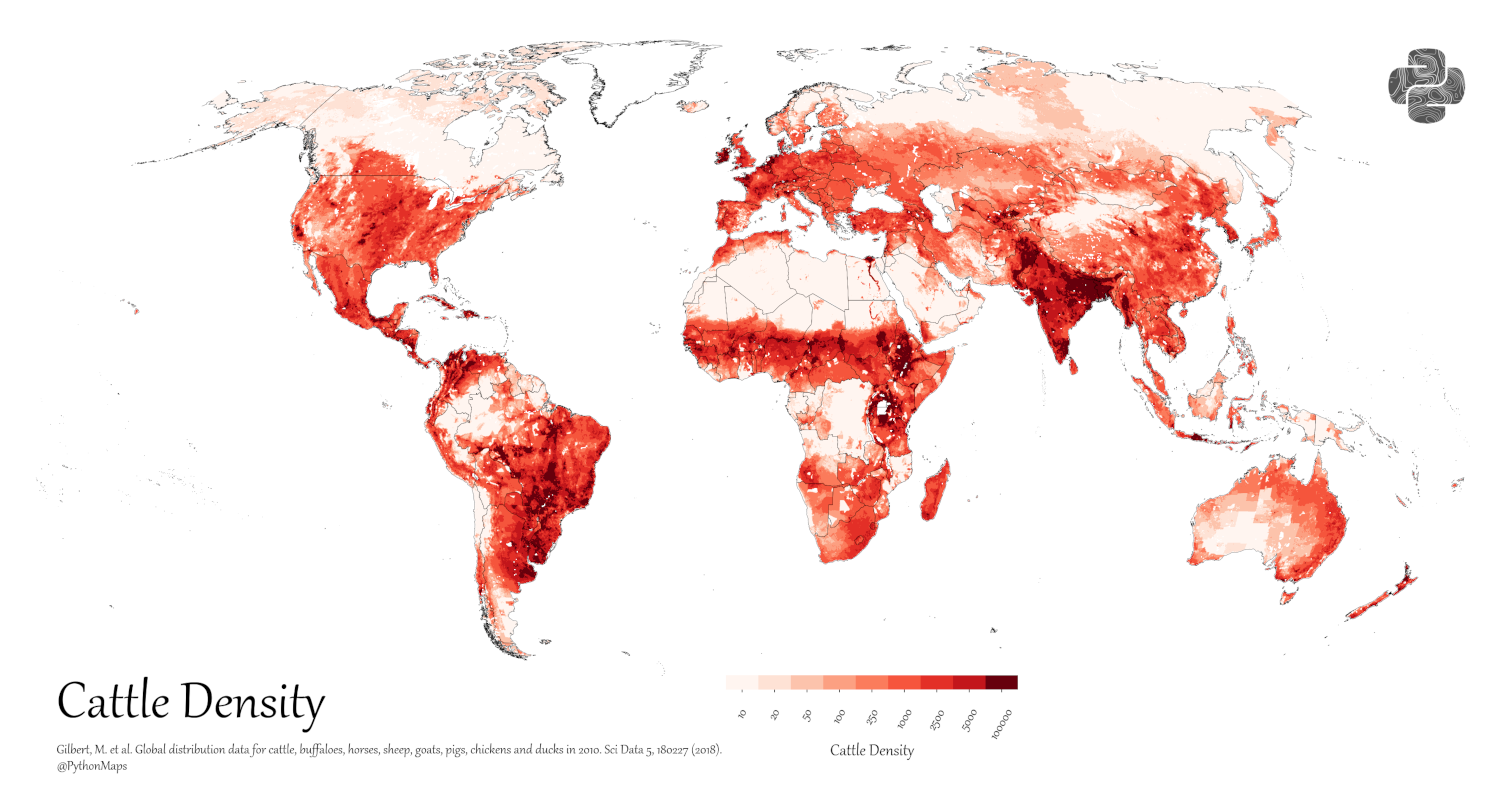
In contrast, the map of cattle distribution more closely mirrors chicken distribution, though its footprint is considerably wider.
Click to view this graphic in a higher-resolution.
Major cow byproducts like milk and leather, as well as the sheer strength of cattle, make them vital livestock even for countries that don’t consume a lot of beef. The FAO estimates that the world produced 746 million tonnes of raw cattle milk in 2021 alone.
On the map, the largest producers of cattle stand out. India for example is the top producer of milk and the fourth-largest producer of cattle meat, and has a high density of cattle throughout populated and agricultural regions. Brazil, also a top four producer of cattle meat and milk, has pockets of high density cattle regions inland, notably encroaching into the Amazon rainforest.
Meanwhile, the U.S. is the world’s largest producer of beef and second largest of milk, but it does this with a more distributed cattle population throughout the country’s landmass, and fewer high-density hot spots.
Chicken, Pork, and Beef Production by Country
Here’s a breakdown of chicken, pork, and beef production by country in 2021:
| Country | Chicken (Tons) | Pig (Tons) | Cattle (Tons) |
|---|---|---|---|
| 🇦🇫 Afghanistan | 28,029 | N/A | 115,282 |
| 🇦🇱 Albania | 13,250 | 9,370 | 31,712 |
| 🇩🇿 Algeria | 257,645 | 104 | 146,270 |
| 🇦🇴 Angola | 39,951 | 136,388 | 108,790 |
| 🇦🇬 Antigua & Barbuda | 34 | 50 | 57 |
| 🇦🇷 Argentina | 2,294,101 | 695,939 | 2,981,690 |
| 🇦🇲 Armenia | 8,268 | 18,883 | 57,448 |
| 🇦🇺 Australia | 1,292,240 | 432,246 | 1,932,598 |
| 🇦🇹 Austria | 129,390 | 502,120 | 213,740 |
| 🇦🇿 Azerbaijan | 124,388 | 497 | 145,040 |
| 🇧🇸 Bahamas | 6,204 | 376 | 19 |
| 🇧🇭 Bahrain | 8,262 | N/A | 816 |
| 🇧🇩 Bangladesh | 216,198 | N/A | 198,544 |
| 🇧🇧 Barbados | 13,183 | 2,634 | 161 |
| 🇧🇾 Belarus | 503,200 | 395,800 | 348,500 |
| 🇧🇪 Belgium | 447,710 | 1,140,090 | 247,120 |
| 🇧🇿 Belize | 19,187 | 1,899 | 1,536 |
| 🇧🇯 Benin | 16,005 | 8,850 | 34,158 |
| 🇧🇹 Bhutan | 1,866 | 700 | 1,016 |
| 🇧🇴 Bolivia | 506,148 | 115,095 | 284,195 |
| 🇧🇦 Bosnia & Herzegovina | 63,703 | 8,364 | 12,355 |
| 🇧🇼 Botswana | 4,019 | 225 | 34,000 |
| 🇧🇷 Brazil | 14,636,478 | 4,365,000 | 9,750,000 |
| 🇧🇳 Brunei Darussalam | 31,353 | 31 | 3,465 |
| 🇧🇬 Bulgaria | 90,680 | 80,650 | 18,180 |
| 🇧🇫 Burkina Faso | 204,218 | 337,410 | 110,204 |
| 🇧🇮 Burundi | 8,267 | 10,678 | 14,192 |
| 🇨🇻 Cabo Verde | 706 | 2,413 | 686 |
| 🇰🇭 Cambodia | 17,400 | 107,364 | 52,168 |
| 🇨🇲 Cameroon | 85,261 | 29,349 | 84,880 |
| 🇨🇦 Canada | 1,332,968 | 2,404,595 | 1,385,544 |
| 🇨🇫 Central African Republic | 6,599 | 19,079 | 102,626 |
| 🇹🇩 Chad | 6,596 | 2,558 | 491,711 |
| 🇨🇱 Chile | 680,290 | 589,585 | 209,972 |
| 🇨🇳 China | 14,700,000 | 52,959,300 | 6,975,100 |
| 🇨🇴 Colombia | 1,694,335 | 460,707 | 758,737 |
| 🇰🇲 Comoros | 570 | N/A | 1,227 |
| 🇨🇬 Congo | 6,812 | 1,557 | 5,669 |
| 🇨🇰 Cook Islands | 15 | 409 | 3 |
| 🇨🇷 Costa Rica | 147,816 | 66,065 | 92,794 |
| 🇨🇮 Côte d'Ivoire | 70,084 | 11,589 | 37,587 |
| 🇭🇷 Croatia | 58,610 | 122,500 | 43,180 |
| 🇨🇺 Cuba | 24,000 | 124,252 | 62,032 |
| 🇨🇾 Cyprus | 26,640 | 43,710 | 5,910 |
| 🇨🇿 Czechia | 167,980 | 225,880 | 74,520 |
| 🇩🇰 Denmark | 163,100 | 1,723,730 | 123,430 |
| 🇩🇯 Djibouti | N/A | N/A | 6,154 |
| 🇩🇲 Dominica | 368 | 425 | 564 |
| 🇩🇴 Dominican Republic | 346,883 | 76,228 | 62,317 |
| 🇨🇩 DRC | 10,532 | 30,073 | 21,116 |
| 🇪🇨 Ecuador | 437,094 | 224,040 | 229,014 |
| 🇪🇬 Egypt | 2,232,206 | 752 | 352,383 |
| 🇸🇻 El Salvador | 133,628 | 6,255 | 16,713 |
| 🇬🇶 Equatorial Guinea | 261 | 178 | 48 |
| 🇪🇷 Eritrea | 1,083 | N/A | 24,333 |
| 🇪🇪 Estonia | 23,300 | 44,150 | 9,950 |
| 🇸🇿 Eswatini | 5,783 | 1,420 | 16,815 |
| 🇪🇹 Ethiopia | 70,081 | 2,268 | 440,736 |
| 🇫🇴 Faroe Islands | N/A | N/A | 93 |
| 🇫🇯 Fiji | 25,715 | 4,094 | 3,989 |
| 🇫🇮 Finland | 138,600 | 176,080 | 86,250 |
| 🇫🇷 France | 1,143,000 | 2,203,830 | 1,424,320 |
| 🇵🇫 French Polynesia | 595 | 848 | 205 |
| 🇬🇦 Gabon | 4,119 | 3,580 | 1,105 |
| 🇬🇲 Gambia | 1,630 | 505 | 4,321 |
| 🇬🇪 Georgia | 25,000 | 21,800 | 20,500 |
| 🇩🇪 Germany | 1,080,000 | 4,971,150 | 1,080,420 |
| 🇬🇭 Ghana | 74,124 | 29,448 | 26,344 |
| 🇬🇷 Greece | 235,500 | 74,820 | 33,050 |
| 🇬🇩 Grenada | 539 | 237 | 137 |
| 🇬🇹 Guatemala | 361,187 | 38,185 | 215,337 |
| 🇬🇳 Guinea | 13,572 | 7,606 | 103,056 |
| 🇬🇼 Guinea-Bissau | 3,059 | 14,106 | 7,474 |
| 🇬🇾 Guyana | 48,945 | 839 | 2,071 |
| 🇭🇹 Haiti | 8,750 | 32,388 | 49,028 |
| 🇭🇳 Honduras | 228,241 | 9,731 | 66,000 |
| 🇭🇰 Hong Kong | 32,967 | 117,808 | 6,659 |
| 🇭🇺 Hungary | 367,610 | 473,800 | 30,080 |
| 🇮🇸 Iceland | 8,997 | 6,580 | 4,965 |
| 🇮🇳 India | 3,670,156 | 320,228 | 4,195,000 |
| 🇮🇩 Indonesia | 3,844,346 | 323,670 | 437,783 |
| 🇮🇷 Iran | 1,983,328 | N/A | 336,332 |
| 🇮🇶 Iraq | 122,411 | N/A | 34,783 |
| 🇮🇪 Ireland | 147,770 | 335,130 | 594,510 |
| 🇮🇱 Israel | 541,292 | 13,400 | 139,716 |
| 🇮🇹 Italy | 1,068,500 | 1,351,980 | 747,890 |
| 🇯🇲 Jamaica | 125,192 | 7,199 | 6,545 |
| 🇯🇵 Japan | 2,435,965 | 1,318,125 | 477,979 |
| 🇯🇴 Jordan | 205,000 | N/A | 48,581 |
| 🇰🇿 Kazakhstan | 263,561 | 83,745 | 540,216 |
| 🇰🇪 Kenya | 89,450 | 23,107 | 250,607 |
| 🇰🇮 Kiribati | 983 | 1,046 | N/A |
| 🇰🇼 Kuwait | 64,604 | N/A | 2,265 |
| 🇰🇬 Kyrgyzstan | 11,057 | 10,679 | 111,226 |
| 🇱🇦 Laos | 38,318 | 101,560 | 39,463 |
| 🇱🇻 Latvia | 35,080 | 37,850 | 17,040 |
| 🇱🇧 Lebanon | 113,997 | 695 | 45,513 |
| 🇱🇸 Lesotho | 932 | 526 | 1,402 |
| 🇱🇷 Liberia | 14,725 | 11,307 | 1,236 |
| 🇱🇾 Libya | 127,566 | N/A | 5,857 |
| 🇱🇹 Lithuania | 85,030 | 79,210 | 45,540 |
| 🇱🇺 Luxembourg | N/A | 12,550 | 10,590 |
| 🇲🇴 Macao | 3,278 | 5,000 | 755 |
| 🇲🇬 Madagascar | 52,861 | 19,226 | 34,386 |
| 🇲🇼 Malawi | 107,501 | 279,891 | 60,894 |
| 🇲🇾 Malaysia | 1,558,809 | 219,179 | 34,810 |
| 🇲🇱 Mali | 60,450 | 683 | 55,738 |
| 🇲🇹 Malta | 4,070 | 4,720 | 1,050 |
| 🇲🇷 Mauritania | 4,309 | N/A | 31,255 |
| 🇲🇺 Mauritius | 49,100 | 640 | 1,711 |
| 🇲🇽 Mexico | 3,668,552 | 1,693,007 | 2,130,592 |
| 🇫🇲 Micronesia | 161 | 1,085 | 261 |
| 🇲🇩 Moldova | 50,106 | 51,836 | 7,711 |
| 🇲🇳 Mongolia | 246 | 253 | 114,485 |
| 🇲🇪 Montenegro | 3,601 | 4,204 | 3,718 |
| 🇲🇦 Morocco | 525,000 | 629 | 282,000 |
| 🇲🇿 Mozambique | 135,708 | 127,089 | 17,781 |
| 🇲🇲 Myanmar | 620,000 | 285,000 | 110,000 |
| 🇳🇦 Namibia | 10,466 | 7,089 | 32,936 |
| 🇳🇷 Nauru | 4 | 76 | N/A |
| 🇳🇵 Nepal | 226,959 | 31,450 | N/A |
| 🇳🇱 Netherlands | 869,380 | 1,719,420 | 429,640 |
| 🇳🇨 New Caledonia | 1,018 | 2,892 | 3,076 |
| 🇳🇿 New Zealand | 226,259 | 44,917 | 750,549 |
| 🇳🇮 Nicaragua | 143,284 | 14,366 | 167,369 |
| 🇳🇪 Niger | 20,268 | 1,540 | 69,645 |
| 🇳🇬 Nigeria | 241,188 | 309,582 | 334,333 |
| 🇳🇺 Niue | 25 | 67 | 2 |
| 🇰🇵 North Korea | 32,834 | 107,647 | 20,906 |
| 🇲🇰 North Macedonia | 1,695 | 15,578 | 4,214 |
| 🇳🇴 Norway | 106,043 | 134,172 | 87,736 |
| 🇴🇲 Oman | 6,764 | N/A | 15,640 |
| 🇵🇰 Pakistan | 1,809,000 | N/A | 1,223,000 |
| 🇵🇸 Palestine | 37,291 | N/A | 18,279 |
| 🇵🇦 Panama | 229,833 | 46,620 | 76,422 |
| 🇵🇬 Papua New Guinea | 6,725 | 82,783 | 3,153 |
| 🇵🇾 Paraguay | 75,054 | 69,442 | 522,776 |
| 🇵🇪 Peru | 1,751,608 | 176,150 | 189,923 |
| 🇵🇭 Philippines | 1,343,496 | 1,187,305 | 118,053 |
| 🇵🇱 Poland | 2,096,770 | 1,985,810 | 555,220 |
| 🇵🇹 Portugal | 300,040 | 380,290 | 103,000 |
| 🇵🇷 Puerto Rico | 30,146 | 6,558 | 5,396 |
| 🇶🇦 Qatar | 35,344 | N/A | 1,854 |
| 🇷🇴 Romania | 451,850 | 391,390 | 82,720 |
| 🇷🇺 Russia | 4,617,338 | 4,304,053 | 1,673,546 |
| 🇷🇼 Rwanda | 19,867 | 12,379 | 36,488 |
| 🇰🇳 Saint Kitts & Nevis | 28 | 50 | 52 |
| 🇱🇨 Saint Lucia | 1,320 | 846 | 415 |
| 🇻🇨 Saint Vincent & the Grenadines | 451 | 388 | 177 |
| 🇼🇸 Samoa | 402 | 1,909 | 981 |
| 🇸🇹 Sao Tome and Principe | 745 | 492 | 198 |
| 🇸🇦 Saudi Arabia | 910,000 | N/A | 40,000 |
| 🇸🇳 Senegal | 133,325 | 18,732 | 88,902 |
| 🇷🇸 Serbia | 110,528 | 312,167 | 69,785 |
| 🇸🇨 Seychelles | 430 | 397 | 11 |
| 🇸🇱 Sierra Leone | 20,581 | 1,316 | 11,278 |
| 🇸🇬 Singapore | 80,840 | 31,251 | 34 |
| 🇸🇰 Slovakia | N/A | 69,910 | 11,930 |
| 🇸🇮 Slovenia | 66,600 | 30,030 | 37,540 |
| 🇸🇧 Solomon Islands | 283 | 2,607 | 769 |
| 🇸🇴 Somalia | 3,909 | 96 | 43,661 |
| 🇿🇦 South Africa | 1,915,000 | 320,450 | 1,050,540 |
| 🇰🇷 South Korea | 935,000 | 1,407,000 | 310,000 |
| 🇸🇸 South Sudan | 20,374 | N/A | 131,417 |
| 🇪🇸 Spain | 1,331,410 | 5,180,060 | 717,880 |
| 🇱🇰 Sri Lanka | 230,616 | 2,371 | 19,500 |
| 🇸🇩 Sudan | 79,791 | N/A | 388,701 |
| 🇸🇷 Suriname | 12,332 | 2,125 | 1,821 |
| 🇸🇪 Sweden | 179,690 | 253,810 | 137,370 |
| 🇨🇭 Switzerland | 107,196 | 229,721 | 144,056 |
| 🇸🇾 Syria | 112,425 | N/A | 63,044 |
| 🇹🇼 Taiwan | 684,423 | 824,963 | 7,430 |
| 🇹🇯 Tajikistan | 30,900 | 4 | 214,273 |
| 🇹🇿 Tanzania | 86,206 | 41,468 | 508,355 |
| 🇹🇭 Thailand | 1,784,304 | 927,717 | 139,095 |
| 🇹🇱 Timor-Leste | 530 | 6,839 | 1,217 |
| 🇹🇬 Togo | 24,666 | 13,680 | 5,551 |
| 🇹🇰 Tokelau | 5 | 59 | N/A |
| 🇹🇴 Tonga | 280 | 1,802 | 353 |
| 🇹🇹 Trinidad & Tobago | 47,494 | 1,972 | 1,200 |
| 🇹🇳 Tunisia | 150,300 | 126 | 53,500 |
| 🇹🇷 Türkiye | 2,245,770 | N/A | 1,460,719 |
| 🇹🇲 Turkmenistan | 17,794 | 130 | 183,318 |
| 🇹🇻 Tuvalu | 64 | 127 | N/A |
| 🇺🇸 U.S. | 20,652,971 | 12,559,966 | 12,733,643 |
| 🇦🇪 UAE | 56,000 | N/A | 19,208 |
| 🇺🇬 Uganda | 68,385 | 127,602 | 193,661 |
| 🇬🇧 UK | 1,843,000 | 1,022,000 | 888,000 |
| 🇺🇦 Ukraine | 1,313,700 | 724,000 | 310,500 |
| 🇺🇾 Uruguay | 77,177 | 13,488 | 572,522 |
| 🇺🇿 Uzbekistan | 123,600 | 3,025 | 1,003,247 |
| 🇻🇺 Vanuatu | 676 | 3,390 | 2,133 |
| 🇻🇪 Venezuela | 439,847 | 110,253 | 371,426 |
| 🇻🇳 Viet Nam | 1,520,263 | 2,590,000 | 256,300 |
| 🇾🇪 Yemen | 205,941 | N/A | 96,354 |
| 🇿🇲 Zambia | 51,700 | 35,724 | 200,214 |
| 🇿🇼 Zimbabwe | 113,000 | 10,778 | 806,294 |
| 🇺🇳 World | 121,504,932 | 120,372,127 | 72,330,797 |
Mapping Duck, Sheep, and Goat Livestock
Although chicken, beef, and pork are the most common types of livestock globally, there are other kinds of animals that have much more regional distributions.
In the following maps, you’ll see livestock concentrated in just a few places, usually following unique cultural connections to these animals.
Duck Livestock Density
Compared to chicken above, ducks are much less widespread in farming and usage.
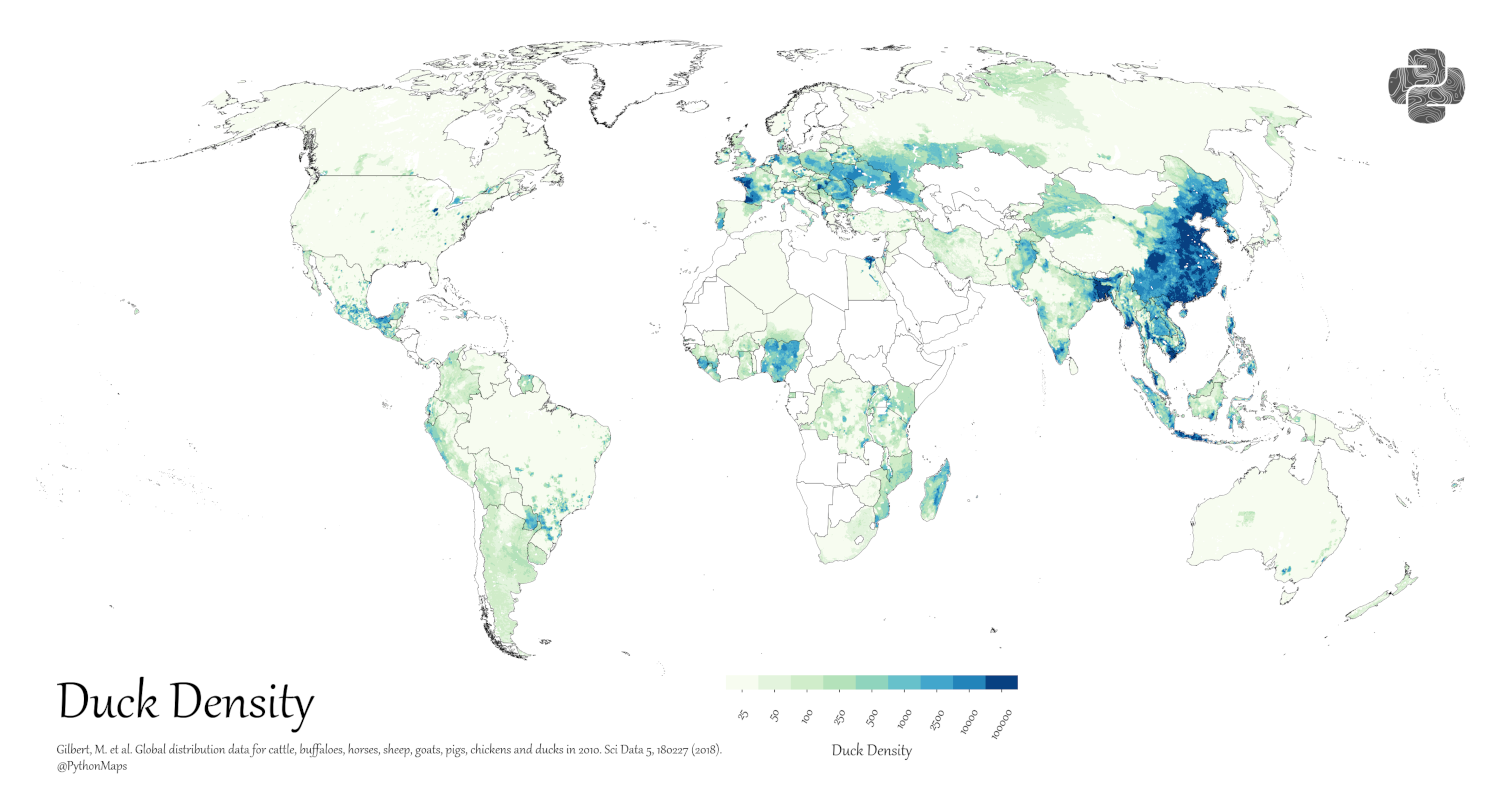
Click to view this graphic in a higher-resolution.
China is the runaway king when it comes to both duck livestock and meat production. The country accounted for 78% of global duck meat production in 2021—but distant runners up Vietnam and France also show strong concentrations of duck.
Perhaps surprising to some is the strong foothold duck has in Bangladesh. Farmers in the country have embraced duck over the past decades as both a more profitable bird, and more recently, as an adaptation to climate change.
Sheep Livestock Density
Moving to sheep, which provide meat, milk, and wool, we once again have a widespread global population. However, the regions with the highest densities have wildly changed.
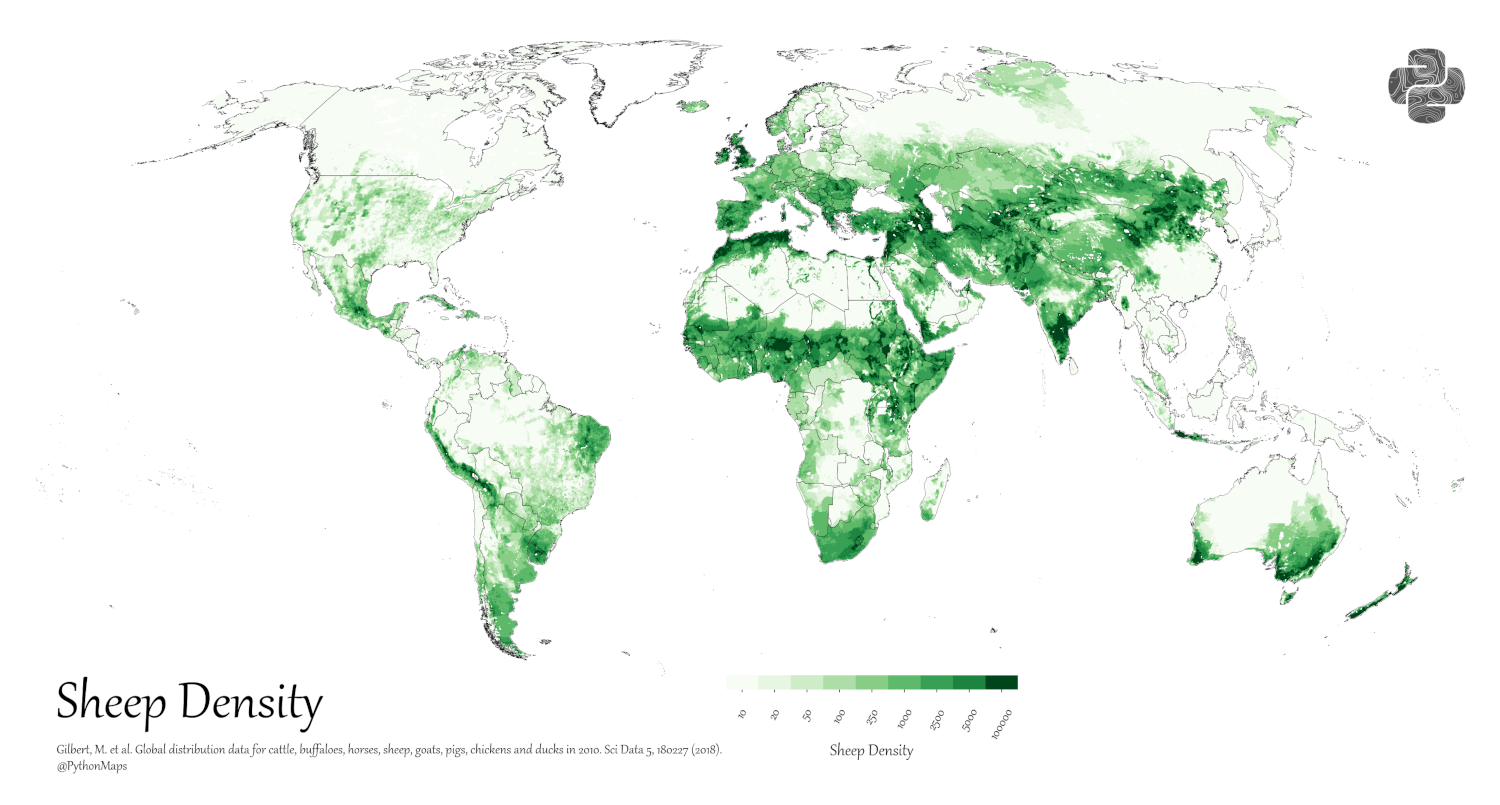
Click to view this graphic in a higher-resolution.
Sheep can be seen in higher numbers throughout North and Central Africa, the Middle East, and Central Asia. Australia, New Zealand, and the UK also stand out in their regions for higher concentrations of sheep.
Goat Livestock Density
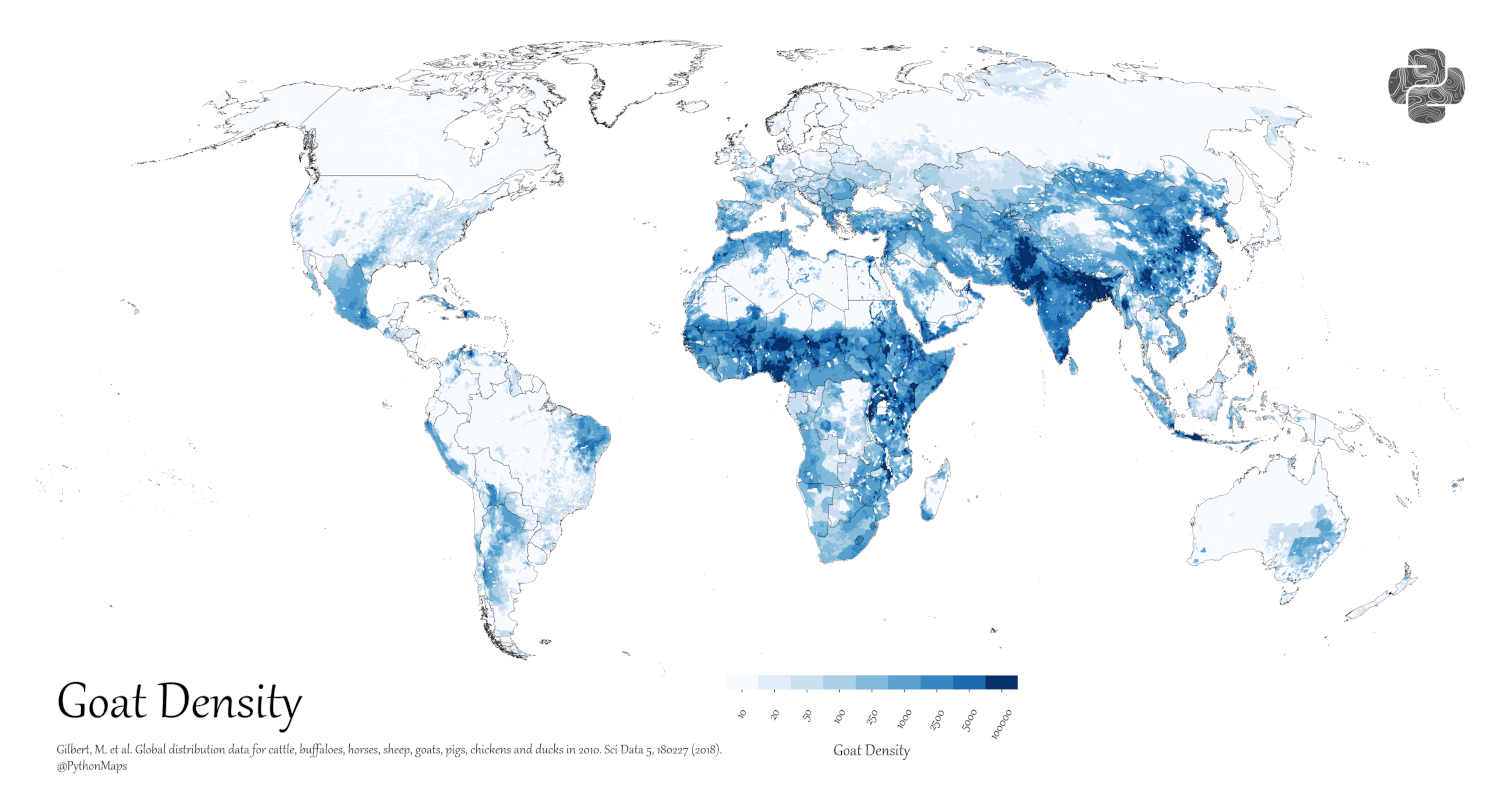
Click to view this graphic in a higher-resolution.
Goats have their highest concentrations in North India, North China, Mongolia, and many countries across Africa. Nigeria in particular has a strong goat farming industry.
Here’s a breakdown of duck, sheep, and goat meat production by country in 2021.
| Territory | Sheep (Tons) | Goat (Tons) | Duck (Tons) |
|---|---|---|---|
| 🇦🇫 Afghanistan | 109,931 | 47,212 | N/A |
| 🇦🇱 Albania | 15,725 | 7,208 | N/A |
| 🇩🇿 Algeria | 342,295 | 18,929 | N/A |
| 🇦🇴 Angola | 4,747 | 20,443 | N/A |
| 🇦🇬 Antigua & Barbuda | 4 | 3 | N/A |
| 🇦🇷 Argentina | 51,806 | 7,185 | 9,867 |
| 🇦🇲 Armenia | 10,872 | 29 | N/A |
| 🇦🇺 Australia | 656,750 | 16,380 | 15,167 |
| 🇦🇹 Austria | 6,750 | 670 | N/A |
| 🇦🇿 Azerbaijan | 87,647 | N/A | N/A |
| 🇧🇸 Bahamas | 30 | 74 | N/A |
| 🇧🇭 Bahrain | 25,028 | 243 | N/A |
| 🇧🇩 Bangladesh | 5,114 | 229,580 | 60,461 |
| 🇧🇧 Barbados | 65 | 30 | N/A |
| 🇧🇾 Belarus | 1,200 | N/A | 3,500 |
| 🇧🇪 Belgium | 2,740 | 390 | 100 |
| 🇧🇿 Belize | 38 | 1 | 15 |
| 🇧🇯 Benin | 8,375 | 8,404 | N/A |
| 🇧🇹 Bhutan | 161 | 364 | N/A |
| 🇧🇴 Bolivia | 30,374 | 7,374 | 1,977 |
| 🇧🇦 Bosnia & Herzegovina | 1,332 | N/A | 0 |
| 🇧🇼 Botswana | 1,059 | 4,164 | N/A |
| 🇧🇷 Brazil | 102,555 | 38,666 | 6,914 |
| 🇧🇳 Brunei Darussalam | 30 | 41 | 240 |
| 🇧🇬 Bulgaria | 8,690 | 1,890 | 19,860 |
| 🇧🇫 Burkina Faso | 23,830 | 51,046 | N/A |
| 🇧🇮 Burundi | 804 | 8,570 | N/A |
| 🇨🇻 Cabo Verde | 77 | 1,209 | N/A |
| 🇰🇭 Cambodia | N/A | N/A | 10,355 |
| 🇨🇲 Cameroon | 15,532 | 19,052 | 0 |
| 🇨🇦 Canada | 17,765 | N/A | 9,326 |
| 🇨🇫 Central African Republic | 2,513 | 23,874 | N/A |
| 🇹🇩 Chad | 206,070 | 139,815 | N/A |
| 🇨🇱 Chile | 8,210 | 4,885 | N/A |
| 🇨🇳 China | 2,621,800 | 2,519,000 | 4,823,000 |
| 🇨🇴 Colombia | 572 | 434 | N/A |
| 🇰🇲 Comoros | 96 | 377 | N/A |
| 🇨🇩 Congo | 451 | 1,068 | N/A |
| 🇨🇰 Cook Islands | N/A | 1 | N/A |
| 🇨🇷 Costa Rica | 15 | 254 | N/A |
| 🇨🇮 Côte d'Ivoire | 8,987 | 8,933 | N/A |
| 🇭🇷 Croatia | 5,610 | 500 | N/A |
| 🇨🇺 Cuba | 16,300 | 8,200 | N/A |
| 🇨🇾 Cyprus | 2,620 | 2,530 | 0 |
| 🇨🇿 Czechia | 3,170 | 260 | N/A |
| 🇩🇰 Denmark | 1,300 | N/A | 0 |
| 🇩🇯 Djibouti | 2,242 | 2,296 | N/A |
| 🇩🇲 Dominica | 26 | 41 | N/A |
| 🇩🇴 Dominican Republic | 915 | 855 | N/A |
| 🇨🇩 DRC | 2,839 | 18,664 | N/A |
| 🇪🇨 Ecuador | 6,495 | 669 | 560 |
| 🇪🇬 Egypt | 55,783 | 13,941 | 41,817 |
| 🇸🇻 El Salvador | 37 | 78 | N/A |
| 🇬🇶 Equatorial Guinea | 107 | 50 | N/A |
| 🇪🇷 Eritrea | 6,721 | 6,311 | N/A |
| 🇪🇪 Estonia | 340 | 10 | 0 |
| 🇸🇿 Eswatini | 704 | 1,620 | N/A |
| 🇪🇹 Ethiopia | 141,177 | 154,233 | N/A |
| 🇫🇴 Faroe Islands | 590 | N/A | N/A |
| 🇫🇯 Fiji | 146 | 186 | 406 |
| 🇫🇮 Finland | 1,320 | N/A | 0 |
| 🇫🇷 France | 81,790 | 6,210 | 177,000 |
| 🇵🇫 French Polynesia | 3 | 71 | 32 |
| 🇬🇦 Gabon | 862 | 352 | N/A |
| 🇬🇲 Gambia | 311 | 892 | N/A |
| 🇬🇪 Georgia | 4,400 | N/A | 100 |
| 🇩🇪 Germany | 33,360 | 450 | 21,871 |
| 🇬🇭 Ghana | 25,232 | 31,212 | N/A |
| 🇬🇷 Greece | 63,780 | 22,090 | 30 |
| 🇬🇩 Grenada | 114 | 27 | N/A |
| 🇬🇹 Guatemala | 2,096 | 217 | N/A |
| 🇬🇳 Guinea | 10,822 | 17,091 | N/A |
| 🇬🇼 Guinea-Bissau | 1,264 | 980 | N/A |
| 🇬🇾 Guyana | 562 | 273 | N/A |
| 🇭🇹 Haiti | 1,618 | 5,318 | 217 |
| 🇭🇳 Honduras | 102 | 155 | N/A |
| 🇭🇰 Hong Kong | 0 | 93 | 508 |
| 🇭🇺 Hungary | 1,270 | 100 | 89,640 |
| 🇮🇸 Iceland | 9,388 | N/A | N/A |
| 🇮🇳 India | 276,379 | 547,915 | 44,000 |
| 🇮🇩 Indonesia | 55,863 | 61,725 | 44,198 |
| 🇮🇷 Iran | 238,135 | 38,424 | 2,843 |
| 🇮🇶 Iraq | 46,893 | 11,605 | N/A |
| 🇮🇪 Ireland | 63,430 | 0 | N/A |
| 🇮🇱 Israel | 39,374 | 3,383 | 2,352 |
| 🇮🇹 Italy | 29,420 | 2,250 | 2,850 |
| 🇯🇲 Jamaica | 5 | 481 | N/A |
| 🇯🇵 Japan | 215 | 36 | N/A |
| 🇯🇴 Jordan | 27,297 | 6,500 | 118 |
| 🇰🇿 Kazakhstan | 155,403 | 20,107 | 335 |
| 🇰🇪 Kenya | 50,842 | 73,063 | N/A |
| 🇰🇮 Kiribati | N/A | N/A | N/A |
| 🇰🇼 Kuwait | 52,034 | 1,063 | N/A |
| 🇰🇬 Kyrgyzstan | 70,955 | 8,881 | N/A |
| 🇱🇦 Laos | N/A | 2,826 | 4,592 |
| 🇱🇻 Latvia | 800 | 50 | N/A |
| 🇱🇧 Lebanon | 4,534 | 3,053 | N/A |
| 🇱🇸 Lesotho | 471 | 239 | N/A |
| 🇱🇷 Liberia | 929 | 1,113 | 360 |
| 🇱🇾 Libya | 29,565 | 11,901 | N/A |
| 🇱🇹 Lithuania | 1,080 | 50 | N/A |
| 🇱🇺 Luxembourg | 50 | 0 | N/A |
| 🇲🇴 Macao | N/A | 26 | 18 |
| 🇲🇬 Madagascar | 1,298 | 3,287 | 13,067 |
| 🇲🇼 Malawi | 1,675 | 63,881 | N/A |
| 🇲🇾 Malaysia | 1,937 | 1,682 | 66,644 |
| 🇲🇱 Mali | 7,182 | 11,935 | N/A |
| 🇲🇹 Malta | 150 | 20 | N/A |
| 🇲🇷 Mauritania | 38,874 | 19,821 | N/A |
| 🇲🇺 Mauritius | 22 | 16 | 45 |
| 🇲🇽 Mexico | 65,846 | 40,480 | N/A |
| 🇫🇲 Micronesia | N/A | 14 | N/A |
| 🇲🇩 Moldova | 1,348 | N/A | N/A |
| 🇲🇳 Mongolia | 149,160 | 96,535 | N/A |
| 🇲🇪 Montenegro | 1,039 | 93 | N/A |
| 🇲🇦 Morocco | 179,000 | 31,000 | N/A |
| 🇲🇿 Mozambique | 341 | 2,276 | 3,545 |
| 🇲🇲 Myanmar | 2,000 | 10,000 | 55,000 |
| 🇳🇦 Namibia | 6,594 | 3,594 | N/A |
| 🇳🇷 Nauru | N/A | N/A | N/A |
| 🇳🇵 Nepal | 2,964 | 70,755 | 442 |
| 🇳🇱 Netherlands | 15,620 | 2,840 | N/A |
| 🇳🇨 New Caledonia | 9 | 1 | N/A |
| 🇳🇿 New Zealand | 454,198 | 1,997 | 659 |
| 🇳🇮 Nicaragua | 24 | 37 | N/A |
| 🇳🇪 Niger | 19,313 | 30,799 | N/A |
| 🇳🇬 Nigeria | 151,291 | 257,519 | N/A |
| 🇳🇺 Niue | N/A | N/A | N/A |
| 🇰🇵 North Korea | 1,025 | 13,848 | 13,027 |
| 🇲🇰 North Macedonia | 3,097 | N/A | N/A |
| 🇳🇴 Norway | 24,369 | 349 | 586 |
| 🇴🇲 Oman | 32,152 | 18,176 | N/A |
| 🇵🇰 Pakistan | 247,000 | 518,000 | 5,155 |
| 🇵🇸 Palestine | 11,977 | 4,540 | N/A |
| 🇵🇦 Panama | N/A | N/A | N/A |
| 🇵🇬 Papua New Guinea | 32 | 10 | 16 |
| 🇵🇾 Paraguay | 1,778 | 786 | 1,932 |
| 🇵🇪 Peru | 33,259 | 4,948 | N/A |
| 🇵🇭 Philippines | 117 | 32,136 | 21,879 |
| 🇵🇱 Poland | 1,140 | 40 | 57,450 |
| 🇵🇹 Portugal | 15,930 | 1,250 | 9,720 |
| 🇵🇷 Puerto Rico | 19 | 11 | N/A |
| 🇶🇦 Qatar | 8,159 | 1,121 | 29 |
| 🇷🇴 Romania | 53,560 | 3,830 | 0 |
| 🇷🇺 Russia | 196,826 | 18,648 | N/A |
| 🇷🇼 Rwanda | 4,561 | 10,128 | N/A |
| 🇰🇳 Saint Kitts & Nevis | 9 | 7 | N/A |
| 🇱🇨 Saint Lucia | 99 | 62 | N/A |
| 🇻🇨 Saint Vincent & the Grenadines | 43 | 35 | N/A |
| 🇼🇸 Samoa | N/A | N/A | N/A |
| 🇸🇹 Sao Tome & Principe | 3 | 9 | 38 |
| 🇸🇦 Saudi Arabia | 90,578 | 52,861 | N/A |
| 🇸🇳 Senegal | 42,082 | 17,172 | N/A |
| 🇷🇸 Serbia | 27,604 | 3,257 | 110 |
| 🇸🇨 Seychelles | N/A | 22 | 6 |
| 🇸🇱 Sierra Leone | 2,047 | 1,622 | 2,463 |
| 🇸🇬 Singapore | 23 | 10 | 3,963 |
| 🇸🇰 Slovakia | 360 | 300 | N/A |
| 🇸🇮 Slovenia | 1,410 | 360 | 0 |
| 🇸🇧 Solomon Islands | N/A | N/A | N/A |
| 🇸🇴 Somalia | 43,693 | 39,664 | N/A |
| 🇿🇦 South Africa | 148,000 | 11,870 | 1,208 |
| 🇰🇷 South Korea | 5 | 2,434 | 74,968 |
| 🇸🇸 South Sudan | 18,810 | 24,707 | 49,008 |
| 🇪🇸 Spain | 120,390 | 10,130 | 5,000 |
| 🇱🇰 Sri Lanka | 127 | 757 | 27 |
| 🇸🇩 Sudan | 267,866 | 119,217 | N/A |
| 🇸🇷 Suriname | 13 | 7 | 800 |
| 🇸🇪 Sweden | 5,180 | 10 | N/A |
| 🇨🇭 Switzerland | 5,096 | 518 | N/A |
| 🇸🇾 Syria | 160,446 | 10,503 | 25 |
| 🇹🇼 Taiwan | N/A | 88,949 | 78,867 |
| 🇹🇯 Tajikistan | N/A | 79,826 | N/A |
| 🇹🇿 Tanzania | 30,640 | 71,500 | 1,328 |
| 🇹🇭 Thailand | 155 | 1,973 | 59,803 |
| 🇹🇱 Timor-Leste | 67 | 574 | N/A |
| 🇹🇬 Togo | 9,242 | 3,998 | N/A |
| 🇹🇰 Tokelau | N/A | N/A | N/A |
| 🇹🇴 Tonga | N/A | 28 | N/A |
| 🇹🇹 Trinidad & Tobago | 64 | 41 | N/A |
| 🇹🇳 Tunisia | 56,400 | 10,800 | N/A |
| 🇹🇷 Türkiye | 385,933 | 94,555 | 639 |
| 🇹🇲 Turkmenistan | 123,611 | 10,037 | N/A |
| 🇹🇻 Tuvalu | N/A | N/A | N/A |
| 🇺🇸 U.S. | 64,774 | 8,824 | 43,378 |
| 🇦🇪 UAE | 4,060 | 63,189 | N/A |
| 🇺🇬 Uganda | 8,360 | 31,787 | N/A |
| 🇬🇧 UK | 267,000 | N/A | 21,300 |
| 🇺🇦 Ukraine | 6,800 | 5,400 | 22,000 |
| 🇺🇾 Uruguay | 24,074 | N/A | N/A |
| 🇺🇿 Uzbekistan | 169,134 | N/A | N/A |
| 🇻🇺 Vanuatu | N/A | 32 | N/A |
| 🇻🇪 Venezuela | 3,342 | 6,593 | 49 |
| 🇻🇳 Viet Nam | N/A | 21,349 | 182,651 |
| 🇾🇪 Yemen | 45,199 | 84,516 | N/A |
| 🇿🇲 Zambia | 703 | 15,195 | N/A |
| 🇿🇼 Zimbabwe | 2,582 | 28,010 | 48 |
| 🇺🇳 World | 9,880,040 | 6,477,574 | 6,191,507 |
The Future of the Global Livestock Industry
How is the livestock industry expected to change, going forward?
For starters, the UN estimates that global meat consumption is projected to rise 14% by 2030, driven primarily by population growth. That growth will occur unevenly, from a 30% jump in Africa to a 0.4% in Europe.
At the same time, emissions from the livestock sector have increasingly come under fire in recent years, and the industry is projected to register a 5% increase by 2030.
All these factors, alongside growth in plant-based meat and cultured meat, may change livestock distribution over the coming decade.

This article was published as a part of Visual Capitalist's Creator Program, which features data-driven visuals from some of our favorite Creators around the world.


Agriculture
The World’s Top Cocoa Producing Countries
Here are the largest cocoa producing countries globally—from Côte d’Ivoire to Brazil—as cocoa prices hit record highs.
The World’s Top Cocoa Producing Countries
This was originally posted on our Voronoi app. Download the app for free on iOS or Android and discover incredible data-driven charts from a variety of trusted sources.
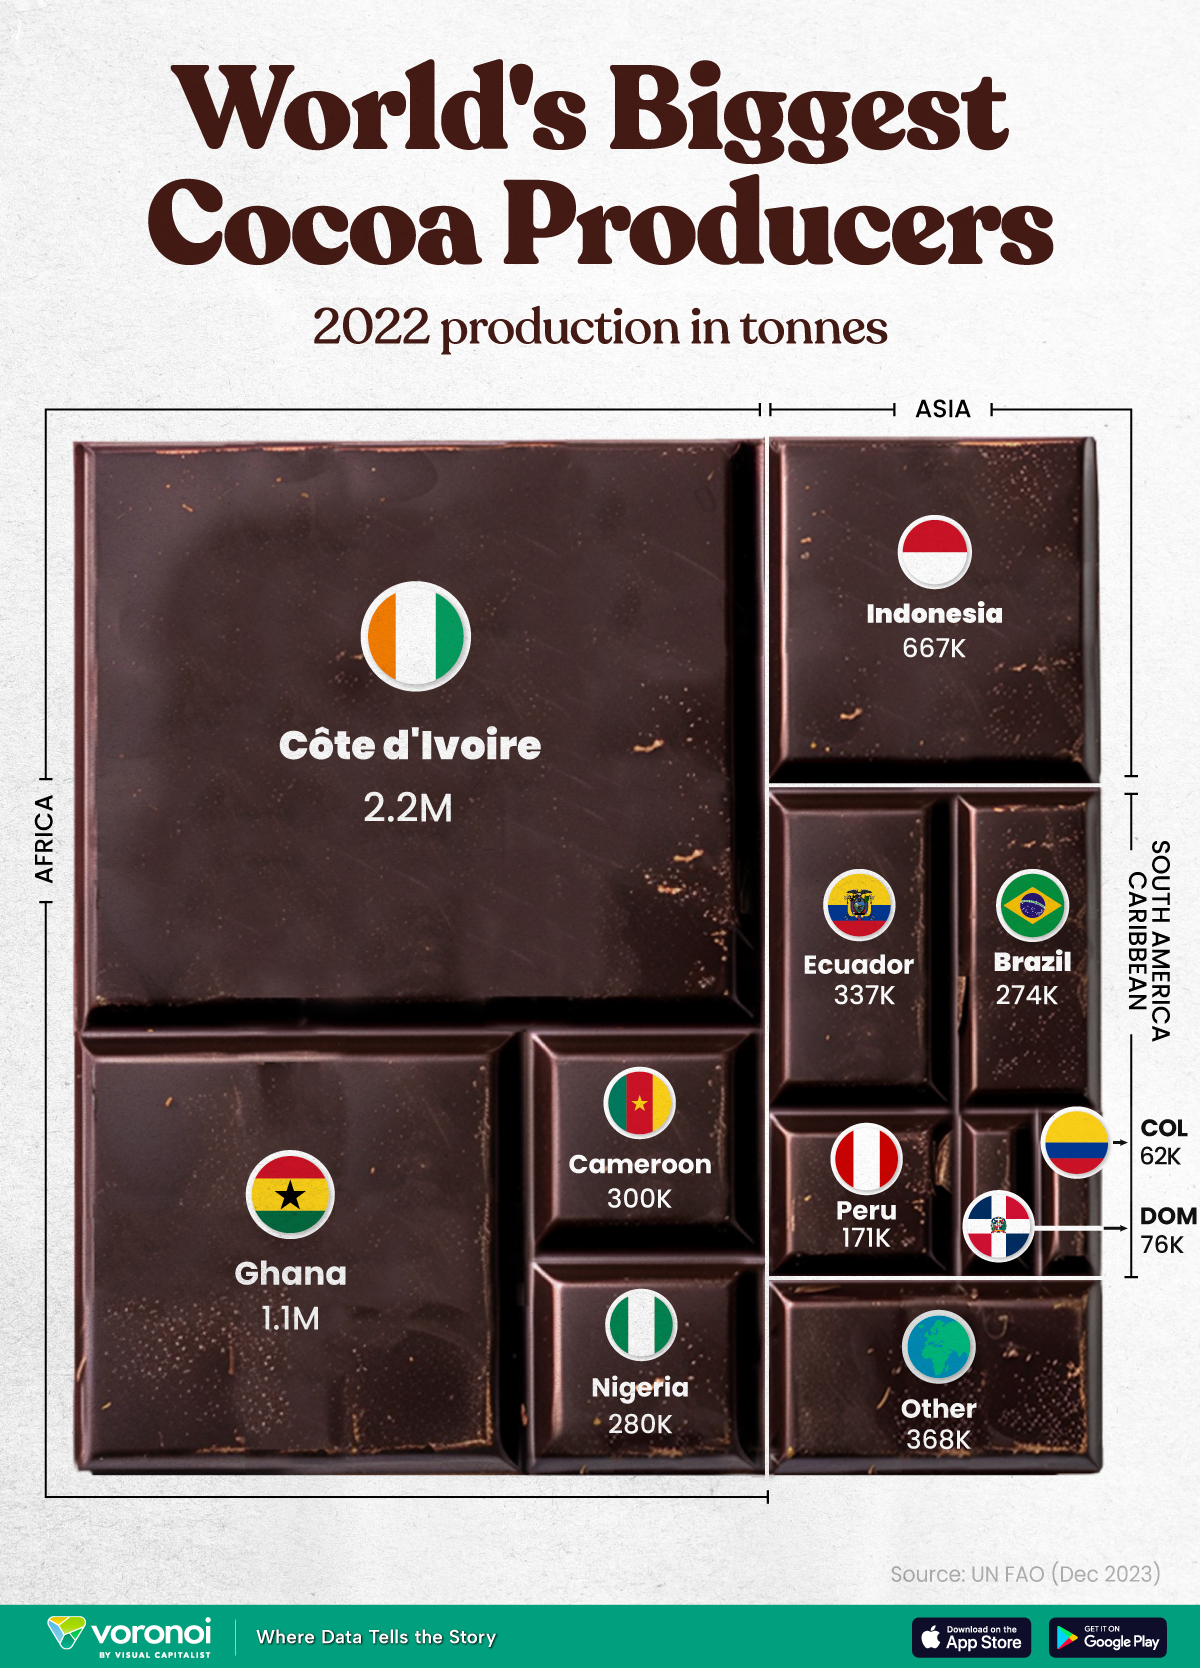
West Africa is home to the largest cocoa producing countries worldwide, with 3.9 million tonnes of production in 2022.
In fact, there are about one million farmers in Côte d’Ivoire supplying cocoa to key customers such as Nestlé, Mars, and Hershey. But the massive influence of this industry has led to significant forest loss to plant cocoa trees.
This graphic shows the leading producers of cocoa, based on data from the UN FAO.
Global Hotspots for Cocoa Production
Below, we break down the top cocoa producing countries as of 2022:
| Country | 2022 Production, Tonnes |
|---|---|
| 🇨🇮 Côte d'Ivoire | 2.2M |
| 🇬🇭 Ghana | 1.1M |
| 🇮🇩 Indonesia | 667K |
| 🇪🇨 Ecuador | 337K |
| 🇨🇲 Cameroon | 300K |
| 🇳🇬 Nigeria | 280K |
| 🇧🇷 Brazil | 274K |
| 🇵🇪 Peru | 171K |
| 🇩🇴 Dominican Republic | 76K |
| 🌍 Other | 386K |
With 2.2 million tonnes of cocoa in 2022, Côte d’Ivoire is the world’s largest producer, accounting for a third of the global total.
For many reasons, the cocoa trade in Côte d’Ivoire and Western Africa has been controversial. Often, farmers make about 5% of the retail price of a chocolate bar, and earn $1.20 each day. Adding to this, roughly a third of cocoa farms operate on forests that are meant to be protected.
As the third largest producer, Indonesia produced 667,000 tonnes of cocoa with the U.S., Malaysia, and Singapore as major importers. Overall, small-scale farmers produce 95% of cocoa in the country, but face several challenges such as low pay and unwanted impacts from climate change. Alongside aging trees in the country, these setbacks have led productivity to decline.
In South America, major producers include Ecuador and Brazil. In the early 1900s, Ecuador was the world’s largest cocoa producing country, however shifts in the global marketplace and crop disease led its position to fall. Today, the country is most known for its high-grade single-origin chocolate, with farms seen across the Amazon rainforest.
Altogether, global cocoa production reached 6.5 million tonnes, supported by strong demand. On average, the market has grown 3% annually over the last several decades.

-

 United States6 days ago
Visualizing the Most Common Pets in the U.S.
-

 Debt2 weeks ago
How Debt-to-GDP Ratios Have Changed Since 2000
-

 Sports2 weeks ago
The Highest Earning Athletes in Seven Professional Sports
-

 Science2 weeks ago
Visualizing the Average Lifespans of Mammals
-

 Brands2 weeks ago
How Tech Logos Have Evolved Over Time
-

 Energy2 weeks ago
Ranked: The Top 10 EV Battery Manufacturers in 2023
-

 Demographics2 weeks ago
Countries With the Largest Happiness Gains Since 2010
-

 VC+2 weeks ago
VC+: Get Our Key Takeaways From the IMF’s World Economic Outlook