Misc
Cognitive Biases: Three Common Types Illustrated
Article/Editing:
In a world of information overload, we can fall victim to all sorts of cognitive biases. Since they can lead us to generate false conclusions, it’s particularly important to understand what these biases are and how they work, as the consequences can become quite drastic.
Confirmation bias, sampling bias, and brilliance bias are three examples that can affect our ability to critically engage with information. Jono Hey of Sketchplanations walks us through these cognitive bias examples, to help us better understand how they influence our day-to-day lives.
Confirmation Bias
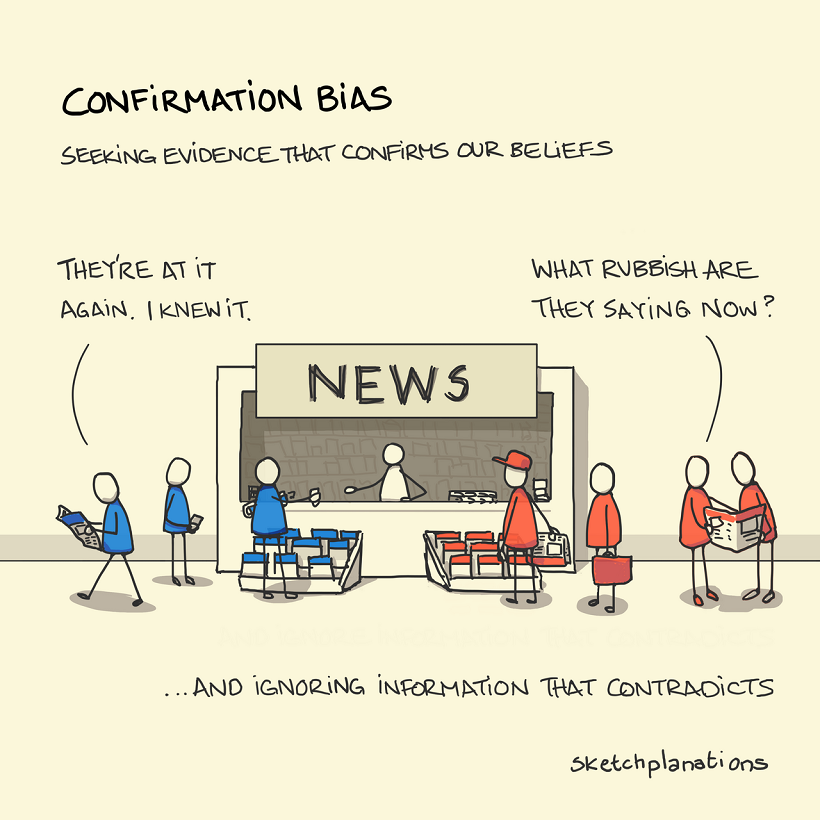
One of the most-commonly encountered and understood, you’re likely to have already heard about confirmation bias. This cognitive bias affects the way we test and evaluate hypotheses every day.
In simple terms, confirmation bias is the tendency to seek out or interpret evidence in such a way that supports our own strongly-held beliefs or expectations. This means that, given access to the same set of data and information, different people can come to wildly differing conclusions.
Feeding into confirmation bias can lead us to make ill-informed choices or even reinforce negative stereotypes. For this reason, it is important to remember to seek out information that both confirms and contradicts your presumptions about a certain topic.
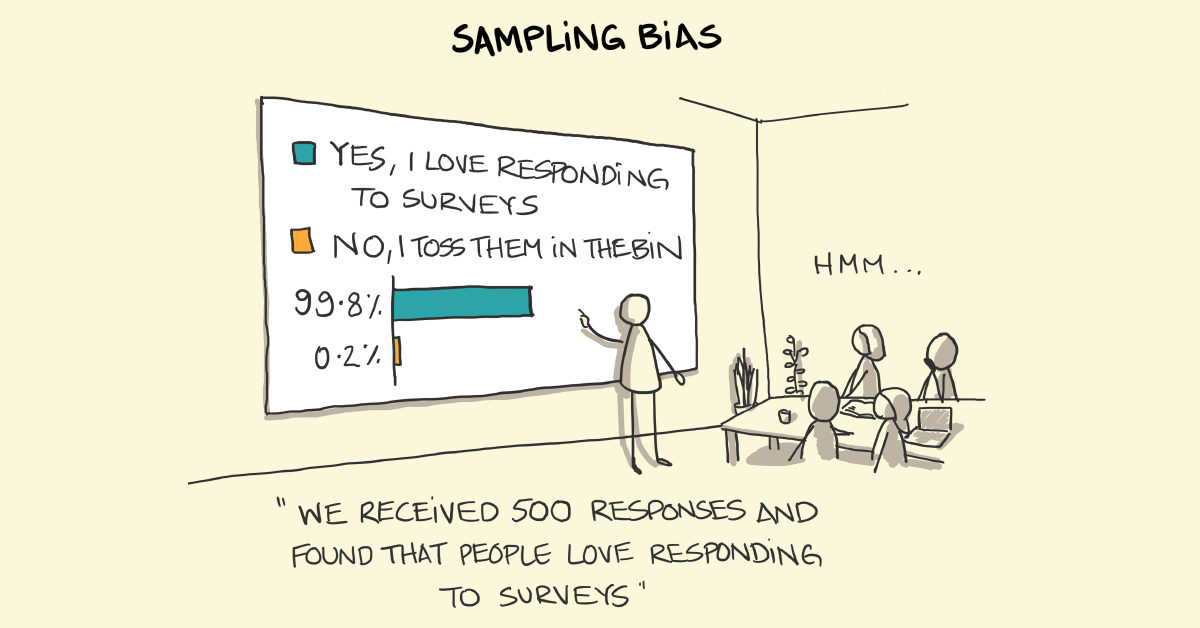
Sampling Bias
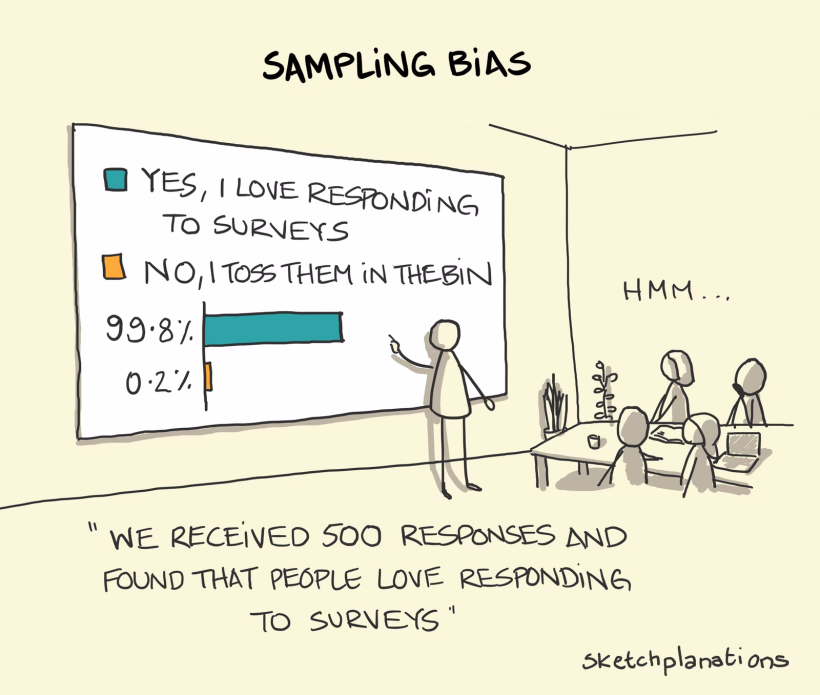
Sampling bias is a kind of bias that allows us to come to faulty conclusions based on inaccurate sample groups or data. Generally, the cause of sample bias is in poor study design and data collection.
When polling individuals for survey questions, it is important to get a representative picture of an entire population. But this can prove surprisingly difficult when the people generating the study are also prone to human flaws, including cognitive biases.
A common example involves conducting a survey on which political party is likely to win an election. If the study is run by a professor who only polls college students, since they are around and therefore easier to collect information from, the poll will not accurately reflect the opinions of the general population.
To avoid sampling bias, it is important to randomize data collection to ensure responses are not skewed towards individuals with similar characteristics.
Brilliance Bias
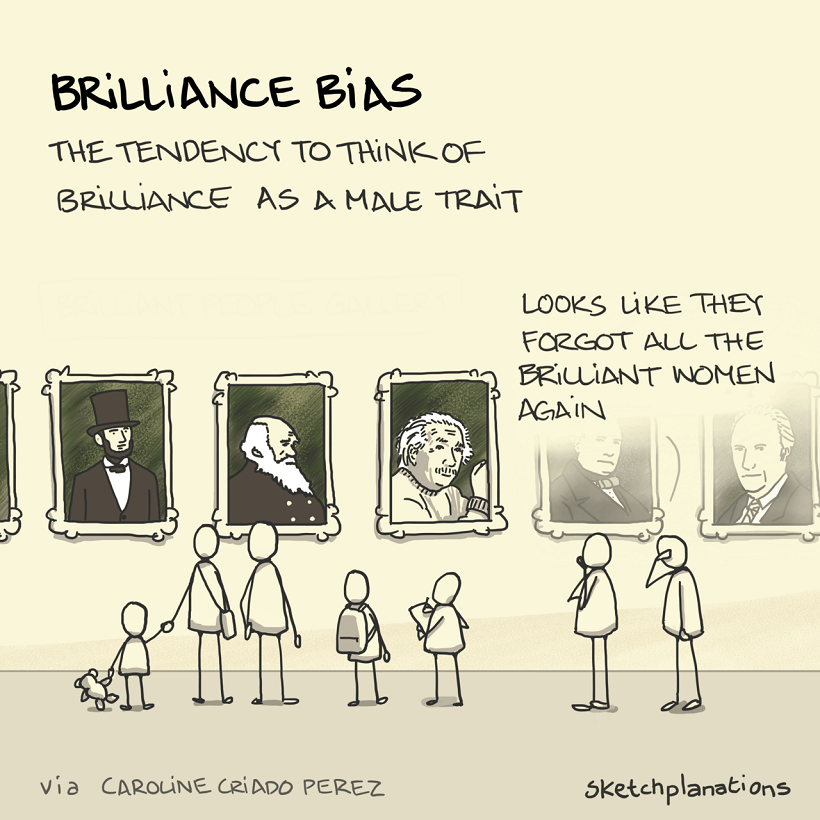
Brilliance bias is another common cognitive bias that makes us more likely to think of genius as a masculine trait. This is in part due to the lack of female representation in both traditional academic and executive positions.
In fact, The Journal of Experimental Social Psychology published an in-depth study on brilliance bias in 2020. It suggests that a likely source of this bias is in the uneven distribution of men and women across careers typically associated with higher level intelligence.
While this distribution is a remnant of historical factors that limited access to education and career choices for women in the past, its presence has made us (wrongly) conclude that women are less brilliant instead. Naturally, as the cycle perpetuates the uneven distribution of women in these careers, it only reinforces this bias.
Other Cognitive Bias Examples
These few examples from Jono Hey give a good overview of some of the biases we face when trying to understand the data given to us, but they are just the tip of the iceberg.
It is important to be cognizant of these biases in an era where we are constantly engaging with information, especially if we want to combat some of the harmful consequences they entail.

This article was published as a part of Visual Capitalist's Creator Program, which features data-driven visuals from some of our favorite Creators around the world.


Public Opinion
Charted: How Americans Feel About Federal Government Agencies
Fourteen of 16 federal government agencies garnered more favorable responses than unfavorable ones. But what were the outliers?
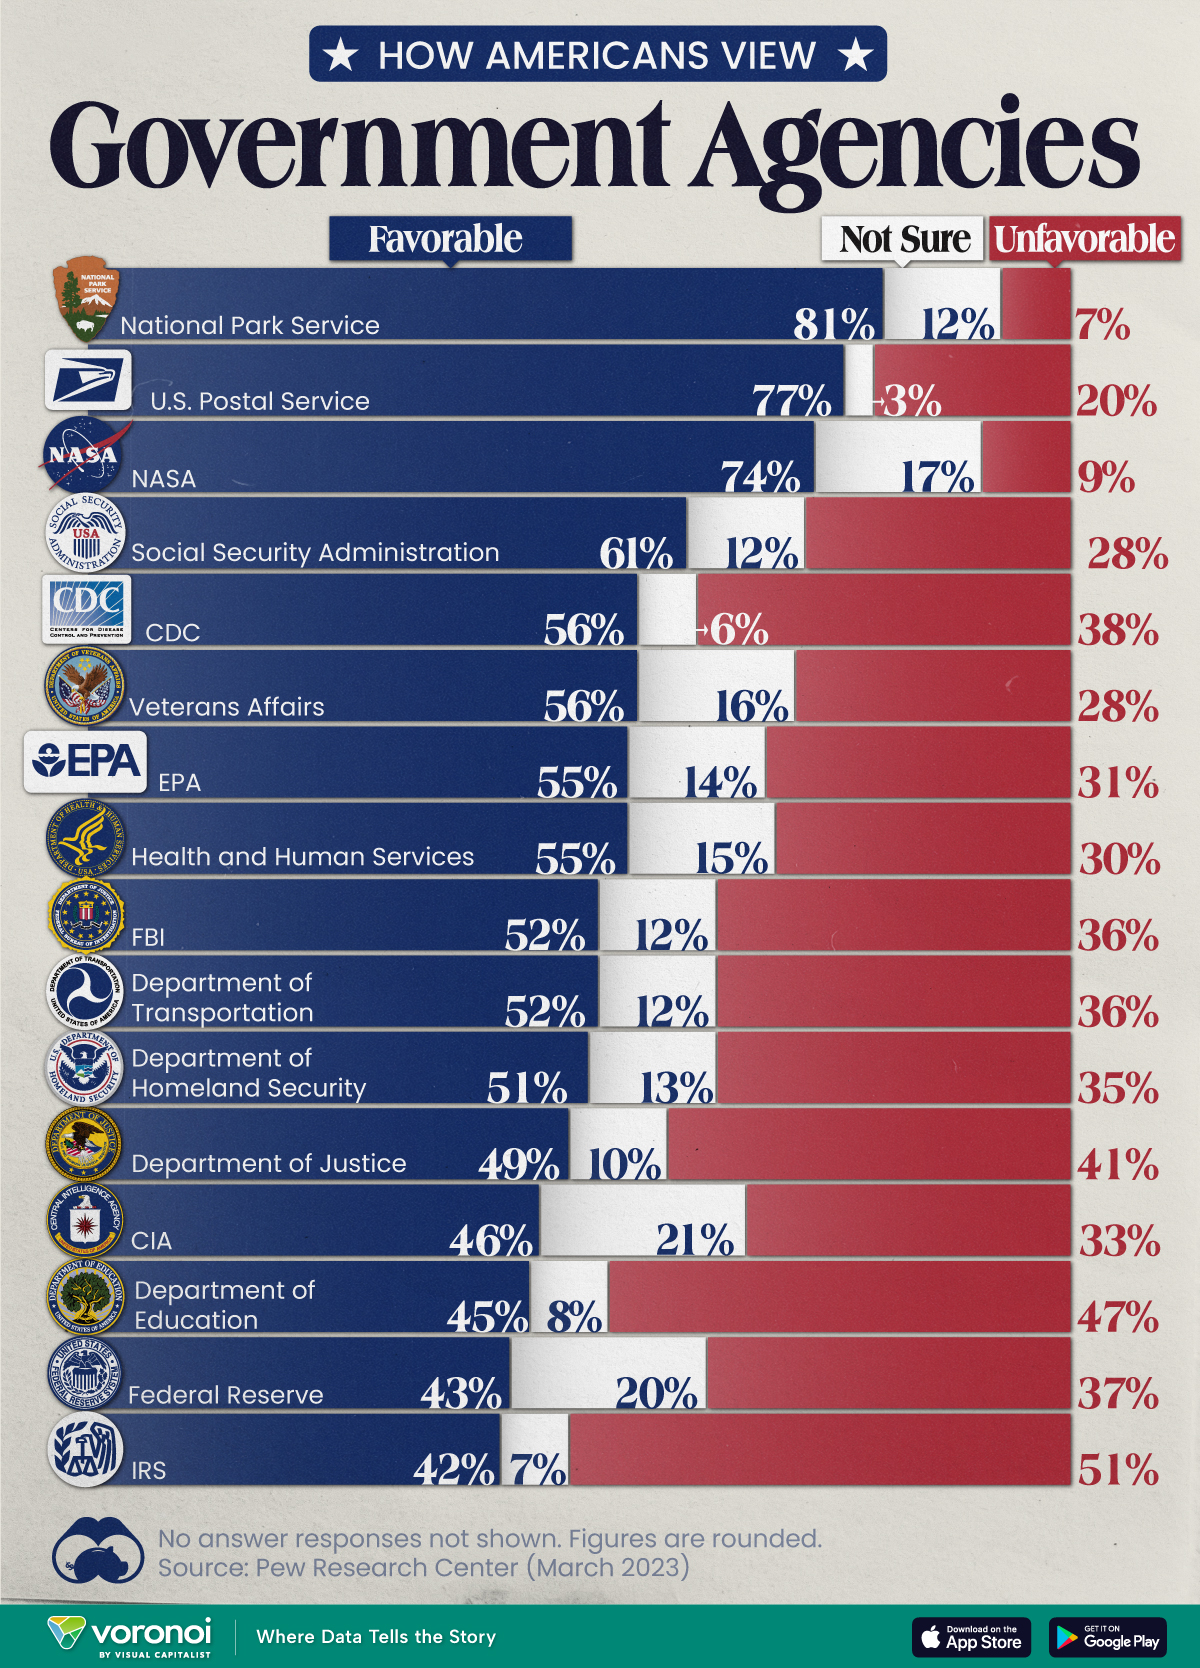
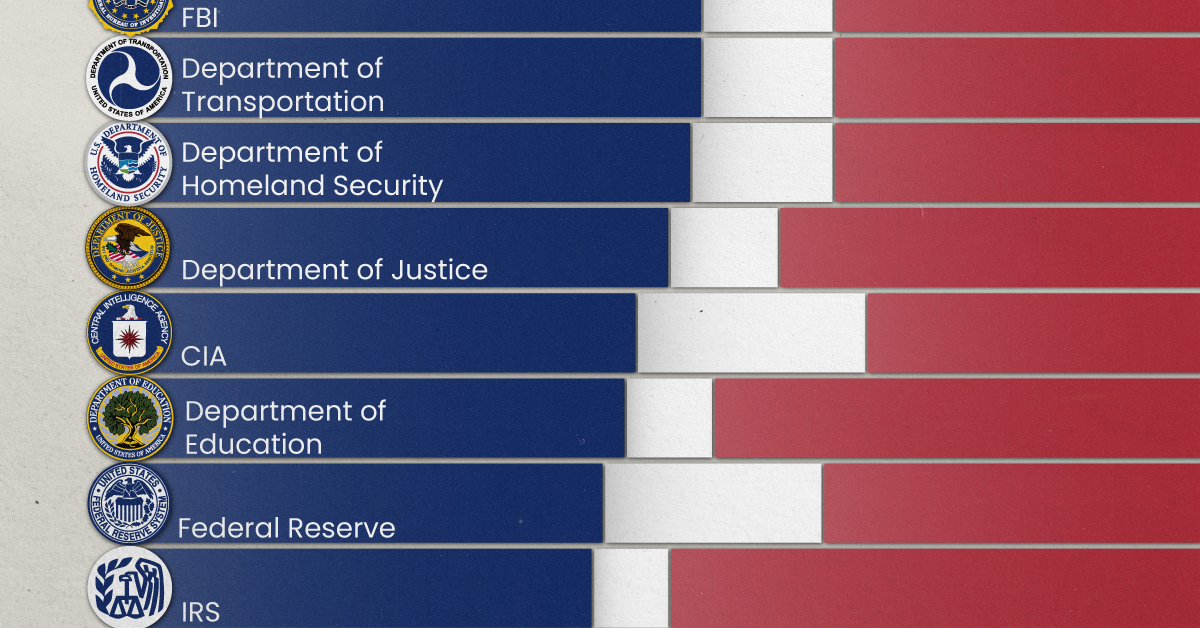
Chart: How Americans Rate 16 Federal Government Agencies
This was originally posted on our Voronoi app. Download the app for free on iOS or Android and discover incredible data-driven charts from a variety of trusted sources.
Come election time, America won’t hesitate to show its approval or disapproval of the country’s elected political representatives. That said, feelings about the federal bureaucracy and its associated agencies are a little harder to gauge.
We chart the results from an opinion poll conducted by Pew Research Center between March 13-19, 2023. In it, 10,701 adults—a representative of the U.S. adult population—were asked whether they felt favorably or unfavorably towards 16 different federal government agencies.
Americans Love the Park Service, Are Divided Over the IRS
Broadly speaking, 14 of the 16 federal government agencies garnered more favorable responses than unfavorable ones.
Of them, the Parks Service, Postal Service, and NASA all had the approval of more than 70% of the respondents.
| Agency | Favorable | Unfavorable | Not sure |
|---|---|---|---|
| 🏞️ National Park Service | 81% | 7% | 12% |
| 📮 U.S. Postal Service | 77% | 20% | 3% |
| 🚀 NASA | 74% | 9% | 17% |
| 💼 Social Security Administration | 61% | 28% | 12% |
| 🔬 CDC | 56% | 38% | 6% |
| 🎖️ Veterans Affairs | 56% | 28% | 16% |
| 🌿 EPA | 55% | 31% | 14% |
| 💉 Health & Human Services | 55% | 30% | 15% |
| 🕵️ FBI | 52% | 36% | 12% |
| 🚗 Department of Transportation | 52% | 36% | 12% |
| 🛡️ Department of Homeland Security | 51% | 35% | 13% |
| ⚖️ Department of Justice | 49% | 41% | 10% |
| 🕵️♂️ CIA | 46% | 33% | 21% |
| 📚 Department of Education | 45% | 47% | 8% |
| 💰 Federal Reserve | 43% | 37% | 20% |
| 💼 IRS | 42% | 51% | 7% |
Note: Figures are rounded. No answer responses are not shown.
Only the Department of Education and the IRS earned more unfavorable responses, and between them, only the IRS had a majority (51%) of unfavorable responses.
There are some caveats to remember with this data. Firstly, tax collection is a less-friendly activity than say, maintaining picturesque parks. Secondly, the survey was conducted a month before taxes were typically due, a peak time for experiencing filing woes.
Nevertheless, the IRS has come under fire in recent years. As per a New York Times article in 2019, eight years of budget cuts have stymied the agency’s ability to scrutinize tax filings from wealthier and more sophisticated filers.
At the same time poorer Americans are facing increasing audits on wage subsidies available to low income workers. According to a Transactional Records Access Clearinghouse report, this subset of filers was audited five-and-a-half more times the average American.

-

 Markets5 days ago
Mapped: The Most Valuable Company in Each Southeast Asian Country
-

 Markets2 weeks ago
The Top Private Equity Firms by Country
-

 Jobs2 weeks ago
The Best U.S. Companies to Work for According to LinkedIn
-

 Economy2 weeks ago
Ranked: The Top 20 Countries in Debt to China
-

 Politics1 week ago
Charted: Trust in Government Institutions by G7 Countries
-

 Energy1 week ago
Mapped: The Age of Energy Projects in Interconnection Queues, by State
-

 Mining1 week ago
Visualizing Global Gold Production in 2023
-

 Markets1 week ago
Visualized: Interest Rate Forecasts for Advanced Economies