Markets
COVID-19 Crash: How China’s Economy May Offer a Glimpse of the Future
The Economic Impact of COVID-19
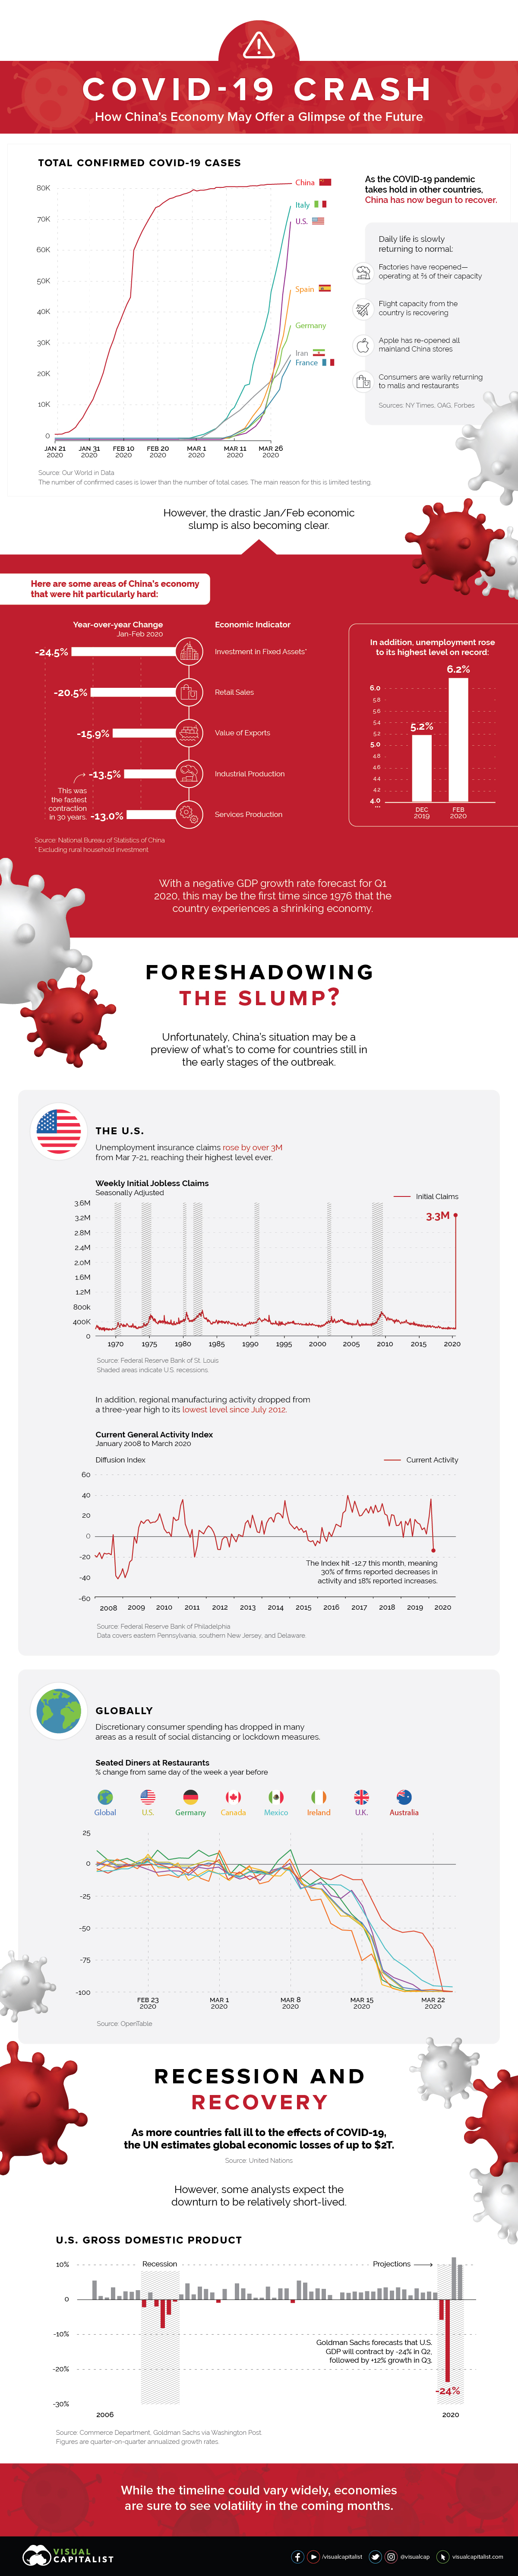
China, once the epicenter of the COVID-19 pandemic, appears to be turning a corner. As the number of reported local transmission cases hovers near zero, daily life is slowly returning to normal. However, economic data from the first two months of the year shows the damage done to the country’s finances.
Today’s visualization outlines the sharp losses China’s economy has experienced, and how this may foreshadow what’s to come for countries currently in the early stages of the outbreak.
A Historic Slump
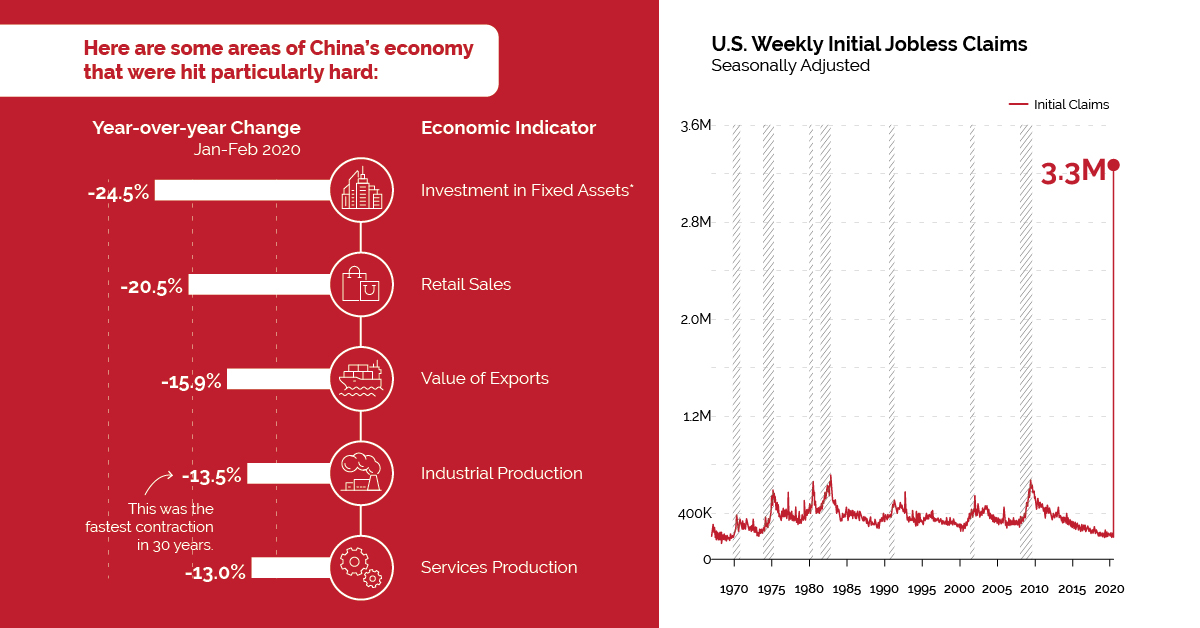
The results are in: China’s business activity slowed considerably as COVID-19 spread.
| Economic Indicator | Year-over-year Change (Jan-Feb 2020) |
|---|---|
| Investment in Fixed Assets* | -24.5% |
| Retail Sales | -20.5% |
| Value of Exports | -15.9% |
| Industrial Production | -13.5% |
| Services Production | -13.0% |
*Excluding rural household investment
As factories and shops reopen, China seems to be over the initial supply side shock caused by the lockdown. However, the country now faces a double-headed demand shock:
- Domestic demand is slow to gain traction due to psychological scars, bankruptcies, and job losses. In a survey conducted by a Beijing financial firm, almost 65% of respondents plan to “restrain” their spending habits after the virus.
- Overseas demand is suffering as more countries face outbreaks. Many stores are closing up shop and/or cancelling orders, leading to an oversupply of goods.
With a fast recovery seeming highly unlikely, many economists expect China’s GDP to shrink in the first quarter of 2020—the country’s first decline since 1976.
Danger on the Horizon
Are other countries destined to follow the same path? Based on preliminary economic data, it would appear so.
The U.S.
About half the U.S. population is on stay-at-home orders, severely restricting economic activity and forcing widespread layoffs. In the week ending March 21, total unemployment insurance claims rose to almost 3.3 million—their highest level in recorded history. For context, weekly claims reached a high of 665,000 during the global financial crisis.
“…The economy has just fallen over the cliff and is turning down into a recession.”
—Chris Rupkey, Chief Economist at MUFG in New York
In addition, manufacturing activity in eastern Pennsylvania, southern New Jersey, and Delaware dropped to its lowest level since July 2012.
Globally
Other countries are also feeling the economic impact of COVID-19. For example, global online bookings for seated diners have declined by 100% year-over-year. In Canada, nearly one million people have applied for unemployment benefits.
Hard-hit countries such as Italy and Spain, which already suffer from high unemployment, are also expecting to see economic blows. However, it’s too soon to gauge the extent of the damage.
Light at the End of the Tunnel
Given the near-shutdown of many economies, the IMF is forecasting a global recession in 2020. Separately, the UN estimates COVID-19 could cause up to a $2 trillion shortfall in global income.
On the bright side, some analysts are forecasting a recovery as early as the third quarter of 2020. A variety of factors, such as government stimulus, consumer confidence, and the number of COVID-19 cases, will play into this timeline.


Markets
Mapped: Europe’s GDP Per Capita, by Country
Which European economies are richest on a GDP per capita basis? This map shows the results for 44 countries across the continent.


Mapped: Europe’s GDP Per Capita, by Country (2024)
This was originally posted on our Voronoi app. Download the app for free on iOS or Android and discover incredible data-driven charts from a variety of trusted sources.
Europe is home to some of the largest and most sophisticated economies in the world. But how do countries in the region compare with each other on a per capita productivity basis?
In this map, we show Europe’s GDP per capita levels across 44 nations in current U.S. dollars. Data for this visualization and article is sourced from the International Monetary Fund (IMF) via their DataMapper tool, updated April 2024.
Europe’s Richest and Poorest Nations, By GDP Per Capita
Luxembourg, Ireland, and Switzerland, lead the list of Europe’s richest nations by GDP per capita, all above $100,000.
| Rank | Country | GDP Per Capita (2024) |
|---|---|---|
| 1 | 🇱🇺 Luxembourg | $131,380 |
| 2 | 🇮🇪 Ireland | $106,060 |
| 3 | 🇨🇭 Switzerland | $105,670 |
| 4 | 🇳🇴 Norway | $94,660 |
| 5 | 🇮🇸 Iceland | $84,590 |
| 6 | 🇩🇰 Denmark | $68,900 |
| 7 | 🇳🇱 Netherlands | $63,750 |
| 8 | 🇸🇲 San Marino | $59,410 |
| 9 | 🇦🇹 Austria | $59,230 |
| 10 | 🇸🇪 Sweden | $58,530 |
| 11 | 🇧🇪 Belgium | $55,540 |
| 12 | 🇫🇮 Finland | $55,130 |
| 13 | 🇩🇪 Germany | $54,290 |
| 14 | 🇬🇧 UK | $51,070 |
| 15 | 🇫🇷 France | $47,360 |
| 16 | 🇦🇩 Andorra | $44,900 |
| 17 | 🇲🇹 Malta | $41,740 |
| 18 | 🇮🇹 Italy | $39,580 |
| 19 | 🇨🇾 Cyprus | $37,150 |
| 20 | 🇪🇸 Spain | $34,050 |
| 21 | 🇸🇮 Slovenia | $34,030 |
| 22 | 🇪🇪 Estonia | $31,850 |
| 23 | 🇨🇿 Czech Republic | $29,800 |
| 24 | 🇵🇹 Portugal | $28,970 |
| 25 | 🇱🇹 Lithuania | $28,410 |
| 26 | 🇸🇰 Slovakia | $25,930 |
| 27 | 🇱🇻 Latvia | $24,190 |
| 28 | 🇬🇷 Greece | $23,970 |
| 29 | 🇭🇺 Hungary | $23,320 |
| 30 | 🇵🇱 Poland | $23,010 |
| 31 | 🇭🇷 Croatia | $22,970 |
| 32 | 🇷🇴 Romania | $19,530 |
| 33 | 🇧🇬 Bulgaria | $16,940 |
| 34 | 🇷🇺 Russia | $14,390 |
| 35 | 🇹🇷 Türkiye | $12,760 |
| 36 | 🇲🇪 Montenegro | $12,650 |
| 37 | 🇷🇸 Serbia | $12,380 |
| 38 | 🇦🇱 Albania | $8,920 |
| 39 | 🇧🇦 Bosnia & Herzegovina | $8,420 |
| 40 | 🇲🇰 North Macedonia | $7,690 |
| 41 | 🇧🇾 Belarus | $7,560 |
| 42 | 🇲🇩 Moldova | $7,490 |
| 43 | 🇽🇰 Kosovo | $6,390 |
| 44 | 🇺🇦 Ukraine | $5,660 |
| N/A | 🇪🇺 EU Average | $44,200 |
Note: Figures are rounded.
Three Nordic countries (Norway, Iceland, Denmark) also place highly, between $70,000-90,000. Other Nordic peers, Sweden and Finland rank just outside the top 10, between $55,000-60,000.
Meanwhile, Europe’s biggest economies in absolute terms, Germany, UK, and France, rank closer to the middle of the top 20, with GDP per capitas around $50,000.
Finally, at the end of the scale, Eastern Europe as a whole tends to have much lower per capita GDPs. In that group, Ukraine ranks last, at $5,660.
A Closer Look at Ukraine
For a broader comparison, Ukraine’s per capita GDP is similar to Iran ($5,310), El Salvador ($5,540), and Guatemala ($5,680).
According to experts, Ukraine’s economy has historically underperformed to expectations. After the fall of the Berlin Wall, the economy contracted for five straight years. Its transition to a Western, liberalized economic structure was overshadowed by widespread corruption, a limited taxpool, and few revenue sources.
Politically, its transformation from authoritarian regime to civil democracy has proved difficult, especially when it comes to institution building.
Finally, after the 2022 invasion of the country, Ukraine’s GDP contracted by 30% in a single year—the largest loss since independence. Large scale emigration—to the tune of six million refugees—is also playing a role.
Despite these challenges, the country’s economic growth has somewhat stabilized while fighting continues.

-

 Markets5 days ago
Mapped: The Most Valuable Company in Each Southeast Asian Country
-

 Markets2 weeks ago
The Top Private Equity Firms by Country
-

 Jobs2 weeks ago
The Best U.S. Companies to Work for According to LinkedIn
-

 Economy2 weeks ago
Ranked: The Top 20 Countries in Debt to China
-

 Politics1 week ago
Charted: Trust in Government Institutions by G7 Countries
-

 Energy1 week ago
Mapped: The Age of Energy Projects in Interconnection Queues, by State
-

 Mining1 week ago
Visualizing Global Gold Production in 2023
-

 Markets1 week ago
Visualized: Interest Rate Forecasts for Advanced Economies