Markets
Visualizing the Countries Most Reliant on Tourism


Visualizing the Countries Most Reliant on Tourism
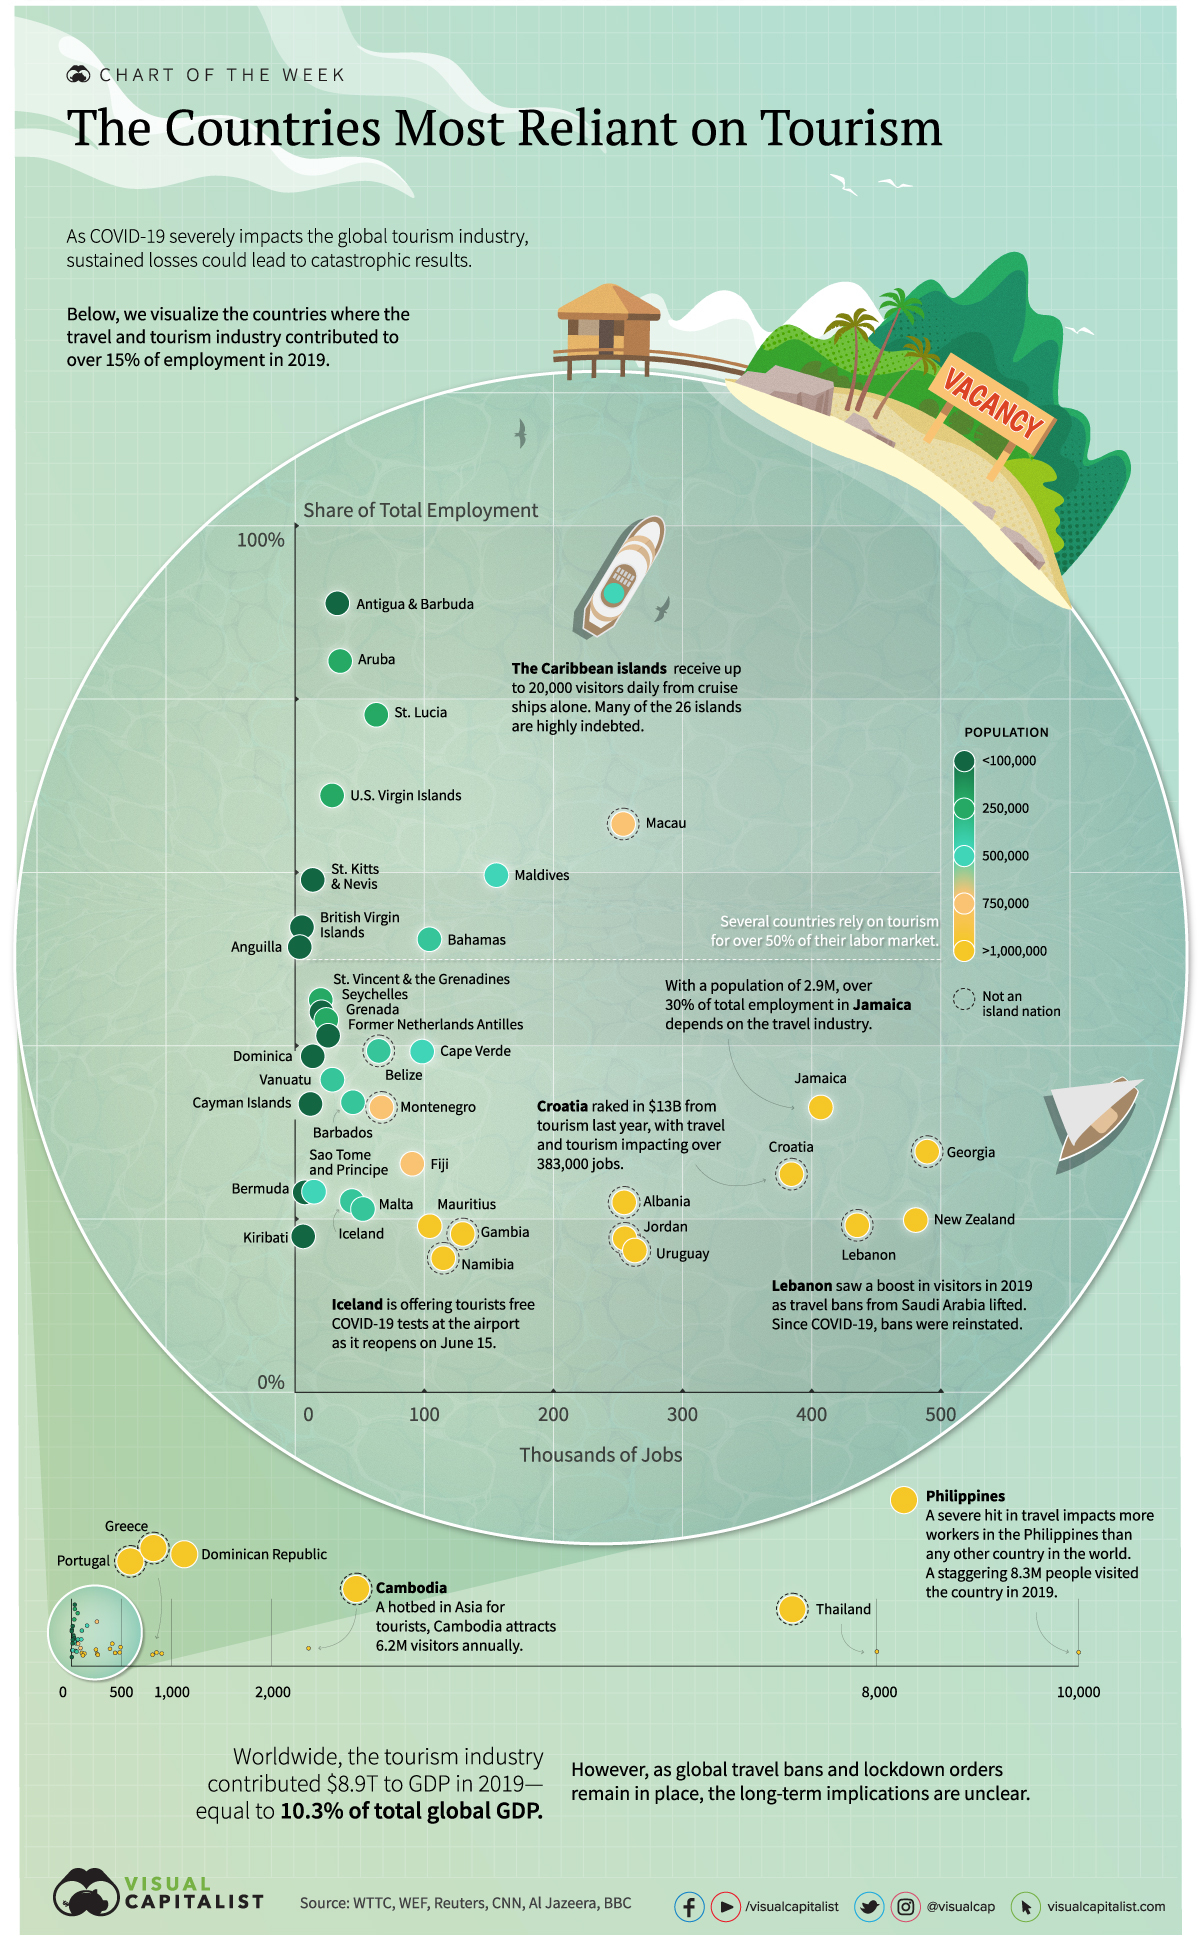
Without a steady influx of tourism revenue, many countries could face severe economic damage.
As the global travel and tourism industry stalls, the spillover effects to global employment are wide-reaching. A total of 330 million jobs are supported by this industry around the world, and it contributes 10%, or $8.9 trillion to global GDP each year.
Today’s infographic uses data from the World Travel & Tourism Council, and it highlights the countries that depend the most on the travel and tourism industry according to employment—quantifying the scale that the industry contributes to the health of the global economy.
Ground Control
Worldwide, 44 countries rely on the travel and tourism industry for more than 15% of their total share of employment. Unsurprisingly, many of the countries suffering the most economic damage are island nations.
At the same time, data reveals the extent to which certain larger nations rely on tourism. In New Zealand, for example, 479,000 jobs are generated by the travel and tourism industry, while in Cambodia tourism contributes to 2.4 million jobs.
| Rank | Country | T&T Share of Jobs (2019) | T&T Jobs (2019) | Population |
|---|---|---|---|---|
| 1 | Antigua & Barbuda | 91% | 33,800 | 97,900 |
| 2 | Aruba | 84% | 35,000 | 106,800 |
| 3 | St. Lucia | 78% | 62,900 | 183,600 |
| 4 | US Virgin Islands | 69% | 28,800 | 104,400 |
| 5 | Macau | 66% | 253,700 | 649,300 |
| 6 | Maldives | 60% | 155,600 | 540,500 |
| 7 | St. Kitts & Nevis | 59% | 14,100 | 53,200 |
| 8 | British Virgin Islands | 54% | 5,500 | 30,200 |
| 9 | Bahamas | 52% | 103,900 | 393,200 |
| 10 | Anguilla | 51% | 3,800 | 15,000 |
| 11 | St. Vincent & the Grenadines | 45% | 19,900 | 110,900 |
| 12 | Seychelles | 44% | 20,600 | 98,300 |
| 13 | Grenada | 43% | 24,300 | 112,500 |
| 14 | Former Netherlands Antilles | 41% | 25,700 | 26,200 |
| 15 | Belize | 39% | 64,800 | 397,600 |
| 16 | Cape Verde | 39% | 98,300 | 556,000 |
| 17 | Dominica | 39% | 13,600 | 72,000 |
| 18 | Vanuatu | 36% | 29,000 | 307,100 |
| 19 | Barbados | 33% | 44,900 | 287,400 |
| 20 | Cayman Islands | 33% | 12,300 | 65,700 |
| 21 | Jamaica | 33% | 406,100 | 2,961,000 |
| 22 | Montenegro | 33% | 66,900 | 628,100 |
| 23 | Georgia | 28% | 488,200 | 3,989,000 |
| 24 | Cambodia | 26% | 2,371,100 | 16,719,000 |
| 25 | Fiji | 26% | 90,700 | 896,400 |
| 26 | Croatia | 25% | 383,400 | 4,105,000 |
| 27 | Philippines | 24% | 10,237,700 | 109,600,000 |
| 28 | Sao Tome and Principe | 23% | 14,500 | 219,200 |
| 29 | Bermuda | 23% | 7,800 | 62,300 |
| 30 | Albania | 22% | 254,300 | 2,880,000 |
| 31 | Iceland | 22% | 44,100 | 341,200 |
| 32 | Greece | 22% | 846,200 | 10,420,000 |
| 33 | Thailand | 21% | 8,054,600 | 69,800,000 |
| 34 | Malta | 21% | 52,800 | 441,500 |
| 35 | New Zealand | 20% | 479,400 | 4,822,000 |
| 36 | Lebanon | 19% | 434,200 | 6,825,000 |
| 37 | Mauritius | 19% | 104,200 | 1,272,000 |
| 38 | Portugal | 19% | 902,400 | 10,197,000 |
| 39 | Kiribati | 18% | 6,600 | 119,000 |
| 40 | Gambia | 18% | 129,600 | 2,417,000 |
| 41 | Jordan | 18% | 254,700 | 10,200,000 |
| 42 | Dominican Republic | 17% | 810,800 | 10,848,000 |
| 43 | Uruguay | 16% | 262,500 | 3,474,000 |
| 44 | Namibia | 15% | 114,600 | 2,541,000 |
Croatia, another tourist hotspot, is hoping to reopen in time for peak season—the country generated tourism revenues of $13B in 2019. With a population of over 4 million, travel and tourism contributes to 25% of its workforce.
How the 20 Largest Economies Stack Up
Tourist-centric countries remain the hardest hit from global travel bans, but the world’s biggest economies are also feeling the impact.
In Spain, tourism ranks as the third highest contributor to its economy. If lockdowns remain in place until September, it is projected to lose $68 billion (€62 billion) in revenues.
| Rank | Country | Travel and Tourism, Contribution to GDP |
|---|---|---|
| 1 | Mexico | 15.5% |
| 2 | Spain | 14.3% |
| 3 | Italy | 13.0% |
| 4 | Turkey | 11.3% |
| 5 | China | 11.3% |
| 6 | Australia | 10.8% |
| 7 | Saudi Arabia | 9.5% |
| 8 | Germany | 9.1% |
| 9 | United Kingdom | 9.0% |
| 10 | U.S. | 8.6% |
| 11 | France | 8.5% |
| 12 | Brazil | 7.7% |
| 13 | Switzerland | 7.6% |
| 14 | Japan | 7.0% |
| 15 | India | 6.8% |
| 16 | Canada | 6.3% |
| 17 | Netherlands | 5.7% |
| 18 | Indonesia | 5.7% |
| 19 | Russia | 5.0% |
| 20 | South Korea | 2.8% |
On the other hand, South Korea is impacted the least: just 2.8% of its GDP is reliant on tourism.
Travel, Interrupted
Which countries earn the most from the travel and tourism industry in absolute dollar terms?
Topping the list was the U.S., with tourism contributing over $1.8 trillion to its economy, or 8.6% of its GDP in 2019. The U.S. remains a global epicenter for COVID-19 cases, and details remain unconfirmed if the country will reopen to visitors before summer.
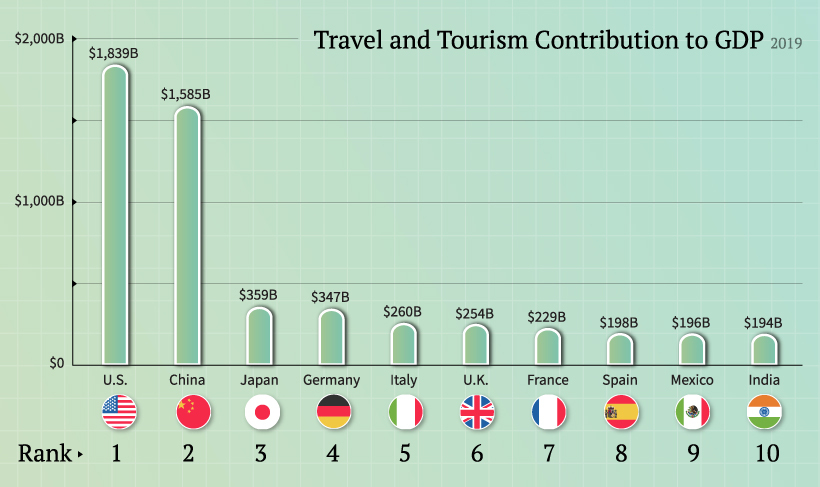
Meanwhile, the contribution of travel and tourism to China’s economy has more than doubled over the last decade, approaching $1.6 trillion. To help bolster economic activity, China and South Korea have eased restrictions by establishing a travel corridor.
As countries slowly reopen, other travel bubbles are beginning to make headway. For example, Estonia, Latvia, and Lithuania have eased travel restrictions by creating an established travel zone. Australia and New Zealand have a similar arrangement on the horizon. These travel bubbles allow citizens from each country to travel within a given zone.
Of course, COVID-19 will have a lasting impact on employment and global economic activity with inconceivable outcomes. When the dust finally settles, could global tourism face a reckoning?


Markets
Visualizing Global Inflation Forecasts (2024-2026)
Here are IMF forecasts for global inflation rates up to 2026, highlighting a slow descent of price pressures amid resilient global growth.


Visualizing Global Inflation Forecasts (2024-2026)
Global inflation rates are gradually descending, but progress has been slow.
Today, the big question is if inflation will decline far enough to trigger easing monetary policy. So far, the Federal Reserve has held rates for nine months amid stronger than expected core inflation, which excludes volatile energy and food prices.
Yet looking further ahead, inflation forecasts from the International Monetary Fund (IMF) suggest that inflation will decline as price pressures ease, but the path of disinflation is not without its unknown risks.
This graphic shows global inflation forecasts, based on data from the April 2024 IMF World Economic Outlook.
Get the Key Insights of the IMF’s World Economic Outlook
Want a visual breakdown of the insights from the IMF’s 2024 World Economic Outlook report?
This visual is part of a special dispatch of the key takeaways exclusively for VC+ members.
Get the full dispatch of charts by signing up to VC+.
The IMF’s Inflation Outlook
Below, we show the IMF’s latest projections for global inflation rates through to 2026:
| Year | Global Inflation Rate (%) | Advanced Economies Inflation Rate (%) | Emerging Market and Developing Economies Inflation Rate (%) |
|---|---|---|---|
| 2019 | 3.5 | 1.4 | 5.1 |
| 2020 | 3.2 | 0.7 | 5.2 |
| 2021 | 4.7 | 3.1 | 5.9 |
| 2022 | 8.7 | 7.3 | 9.8 |
| 2023 | 6.8 | 4.6 | 8.3 |
| 2024 | 5.9 | 2.6 | 8.3 |
| 2025 | 4.5 | 2.0 | 6.2 |
| 2026 | 3.7 | 2.0 | 4.9 |
After hitting a peak of 8.7% in 2022, global inflation is projected to fall to 5.9% in 2024, reflecting promising inflation trends amid resilient global growth.
While inflation has largely declined due to falling energy and goods prices, persistently high services inflation poses challenges to mitigating price pressures. In addition, the IMF highlights the potential risk of an escalating conflict in the Middle East, which could lead to energy price shocks and higher shipping costs.
These developments could negatively affect inflation scenarios and prompt central banks to adopt tighter monetary policies. Overall, by 2026, global inflation is anticipated to decline to 3.7%—still notably above the 2% target set by several major economies.
Adding to this, we can see divergences in the path of inflation between advanced and emerging economies. While affluent nations are forecast to see inflation edge closer to the 2% target by 2026, emerging economies are projected to have inflation rates reach 4.9%—falling closer to their pre-pandemic averages.
Get the Full Analysis of the IMF’s Outlook on VC+
This visual is part of an exclusive special dispatch for VC+ members which breaks down the key takeaways from the IMF’s 2024 World Economic Outlook.
For the full set of charts and analysis, sign up for VC+.

-

 Business6 days ago
The Top Private Equity Firms by Country
-

 Countries2 weeks ago
Countries With the Largest Happiness Gains Since 2010
-

 VC+2 weeks ago
VC+: Get Our Key Takeaways From the IMF’s World Economic Outlook
-

 Demographics2 weeks ago
The Countries That Have Become Sadder Since 2010
-

 Money2 weeks ago
Charted: Who Has Savings in This Economy?
-

 Technology2 weeks ago
Visualizing AI Patents by Country
-

 Economy2 weeks ago
Economic Growth Forecasts for G7 and BRICS Countries in 2024
-

 Wealth1 week ago
Charted: Which City Has the Most Billionaires in 2024?