Markets
Comparing the Speed of U.S. Interest Rate Hikes (1988-2022)
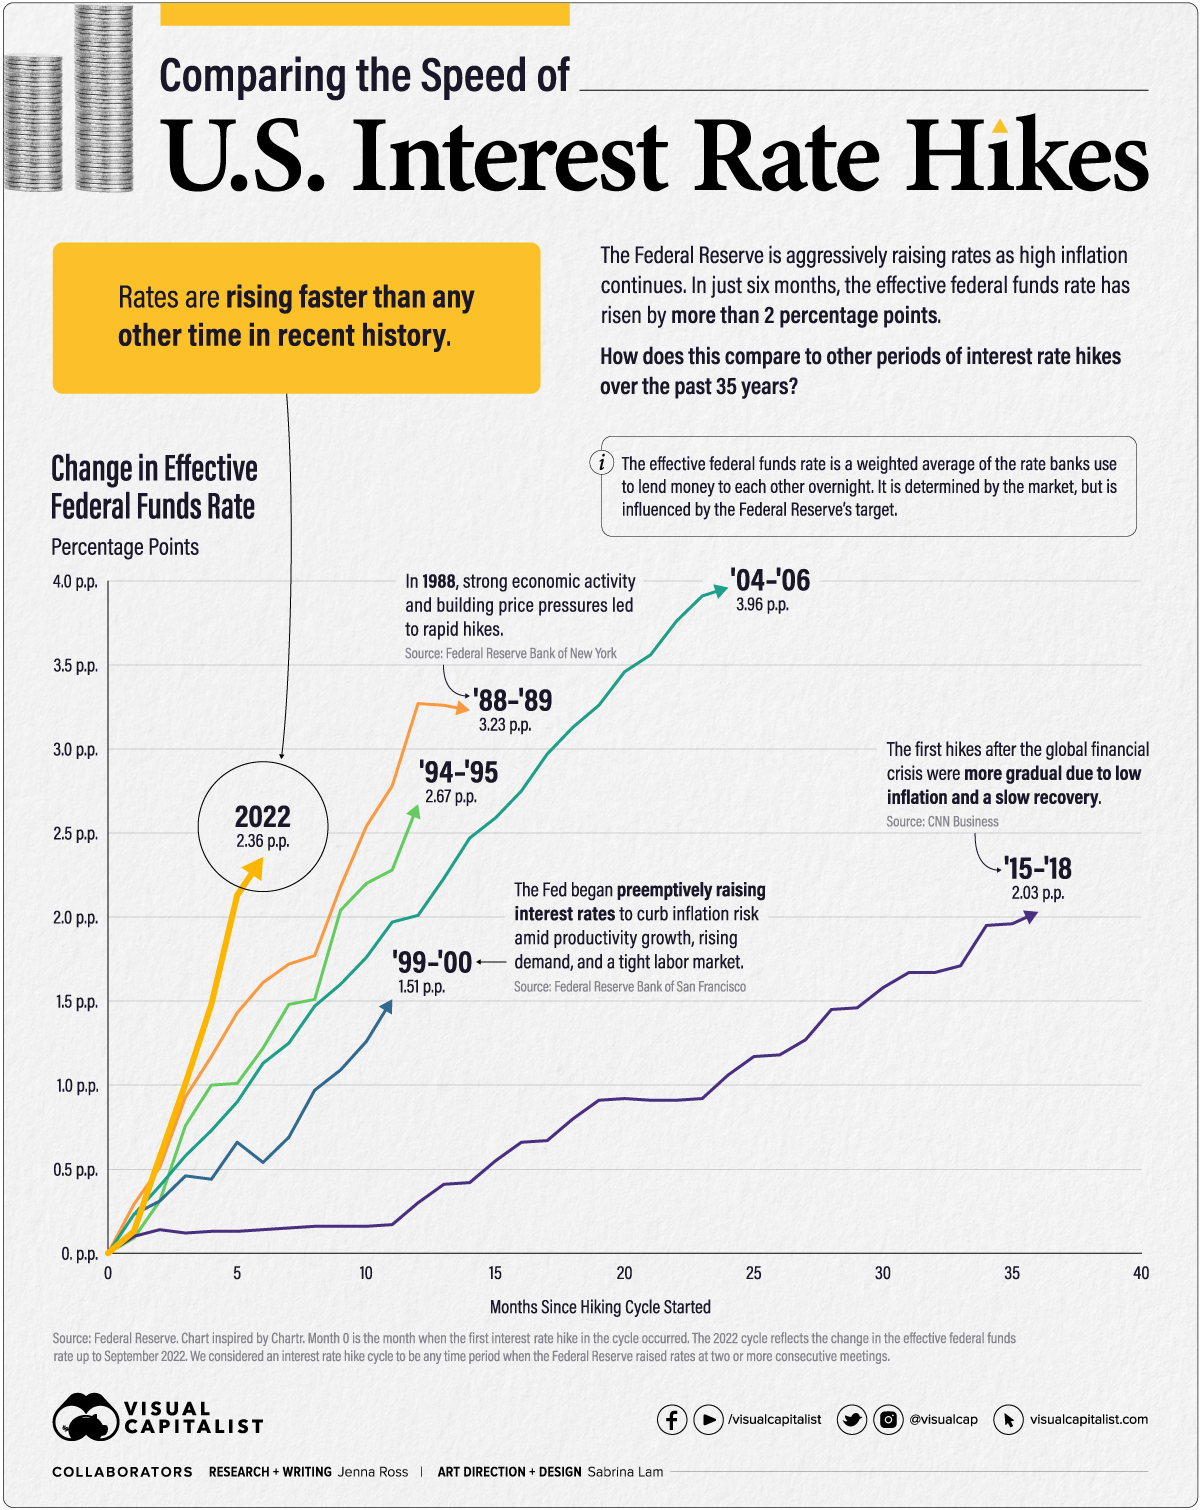


Comparing the Speed of U.S. Interest Rate Hikes
As U.S. inflation remains at multi-decade highs, the Federal Reserve has been aggressive with its interest rate hikes. In fact, rates have risen more than two percentage points in just six months.
In this graphic—which was inspired by a chart from Chartr—we compare the speed and severity of the current interest rate hikes to other periods of monetary tightening over the past 35 years.
Measuring Periods of Interest Rate Hikes
We used the effective federal funds rate (EFFR), which measures the weighted average of the rates that banks use to lend to each other overnight. It is determined by the market but influenced by the Fed’s target range. We considered the starting point for each cycle to be the EFFR during the month when the first rate hike took place.
Here is the duration and severity of each interest rate hike cycle since 1988.
| Time Period | Duration (Months) | Total Change in EFFR (Percentage Points) |
|---|---|---|
| Mar 1988 - May 1989 | 14 | 3.23 |
| Feb 1994 - Feb 1995 | 12 | 2.67 |
| Jun 1999 - May 2000 | 11 | 1.51 |
| Jun 2004 - Jun 2006 | 24 | 3.96 |
| Dec 2015 - Dec 2018 | 36 | 2.03 |
| Mar 2022 - Sep 2022 | 6 | 2.36 |
* We considered a rate hike cycle to be any time period when the Federal Reserve raised rates at two or more consecutive meetings. The 2022 rate hike cycle is ongoing with data as of September 2022.
The 2022 rate hike cycle is the fastest, reaching a 2.36 percentage point increase nearly twice as fast as the rate hike cycle of ‘88-‘89.
On the other hand, the most severe interest rate hikes occurred in the ‘04 – ‘06 cycle when the EFFR climbed by almost four percentage points. It took much longer to reach this level, however, with the hikes taking place over two years.
Timing Interest Rate Hikes
Why are 2022’s interest rate hikes so rapid? U.S. inflation far exceeds the Fed’s long-term target of 2%. In fact, when the hikes started in March 2022, inflation was the highest it’s ever been in the last six rate hike cycles.
| Time Period | Inflation Rate at Start of Cycle |
|---|---|
| Mar 1988 - May 1989 | 3.60% |
| Feb 1994 - Feb 1995 | 2.06% |
| Jun 1999 - May 2000 | 1.40% |
| Jun 2004 - Jun 2006 | 2.89% |
| Dec 2015 - Dec 2018 | 0.30% |
| Mar 2022 - Sep 2022 | 6.77% |
Inflation rate is the year-over-year change as measured by the Personal Consumption Expenditures (PCE) Index.
In contrast, three of the rate hike cycles started with inflation at or below the 2% target. Inflation was just 0.30% in December 2015 when the Fed announced its first rate hike since the global financial crisis.
Some criticized the Fed for raising rates prematurely, but the Fed’s rationale was that it can take up to three years or more for policy actions to affect economic conditions. By raising rates early and gradually, the Fed hoped to avoid surging inflation in the future.
Fast forward to today, and the picture couldn’t look more different. Inflation exceeded the 2% target for 12 months before the Fed began to raise rates. Initially, the Fed believed inflation was “transitory” or short-lived. Now, inflation is a top financial concern and there is a risk that it has gathered enough momentum that it will be difficult to bring down.
Balancing Inflation and Recession Risks
The Fed expects to raise its target rate to around 4.4% by the end of 2022, up from the current range of 3-3.25%. However, they don’t foresee inflation reaching their 2% target until 2025.
In the meantime, the rapid interest rate hikes could lead to an economic downturn. Risks of a global recession have increased as other central banks raise their rates too. The World Bank offers policymakers a number of suggestions to help avoid a recession:
- Central banks can communicate policy decisions clearly to secure inflation expectations and, hopefully, reduce how much they need to raise rates.
- Governments can carefully withdraw fiscal support, develop medium-term spending and tax policies, and provide targeted help to vulnerable households.
- Other economic policymakers can help relieve supply pressures through various measures. For instance, they can introduce policies to increase labor force participation, enhance global trade networks, and bring in measures to reduce energy consumption.
Will policymakers heed this advice and, if so, will it prove sufficient to avoid a global recession?


Markets
Visualizing Global Inflation Forecasts (2024-2026)
Here are IMF forecasts for global inflation rates up to 2026, highlighting a slow descent of price pressures amid resilient global growth.


Visualizing Global Inflation Forecasts (2024-2026)
Global inflation rates are gradually descending, but progress has been slow.
Today, the big question is if inflation will decline far enough to trigger easing monetary policy. So far, the Federal Reserve has held rates for nine months amid stronger than expected core inflation, which excludes volatile energy and food prices.
Yet looking further ahead, inflation forecasts from the International Monetary Fund (IMF) suggest that inflation will decline as price pressures ease, but the path of disinflation is not without its unknown risks.
This graphic shows global inflation forecasts, based on data from the April 2024 IMF World Economic Outlook.
Get the Key Insights of the IMF’s World Economic Outlook
Want a visual breakdown of the insights from the IMF’s 2024 World Economic Outlook report?
This visual is part of a special dispatch of the key takeaways exclusively for VC+ members.
Get the full dispatch of charts by signing up to VC+.
The IMF’s Inflation Outlook
Below, we show the IMF’s latest projections for global inflation rates through to 2026:
| Year | Global Inflation Rate (%) | Advanced Economies Inflation Rate (%) | Emerging Market and Developing Economies Inflation Rate (%) |
|---|---|---|---|
| 2019 | 3.5 | 1.4 | 5.1 |
| 2020 | 3.2 | 0.7 | 5.2 |
| 2021 | 4.7 | 3.1 | 5.9 |
| 2022 | 8.7 | 7.3 | 9.8 |
| 2023 | 6.8 | 4.6 | 8.3 |
| 2024 | 5.9 | 2.6 | 8.3 |
| 2025 | 4.5 | 2.0 | 6.2 |
| 2026 | 3.7 | 2.0 | 4.9 |
After hitting a peak of 8.7% in 2022, global inflation is projected to fall to 5.9% in 2024, reflecting promising inflation trends amid resilient global growth.
While inflation has largely declined due to falling energy and goods prices, persistently high services inflation poses challenges to mitigating price pressures. In addition, the IMF highlights the potential risk of an escalating conflict in the Middle East, which could lead to energy price shocks and higher shipping costs.
These developments could negatively affect inflation scenarios and prompt central banks to adopt tighter monetary policies. Overall, by 2026, global inflation is anticipated to decline to 3.7%—still notably above the 2% target set by several major economies.
Adding to this, we can see divergences in the path of inflation between advanced and emerging economies. While affluent nations are forecast to see inflation edge closer to the 2% target by 2026, emerging economies are projected to have inflation rates reach 4.9%—falling closer to their pre-pandemic averages.
Get the Full Analysis of the IMF’s Outlook on VC+
This visual is part of an exclusive special dispatch for VC+ members which breaks down the key takeaways from the IMF’s 2024 World Economic Outlook.
For the full set of charts and analysis, sign up for VC+.

-

 Business6 days ago
The Top Private Equity Firms by Country
-

 Countries2 weeks ago
Countries With the Largest Happiness Gains Since 2010
-

 Economy2 weeks ago
VC+: Get Our Key Takeaways From the IMF’s World Economic Outlook
-

 Demographics2 weeks ago
The Countries That Have Become Sadder Since 2010
-

 Money2 weeks ago
Charted: Who Has Savings in This Economy?
-

 Technology2 weeks ago
Visualizing AI Patents by Country
-

 Economy2 weeks ago
Economic Growth Forecasts for G7 and BRICS Countries in 2024
-

 Wealth1 week ago
Charted: Which City Has the Most Billionaires in 2024?