Misc
Chart-Toppers: 50 Years of the Best-Selling Music Artists
Chart-Toppers: 50 Years of the Best-Selling Music Artists
Fame, fortune, and adoring fans—this is often the dream-turned-reality for the world’s most popular music artists.
Thanks to their relatability and creative prowess, these artists have not only boasted longevity in their record sales, but they’ve also dominated the charts year after year.
Today’s video from Data is Beautiful visualizes the world’s best-selling music artists from the past 50 years (1969 to 2019) and highlights the length of their reigns.
Do you see your favorite artist or group in the mix?
The Best Selling Artists, By Decade
Of all of the artists in the past half-century, two stand out: Michael Jackson and Eminem. Michael Jackson has the highest cumulative number of years in the top spot (~12 years), while Eminem holds the longest continuous best-selling artist slot (8.5 years).
Let’s dive into each decade to uncover defining moments and key technology advancements that pushed the art of music into exciting new areas.
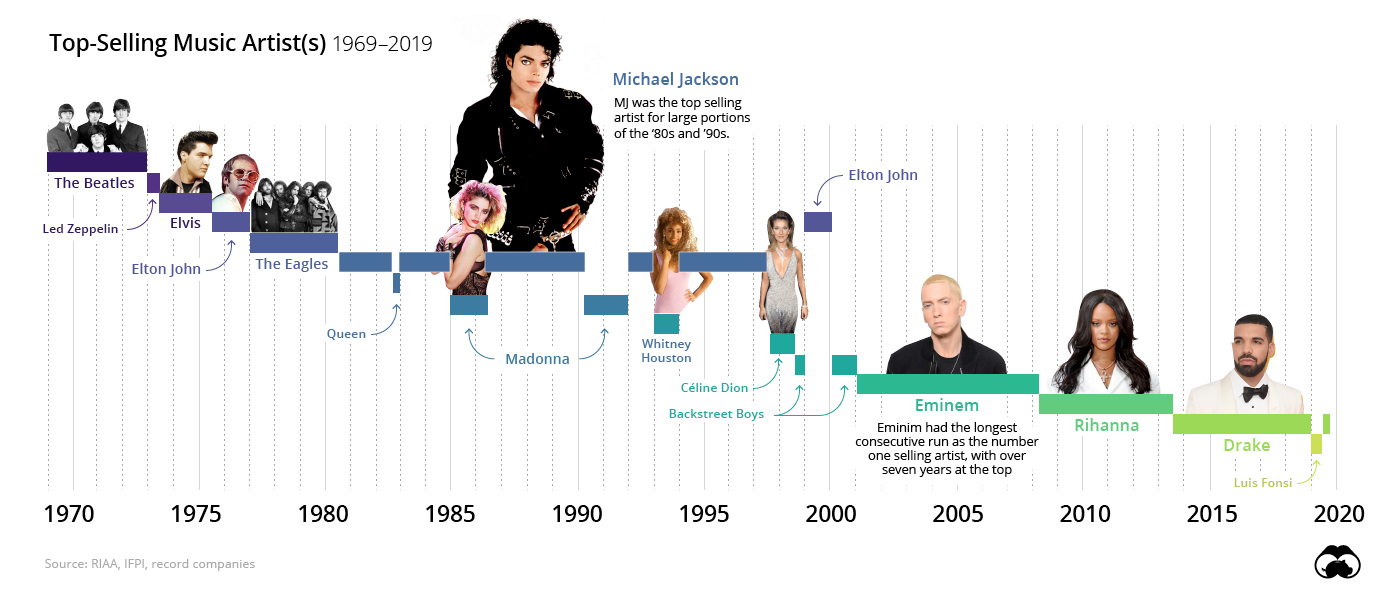
1970s
This era of music is defined by the emergence of the rock genre, with artists like The Eagles and Led Zeppelin, the latter of which is widely considered a forefather of hard rock and heavy metal.
The Beatles became known, not just for their music, but for pushing the envelope with how they recorded their music. They used analog sound editing techniques—utilizing a sound effect “bank” to record overtop finished music tracks to add depth and texture. This left a huge mark on the music world, and in many ways influenced how modern music is recorded.
The introduction of 8-tracks and cassette tapes enabled people to play albums in their vehicles, opening up new possibilities for on-the-go entertainment.
1980s
Enter the age of electronic music—synthesizers, theremins, electronic samplers, and electronic drum kits popped up in the music scene, most predominantly in the United Kingdom and the United States. The German-based group Kraftwerk was one of the first to pioneer using a synthesizer in their sets.
For example, one of the reasons for Michael Jackson’s success was that the technology of the time allowed for much wider distribution at much lower costs. In addition, Thriller was one of the first albums recorded on compact discs (CDs), which were introduced in 1982.
The MTV era (launched 1981) also significantly impacted the sales of albums, as music now offered both visual and audio experiences—and broadcast directly into people’s homes.
1990s
A predominant factor of the 90s music scene was the explosion of popular music artists being commissioned to record the theme songs for blockbuster films.
The most notable artists and their corresponding blockbuster movies of the time include:
- Elton John ─ The Lion King
- Celine Dion ─ Titanic
- Whitney Houston ─ Bodyguard
- Bryan Adams ─ Robin Hood: Prince Of Thieves
- Madonna ─ Evita
While the 1990s marked a decade of great variety in top-selling artists, it was also the peak of the music industry’s sales, at a whopping $21.5 billion in 1999—a figure not since repeated.
2000s
Eminem dominated 2000s record sales, but the decade also featured brief stints from the Backstreet Boys in 2000 and Rihanna in 2009.
Eminem helped to launch hip hop music into the mainstream. Being one of the most controversial best-selling artists of all time, he pushed genre boundaries through his technical prowess, wordsmithing, and relatability to wider audiences.
The 21st century also brought music streaming services such as Spotify to the forefront, forever altering how people listen to their favorite artists and bands.
2010s
Only three artists have hit the best-selling artist spot in the current decade: Rihanna, Drake, and Luis Fonsi—the Puerto Rican singer most well known for his hit single “Despacito”.
In 2016, the Recording Industry Association of America (RIAA) certified that Drake was the first music artist ever to reach #1 through streaming platform sales and downloads, instead of through physical album sales.
According to RIAA, streaming revenues jumped from almost half of all music industry sales in 2017, to over 75% of sales in 2018—with $4.6 billion in total record sales as of Q1 2018.
The Future Of Music
Musicians are a creative breed, continuously experimenting with new instruments, sound effects, and recording styles.
Some artists are even going so far as use only an iPhone to record their work—showcasing the modern-era ability to record high-fidelity quality and achieve studio-like results.
With a new decade just around the corner, we may see even more possibilities for technology to revamp how we access our favorite tunes—and how artists distribute them to their fanbase.
Who might become the next Beatles, Michael Jackson, or Drake?


VC+
VC+: Get Our Key Takeaways From the IMF’s World Economic Outlook
A sneak preview of the exclusive VC+ Special Dispatch—your shortcut to understanding IMF’s World Economic Outlook report.

Have you read IMF’s latest World Economic Outlook yet? At a daunting 202 pages, we don’t blame you if it’s still on your to-do list.
But don’t worry, you don’t need to read the whole April release, because we’ve already done the hard work for you.
To save you time and effort, the Visual Capitalist team has compiled a visual analysis of everything you need to know from the report—and our VC+ Special Dispatch is available exclusively to VC+ members. All you need to do is log into the VC+ Archive.
If you’re not already subscribed to VC+, make sure you sign up now to access the full analysis of the IMF report, and more (we release similar deep dives every week).
For now, here’s what VC+ members get to see.
Your Shortcut to Understanding IMF’s World Economic Outlook
With long and short-term growth prospects declining for many countries around the world, this Special Dispatch offers a visual analysis of the key figures and takeaways from the IMF’s report including:
- The global decline in economic growth forecasts
- Real GDP growth and inflation forecasts for major nations in 2024
- When interest rate cuts will happen and interest rate forecasts
- How debt-to-GDP ratios have changed since 2000
- And much more!

Get the Full Breakdown in the Next VC+ Special Dispatch
VC+ members can access the full Special Dispatch by logging into the VC+ Archive, where you can also check out previous releases.
Make sure you join VC+ now to see exclusive charts and the full analysis of key takeaways from IMF’s World Economic Outlook.
Don’t miss out. Become a VC+ member today.
What You Get When You Become a VC+ Member
VC+ is Visual Capitalist’s premium subscription. As a member, you’ll get the following:
- Special Dispatches: Deep dive visual briefings on crucial reports and global trends
- Markets This Month: A snappy summary of the state of the markets and what to look out for
- The Trendline: Weekly curation of the best visualizations from across the globe
- Global Forecast Series: Our flagship annual report that covers everything you need to know related to the economy, markets, geopolitics, and the latest tech trends
- VC+ Archive: Hundreds of previously released VC+ briefings and reports that you’ve been missing out on, all in one dedicated hub
You can get all of the above, and more, by joining VC+ today.

-

 Mining1 week ago
Gold vs. S&P 500: Which Has Grown More Over Five Years?
-

 Markets2 weeks ago
Ranked: The Most Valuable Housing Markets in America
-

 Money2 weeks ago
Which States Have the Highest Minimum Wage in America?
-

 AI2 weeks ago
Ranked: Semiconductor Companies by Industry Revenue Share
-

 Markets2 weeks ago
Ranked: The World’s Top Flight Routes, by Revenue
-

 Countries2 weeks ago
Population Projections: The World’s 6 Largest Countries in 2075
-

 Markets2 weeks ago
The Top 10 States by Real GDP Growth in 2023
-

 Demographics2 weeks ago
The Smallest Gender Wage Gaps in OECD Countries