Technology
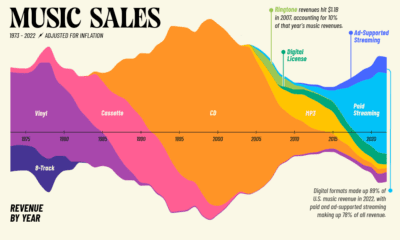
Visualizing 40 Years of Music Industry Sales
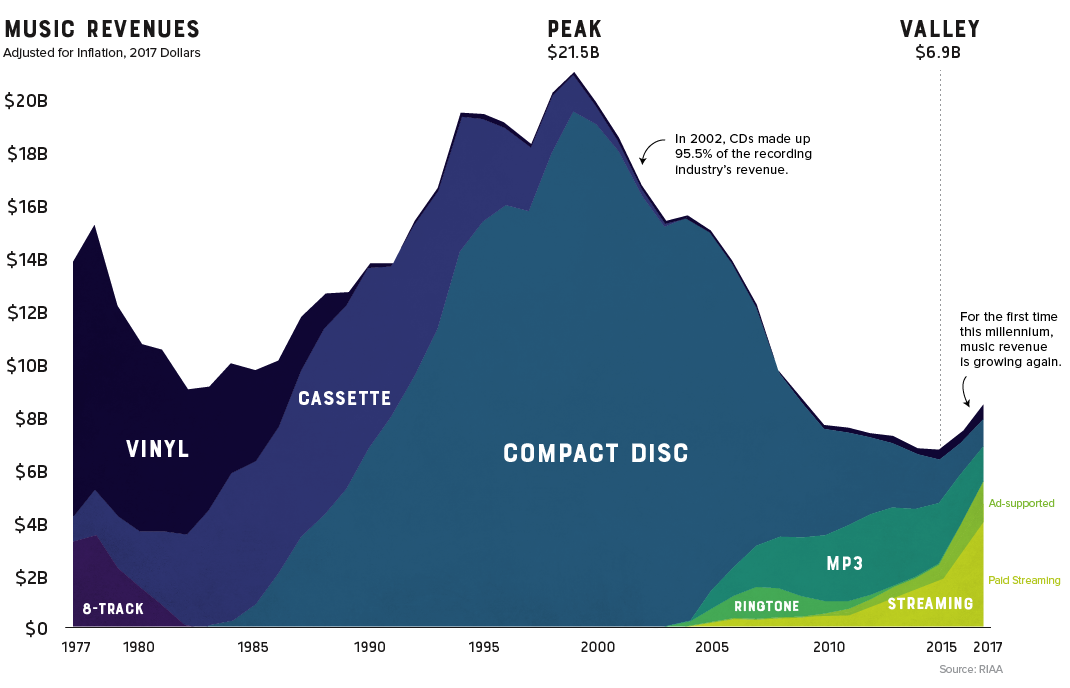
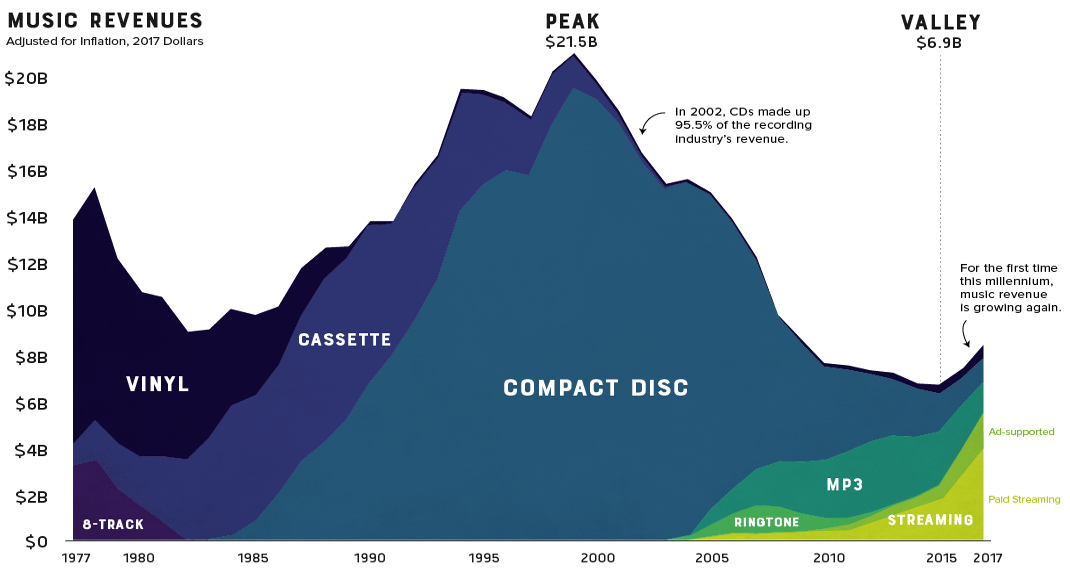
40 Years of Music Industry Sales
The record industry has seen a lot of change over the years.
8-tracks took a short-lived run at the dominance of vinyl, cassettes faded away as compact discs took the world by storm, and through it all, the music industry saw its revenue continue to climb. That is, until it was digitally disrupted.
Looking back at four decades of U.S. music industry sales data is a fascinating exercise as it charts not only the rise and fall the record company profits, but seismic shifts in technology and consumer behavior as well.
The Long Fade Out
For people of a certain age group, early memories of acquiring new music are inexorably linked to piracy. Going to the store and purchasing a $20 disc wasn’t even a part of the thought process. Napster, the first widely used P2P service, figuratively skipped the needle off the record and ended years of impressive profitability in the recording industry.
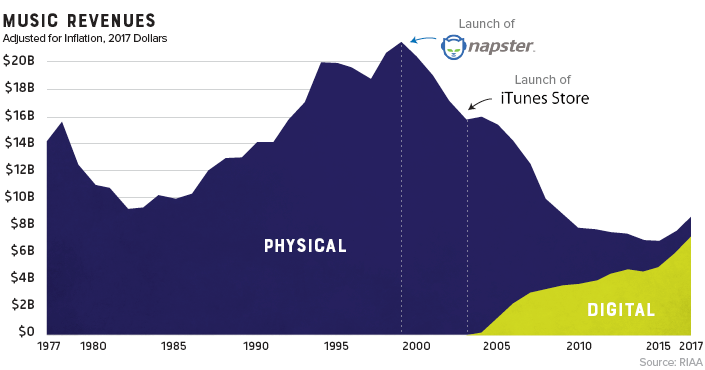
Napster was shut down in 2002, but the genie was already out of the bottle. Piracy’s effect on the industry was immediate and stark. Music industry sales, which had been experiencing impressive year-over-year growth, began a decline that would continue for 15 years.
The Ringtone Era
While acquiring music was as easy opening Limewire on your desktop computer, transferring that new T-Pain track to a flip-phone wasn’t a seamless experience.
This brief gap in technology – before smartphones hit mass adoption – brought us the ringtone era. Distribution was controlled by mobile carriers, so ringtones were a comfortable gateway for the record industry to get a taste for digital-based revenue. In 2008 alone, they injected over a billion dollars of revenue into an industry that was getting used to gloomy forecasts.
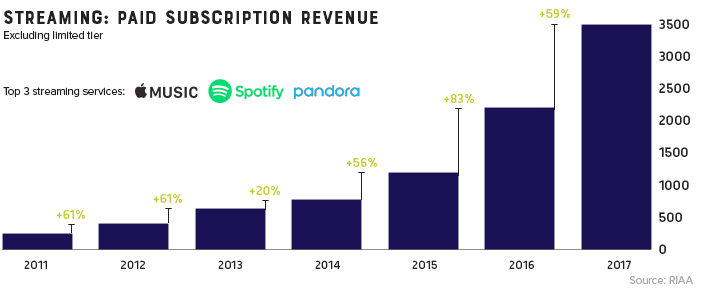
Paddling Upstream
Though services like Spotify and Pandora haven’t replaced the money pipeline that CD sales provided, they have reversed the industry’s tailspin. For the first time this millennium, record industry posted an increase in revenue for two consecutive years (and likely a third in 2018).
It took a while for consumers to warm up to paying for a premium music subscription, but today, there’s a solid basis for optimism. Music streaming is now the most common format for music in the United States, and the RIAA reports that streaming now makes up nearly half of the market.
The End of Physical Format?
Gone are the days when people would line up at the music shop for a hot new release. In fact, CD sales are down 80% in the past decade. Today, physical format sales only account for 17% of the industry’s revenue.
There is, however, one bright spot in physical format segment: vinyl. In 2017, vinyl sales hit 25-year high after making a slow and steady comeback.
Vinyl is written in stone. I think if it’s made it for 120 years now, it’s here forever.
– Jack White


Technology
All of the Grants Given by the U.S. CHIPS Act
Intel, TSMC, and more have received billions in subsidies from the U.S. CHIPS Act in 2024.


All of the Grants Given by the U.S. CHIPS Act
This was originally posted on our Voronoi app. Download the app for free on iOS or Android and discover incredible data-driven charts from a variety of trusted sources.
This visualization shows which companies are receiving grants from the U.S. CHIPS Act, as of April 25, 2024. The CHIPS Act is a federal statute signed into law by President Joe Biden that authorizes $280 billion in new funding to boost domestic research and manufacturing of semiconductors.
The grant amounts visualized in this graphic are intended to accelerate the production of semiconductor fabrication plants (fabs) across the United States.
Data and Company Highlights
The figures we used to create this graphic were collected from a variety of public news sources. The Semiconductor Industry Association (SIA) also maintains a tracker for CHIPS Act recipients, though at the time of writing it does not have the latest details for Micron.
| Company | Federal Grant Amount | Anticipated Investment From Company |
|---|---|---|
| 🇺🇸 Intel | $8,500,000,000 | $100,000,000,000 |
| 🇹🇼 TSMC | $6,600,000,000 | $65,000,000,000 |
| 🇰🇷 Samsung | $6,400,000,000 | $45,000,000,000 |
| 🇺🇸 Micron | $6,100,000,000 | $50,000,000,000 |
| 🇺🇸 GlobalFoundries | $1,500,000,000 | $12,000,000,000 |
| 🇺🇸 Microchip | $162,000,000 | N/A |
| 🇬🇧 BAE Systems | $35,000,000 | N/A |
BAE Systems was not included in the graphic due to size limitations
Intel’s Massive Plans
Intel is receiving the largest share of the pie, with $8.5 billion in grants (plus an additional $11 billion in government loans). This grant accounts for 22% of the CHIPS Act’s total subsidies for chip production.
From Intel’s side, the company is expected to invest $100 billion to construct new fabs in Arizona and Ohio, while modernizing and/or expanding existing fabs in Oregon and New Mexico. Intel could also claim another $25 billion in credits through the U.S. Treasury Department’s Investment Tax Credit.
TSMC Expands its U.S. Presence
TSMC, the world’s largest semiconductor foundry company, is receiving a hefty $6.6 billion to construct a new chip plant with three fabs in Arizona. The Taiwanese chipmaker is expected to invest $65 billion into the project.
The plant’s first fab will be up and running in the first half of 2025, leveraging 4 nm (nanometer) technology. According to TrendForce, the other fabs will produce chips on more advanced 3 nm and 2 nm processes.
The Latest Grant Goes to Micron
Micron, the only U.S.-based manufacturer of memory chips, is set to receive $6.1 billion in grants to support its plans of investing $50 billion through 2030. This investment will be used to construct new fabs in Idaho and New York.

-

 Debt1 week ago
How Debt-to-GDP Ratios Have Changed Since 2000
-

 Markets2 weeks ago
Ranked: The World’s Top Flight Routes, by Revenue
-

 Countries2 weeks ago
Population Projections: The World’s 6 Largest Countries in 2075
-

 Markets2 weeks ago
The Top 10 States by Real GDP Growth in 2023
-

 Demographics2 weeks ago
The Smallest Gender Wage Gaps in OECD Countries
-

 United States2 weeks ago
Where U.S. Inflation Hit the Hardest in March 2024
-

 Green2 weeks ago
Top Countries By Forest Growth Since 2001
-

 United States2 weeks ago
Ranked: The Largest U.S. Corporations by Number of Employees