Markets
Ranked: Top TV Advertising Spenders in 2023
The Top TV Advertising Spenders in 2023
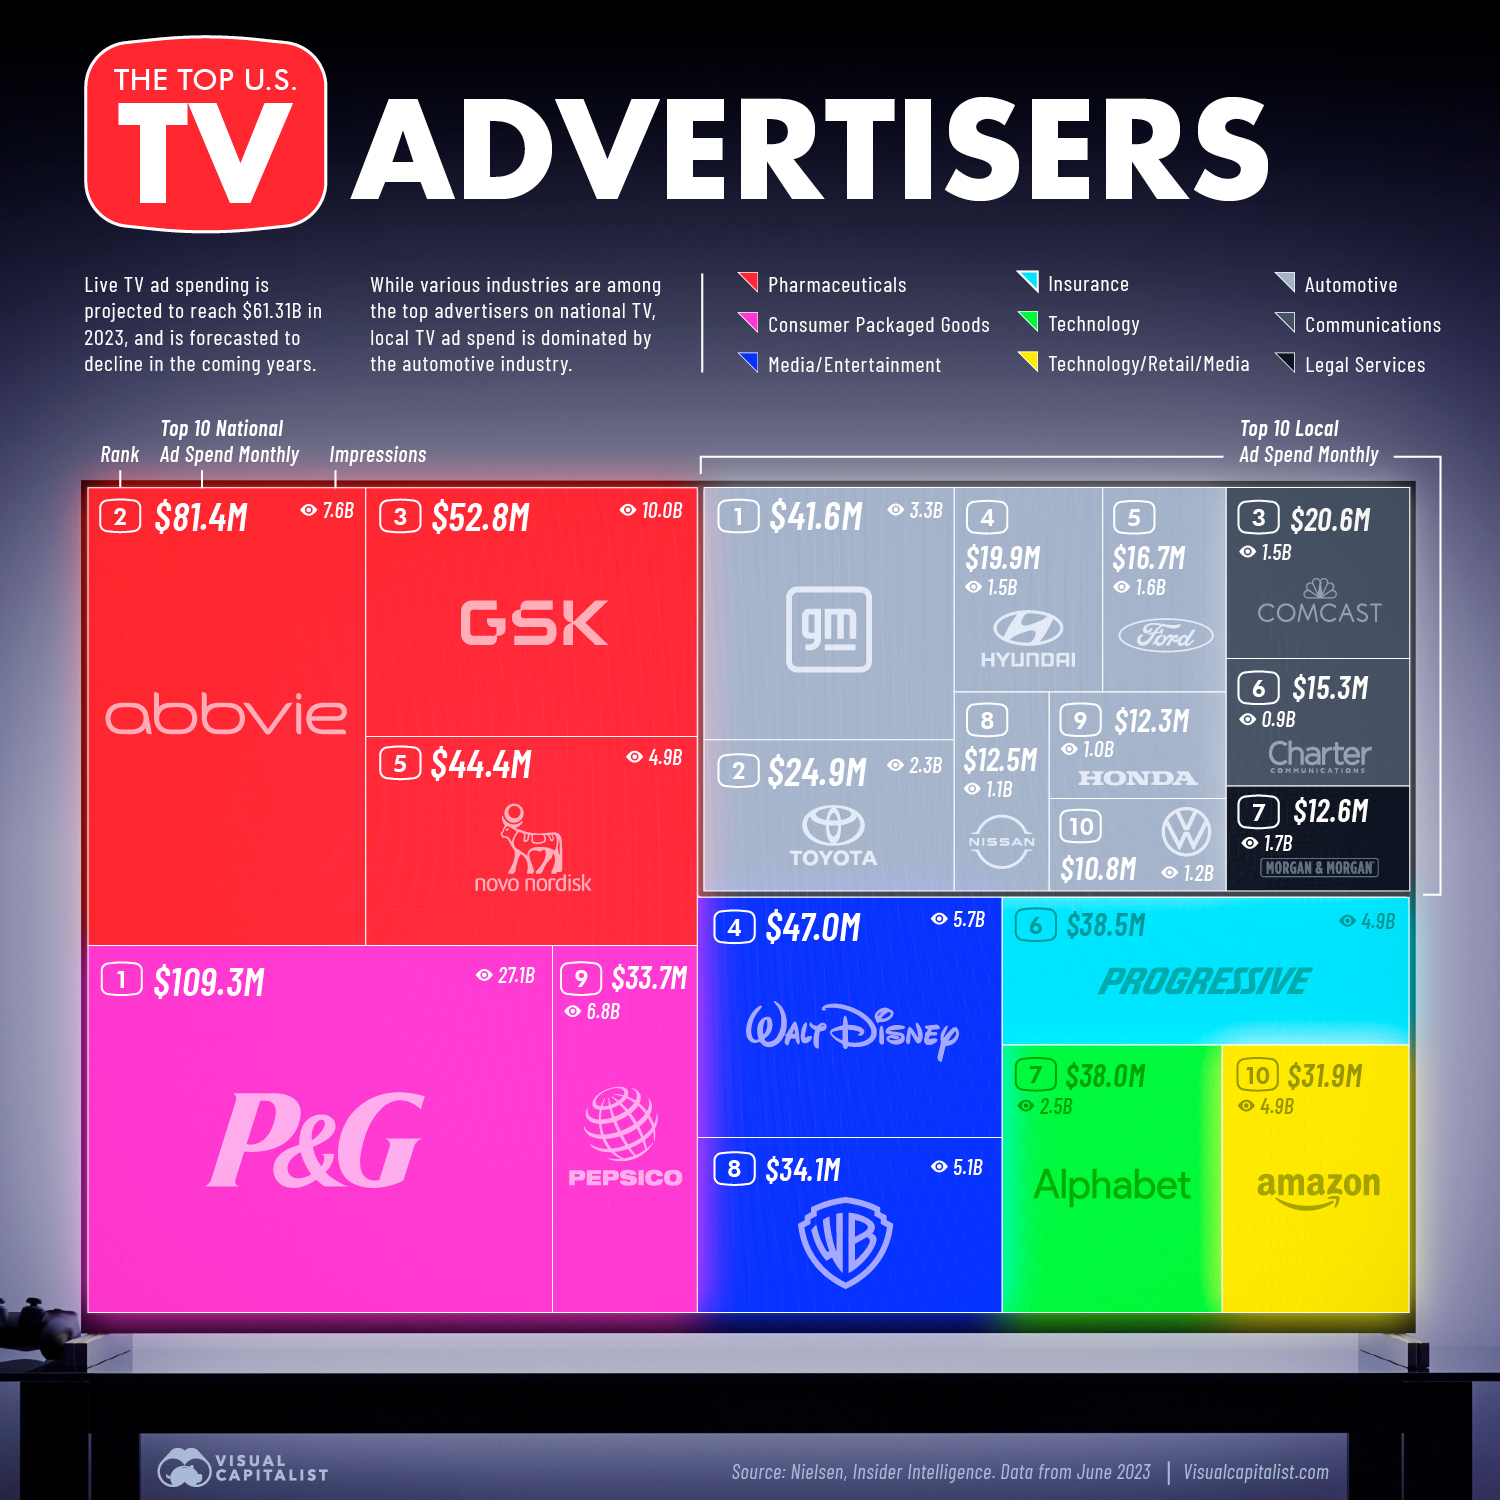
In 2023, advertising spend is projected to reach $61.3 billion on U.S. broadcast and cable TV.
Despite declining viewership, traditional TV has been found to be an optimal platform for storytelling ads. Additionally, advertisers can target viewer segments on traditional TV—similar to digital marketing channels.
The above graphic shows the top advertisers on traditional TV outlets, based on data from Nielsen.
Top 10 National TV Advertising Spenders
Here are the top advertisers on national U.S. broadcast and cable TV for the month of June 2023:
| Rank | Parent Company | Industry | Ad Spending June 2023 | Impressions |
|---|---|---|---|---|
| 1 | Procter & Gamble | Consumer Packaged Goods | $109.3M | 27.1B |
| 2 | Abbvie | Pharmaceuticals | $81.4M | 7.6B |
| 3 | GSK | Pharmaceuticals | $52.8M | 10.0B |
| 4 | Walt Disney | Media / Entertainment | $47.0M | 5.7B |
| 5 | Novo Nordisk | Pharmaceuticals | $44.4M | 4.9B |
| 6 | Progressive | Insurance | $38.5M | 4.9B |
| 7 | Alphabet | Technology | $38.0M | 2.5B |
| 8 | Warner Bros. Discovery | Media / Entertainment | $34.1M | 5.1B |
| 9 | Pepsico | Consumer Packaged Goods | $33.7M | 6.8B |
| 10 | Amazon | Technology / Retail / Media | $31.9M | 4.9B |
Procter & Gamble was the top TV advertising spender in the U.S., at $109.3 million. Home to Gillette, Crest, and Tide, the company spent a stunning $5.1 billion in overall advertising in 2022.
Pharmaceutical companies Abbvie and GSK were the next biggest spenders, at $81.4 million and $52.8 million, respectively. Overall, pharmaceuticals accounted for the largest share of advertising across the top 10.
Big tech companies Alphabet and Amazon also made the list, each spending over $30 million in June alone.
Top 10 Local TV Advertising Spenders
By contrast, the automotive sector made up seven of the top 10 local broadcast and cable TV advertisers, led by General Motors and Toyota:
| Rank | Parent Company | Industry | Ad Spending June 2023 | Impressions |
|---|---|---|---|---|
| 1 | General Motors | Automotive | $41.6M | 3.3B |
| 2 | Toyota | Automotive | $24.9M | 2.3B |
| 3 | Comcast | Communications | $20.6M | 1.5B |
| 4 | Hyundai | Automotive | $19.9M | 1.5B |
| 5 | Ford Motor | Automotive | $16.7M | 1.6B |
| 6 | Charter | Communications | $15.3M | 0.9B |
| 7 | Morgan & Morgan | Legal Services | $12.6M | 1.7B |
| 8 | Nissan | Automotive | $12.5M | 1.1B |
| 9 | Honda | Automotive | $12.3M | 1.0B |
| 10 | Volkswagen | Automotive | $10.8M | 1.2B |
Meanwhile, communication giants Comcast and Charter were big spenders, and the nation’s largest personal injury law firm, Morgan & Morgan, ranked in seventh overall.
U.S. Television Trends
Today, live TV viewership in the U.S. is primarily made up of those aged 65 and over, which spend nearly five hours per day watching TV. In contrast, those aged 25-34 spend only about one hour and 12 minutes per day watching live TV.
Furthermore, in 2022, fewer than half of U.S. viewers paid for traditional TV services for the first time. By year-end 2027, this proportion is projected to fall to just over a third of households.
Yet due to its scale of available media inventory, traditional TV may continue to bring in the bulk of TV advertising spending over the near future. One reason is that advertising makes up 20% of time spent on traditional TV but just 3% on streaming platforms.
However, as viewership declines, advertisers on live TV say that they are most likely to allocate their ad spend to streaming services. By year-end 2027, ad spend on streaming platforms is projected to jump to $40.9 billion, a 63% increase from 2023.


Markets
The European Stock Market: Attractive Valuations Offer Opportunities
On average, the European stock market has valuations that are nearly 50% lower than U.S. valuations. But how can you access the market?


European Stock Market: Attractive Valuations Offer Opportunities
Europe is known for some established brands, from L’Oréal to Louis Vuitton. However, the European stock market offers additional opportunities that may be lesser known.
The above infographic, sponsored by STOXX, outlines why investors may want to consider European stocks.
Attractive Valuations
Compared to most North American and Asian markets, European stocks offer lower or comparable valuations.
| Index | Price-to-Earnings Ratio | Price-to-Book Ratio |
|---|---|---|
| EURO STOXX 50 | 14.9 | 2.2 |
| STOXX Europe 600 | 14.4 | 2 |
| U.S. | 25.9 | 4.7 |
| Canada | 16.1 | 1.8 |
| Japan | 15.4 | 1.6 |
| Asia Pacific ex. China | 17.1 | 1.8 |
Data as of February 29, 2024. See graphic for full index names. Ratios based on trailing 12 month financials. The price to earnings ratio excludes companies with negative earnings.
On average, European valuations are nearly 50% lower than U.S. valuations, potentially offering an affordable entry point for investors.
Research also shows that lower price ratios have historically led to higher long-term returns.
Market Movements Not Closely Connected
Over the last decade, the European stock market had low-to-moderate correlation with North American and Asian equities.
The below chart shows correlations from February 2014 to February 2024. A value closer to zero indicates low correlation, while a value of one would indicate that two regions are moving in perfect unison.
| EURO STOXX 50 | STOXX EUROPE 600 | U.S. | Canada | Japan | Asia Pacific ex. China |
|
|---|---|---|---|---|---|---|
| EURO STOXX 50 | 1.00 | 0.97 | 0.55 | 0.67 | 0.24 | 0.43 |
| STOXX EUROPE 600 | 1.00 | 0.56 | 0.71 | 0.28 | 0.48 | |
| U.S. | 1.00 | 0.73 | 0.12 | 0.25 | ||
| Canada | 1.00 | 0.22 | 0.40 | |||
| Japan | 1.00 | 0.88 | ||||
| Asia Pacific ex. China | 1.00 |
Data is based on daily USD returns.
European equities had relatively independent market movements from North American and Asian markets. One contributing factor could be the differing sector weights in each market. For instance, technology makes up a quarter of the U.S. market, but health care and industrials dominate the broader European market.
Ultimately, European equities can enhance portfolio diversification and have the potential to mitigate risk for investors.
Tracking the Market
For investors interested in European equities, STOXX offers a variety of flagship indices:
| Index | Description | Market Cap |
|---|---|---|
| STOXX Europe 600 | Pan-regional, broad market | €10.5T |
| STOXX Developed Europe | Pan-regional, broad-market | €9.9T |
| STOXX Europe 600 ESG-X | Pan-regional, broad market, sustainability focus | €9.7T |
| STOXX Europe 50 | Pan-regional, blue-chip | €5.1T |
| EURO STOXX 50 | Eurozone, blue-chip | €3.5T |
Data is as of February 29, 2024. Market cap is free float, which represents the shares that are readily available for public trading on stock exchanges.
The EURO STOXX 50 tracks the Eurozone’s biggest and most traded companies. It also underlies one of the world’s largest ranges of ETFs and mutual funds. As of November 2023, there were €27.3 billion in ETFs and €23.5B in mutual fund assets under management tracking the index.
“For the past 25 years, the EURO STOXX 50 has served as an accurate, reliable and tradable representation of the Eurozone equity market.”
— Axel Lomholt, General Manager at STOXX
Partnering with STOXX to Track the European Stock Market
Are you interested in European equities? STOXX can be a valuable partner:
- Comprehensive, liquid and investable ecosystem
- European heritage, global reach
- Highly sophisticated customization capabilities
- Open architecture approach to using data
- Close partnerships with clients
- Part of ISS STOXX and Deutsche Börse Group
With a full suite of indices, STOXX can help you benchmark against the European stock market.
Learn how STOXX’s European indices offer liquid and effective market access.

-

 Economy2 days ago
Economic Growth Forecasts for G7 and BRICS Countries in 2024
The IMF has released its economic growth forecasts for 2024. How do the G7 and BRICS countries compare?
-

 Markets1 week ago
U.S. Debt Interest Payments Reach $1 Trillion
U.S. debt interest payments have surged past the $1 trillion dollar mark, amid high interest rates and an ever-expanding debt burden.
-

 United States2 weeks ago
Ranked: The Largest U.S. Corporations by Number of Employees
We visualized the top U.S. companies by employees, revealing the massive scale of retailers like Walmart, Target, and Home Depot.
-

 Markets2 weeks ago
The Top 10 States by Real GDP Growth in 2023
This graphic shows the states with the highest real GDP growth rate in 2023, largely propelled by the oil and gas boom.
-

 Markets2 weeks ago
Ranked: The World’s Top Flight Routes, by Revenue
In this graphic, we show the highest earning flight routes globally as air travel continued to rebound in 2023.
-

 Markets2 weeks ago
Ranked: The Most Valuable Housing Markets in America
The U.S. residential real estate market is worth a staggering $47.5 trillion. Here are the most valuable housing markets in the country.


-

 Education1 week ago
How Hard Is It to Get Into an Ivy League School?
-

 Technology2 weeks ago
Ranked: Semiconductor Companies by Industry Revenue Share
-
Markets2 weeks ago
Ranked: The World’s Top Flight Routes, by Revenue
-

 Demographics2 weeks ago
Population Projections: The World’s 6 Largest Countries in 2075
-
Markets2 weeks ago
The Top 10 States by Real GDP Growth in 2023
-

 Demographics2 weeks ago
The Smallest Gender Wage Gaps in OECD Countries
-

 Economy2 weeks ago
Where U.S. Inflation Hit the Hardest in March 2024
-

 Environment2 weeks ago
Top Countries By Forest Growth Since 2001