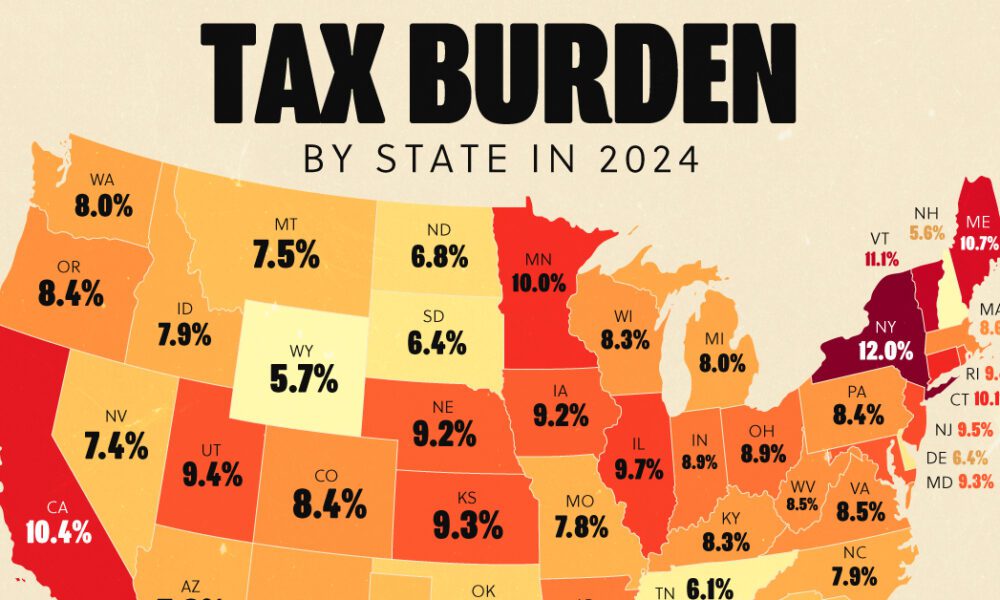
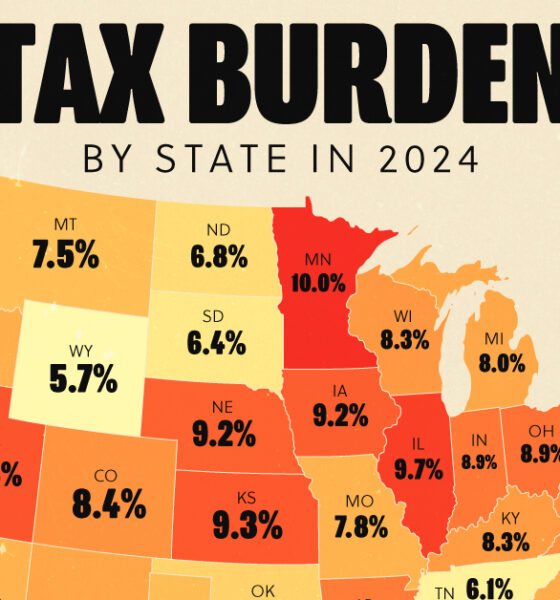
Tax burden measures the percent of an individual's income that is paid towards taxes. See where it's the highest by...
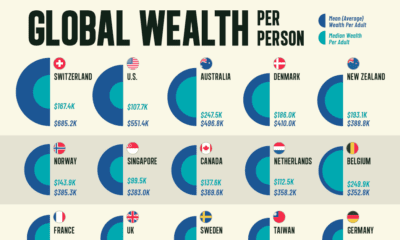

Here's how wealth per person compares by country to reveal differences in average and median wealth around the world.
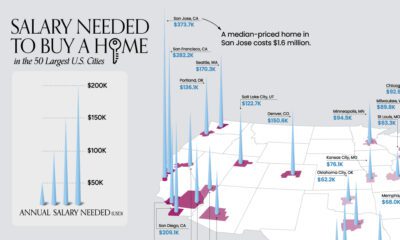

What does it take to own a home in the U.S. in 2023? Here's a look at the salary needed for home ownership in the top...


In this graphic, we visualize the destinations that saw the biggest influx of seasonal centi-millionaire residents in 2022.


We chart current and effective retirement ages for 45 countries, revealing some stark regional differences.
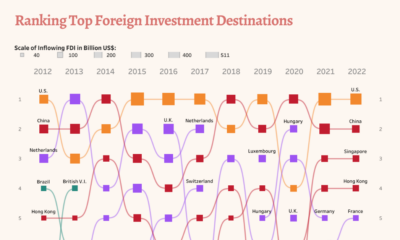

Take a look at changes in foreign direct investment flows over a decade, analyzing the top destinations and biggest investors.
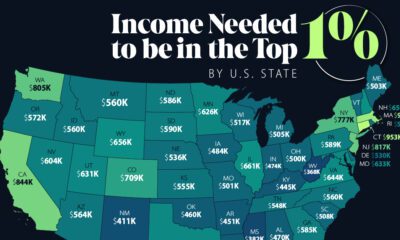

An annual income anywhere between $360,000-$950,000 can grant entry into the top 1%—depending on where you live in America.
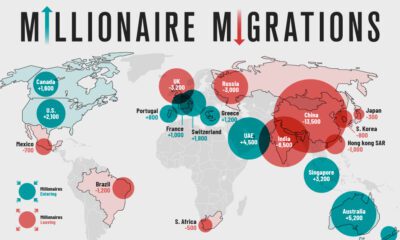

Where do the world's wealthiest people want to live? This map tracks the migration of the world's High Net Worth Individuals (HNWIs).
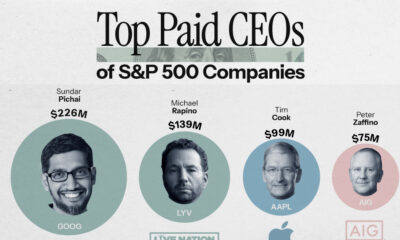

This graphic reveals the top 20 highest paid CEOs in the S&P 500 from Sundar Pichai to Jamie Dimon.
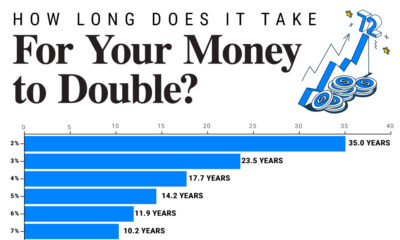

Since 1949, the S&P 500 has doubled in value 10 times. We show how long it takes to double your money across a range of annualized...
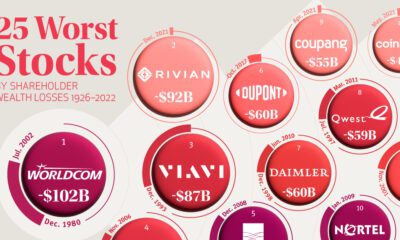

Among publicly-listed U.S. companies, the 25 worst stocks have lost shareholders a collective $1.2 trillion since 1926.


 Creator Program