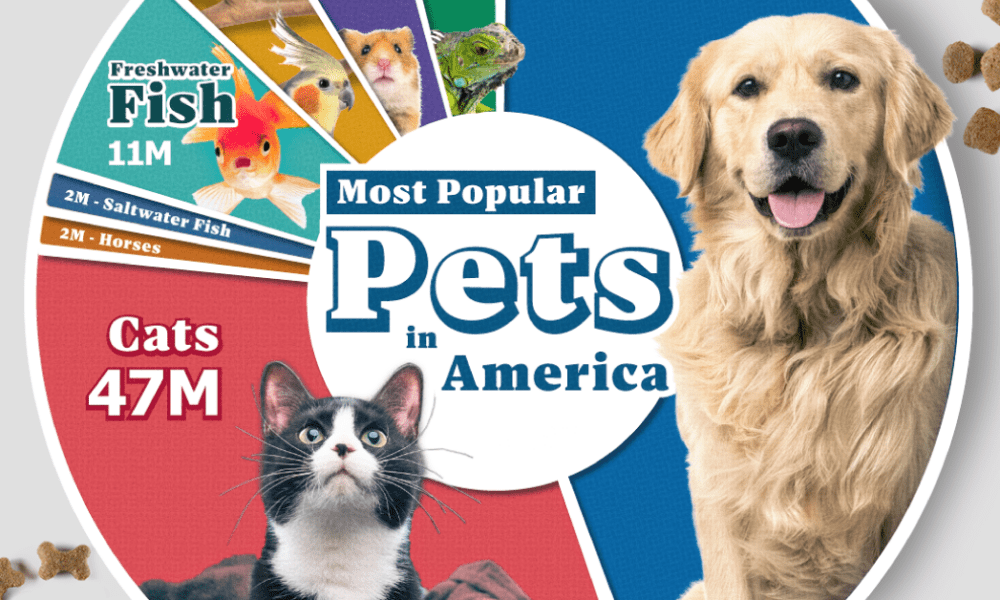

Lions, tigers, and bears, oh my!—these animals do not feature on this list of popular American household pets.


How has inflation impacted everyday goods like milk, flour, or fuel? This chart shows the annual change in the price of basic daily goods.
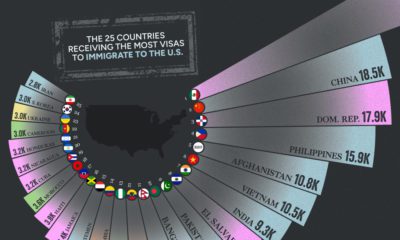

Every year, there are hundreds of thousands of U.S. immigration visas issued by the government. See which countries receive the most in this visualization.
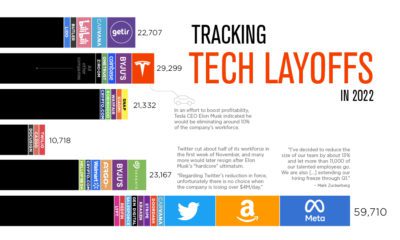

Mass layoffs in the tech industry have accelerated as the end of 2022 approaches. See which companies let people go in 2022.


Lot sizes in the U.S. are shrinking compared to a few decades ago. Here’s a look at the median lot size in every U.S. state.


Over the last century, the median home size in the U.S. has skyrocketed. Here’s a look at which states have the biggest and smallest homes.


From 1901 to 2020, the U.S. population has changed significantly. This video reveals the change in America's demographics over 100+ years.


This visualization breaks down how household wealth is distributed around the world. Just 10 countries now account for 75% of total household wealth.


As the world's superpower, the U.S. has major influence in world events. Which foreign policy concerns stand out for Americans?
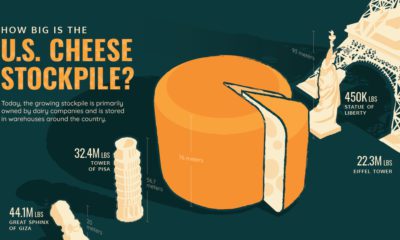

The U.S. has 1.5 billion pounds of cheese in cold storage across the country—around $3.4 billion worth of cheese.


The effective federal funds rate has risen more than two percentage points in six months. How does this compare to other interest rate hikes?


 Creator Program