From complete overhauls to more subtle tweaks, these tech logos have had quite a journey. Featuring: Google, Apple, and more.
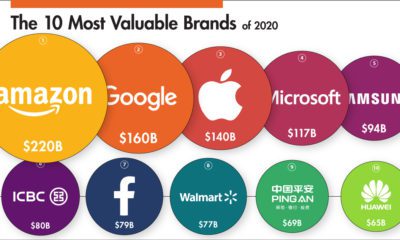

This infographic ranks some of the world’s biggest companies by brand value in 2020 and visualizes the movers and shakers over the past year.
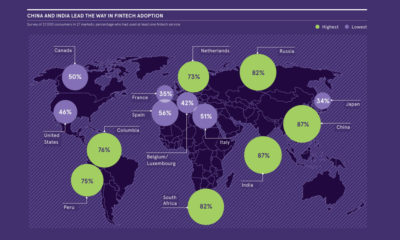

The fintech industry welcomed multi-billion dollar investments in 2019. Where is the most growth, and how are incumbents dealing with digital disruption?
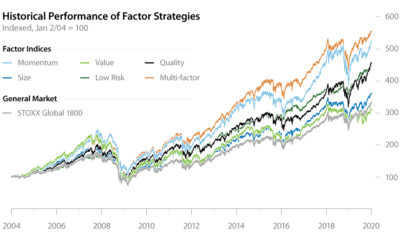

Factor investing has demonstrated its potential to outperform the general market for years. In this infographic, learn how to apply it in your portfolio.
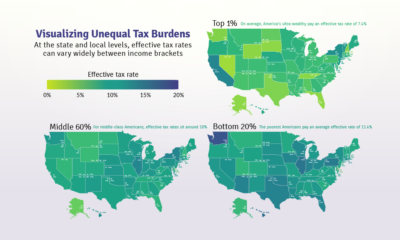

Poor families pay a higher share of their income towards state and local taxes than wealthy families. These maps show the inequitable tax burdens.
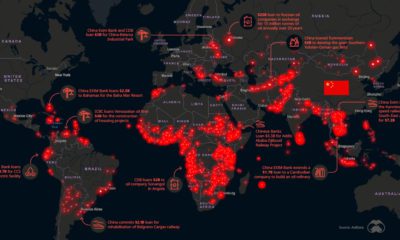

A look at how Chinese diplomacy spending is fueling global megaprojects, as well as growing the country's influence on the world stage.


This infographic delves into what it takes to become an effective leader, and how those qualities can impact a company—beyond employee satisfaction.

Every day, global trends are reshaping society and the business landscape. Here are 10 insights into how the world is changing—and where we are heading.
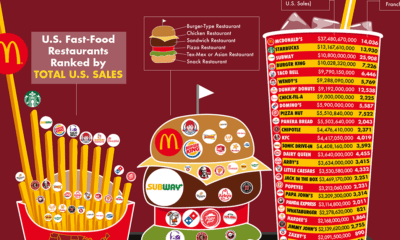

Every year, fast food chains rake in north of $200 billion in revenue per year. Here are the biggest chains, ranked by revenue and number of...
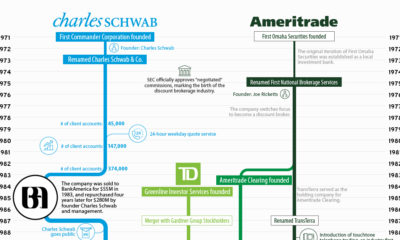

A look at the histories of Charles Schwab and TD Ameritrade, what comes next after the merger, and the potential impacts on the financial services industry.
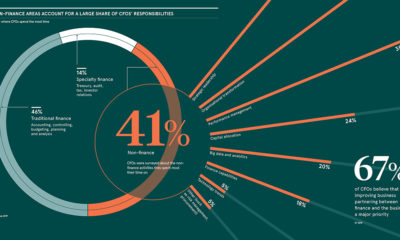

About 41% of CFOs spend the majority of their time on non-finance related activities. This infographic explores the expanding role of the CFO.


