Money
Ranked: The World’s Black Billionaires in 2021


The World’s Black Billionaires in 2021
Black billionaires make up fewer than 1% of all billionaires worldwide. Who are the select few who made it into the ranks of the world’s richest people?
In this graphic, we used the Forbes real-time billionaire list to highlight the most financially successful Black people, and the source(s) of their wealth.
Black Billionaires, Ranked
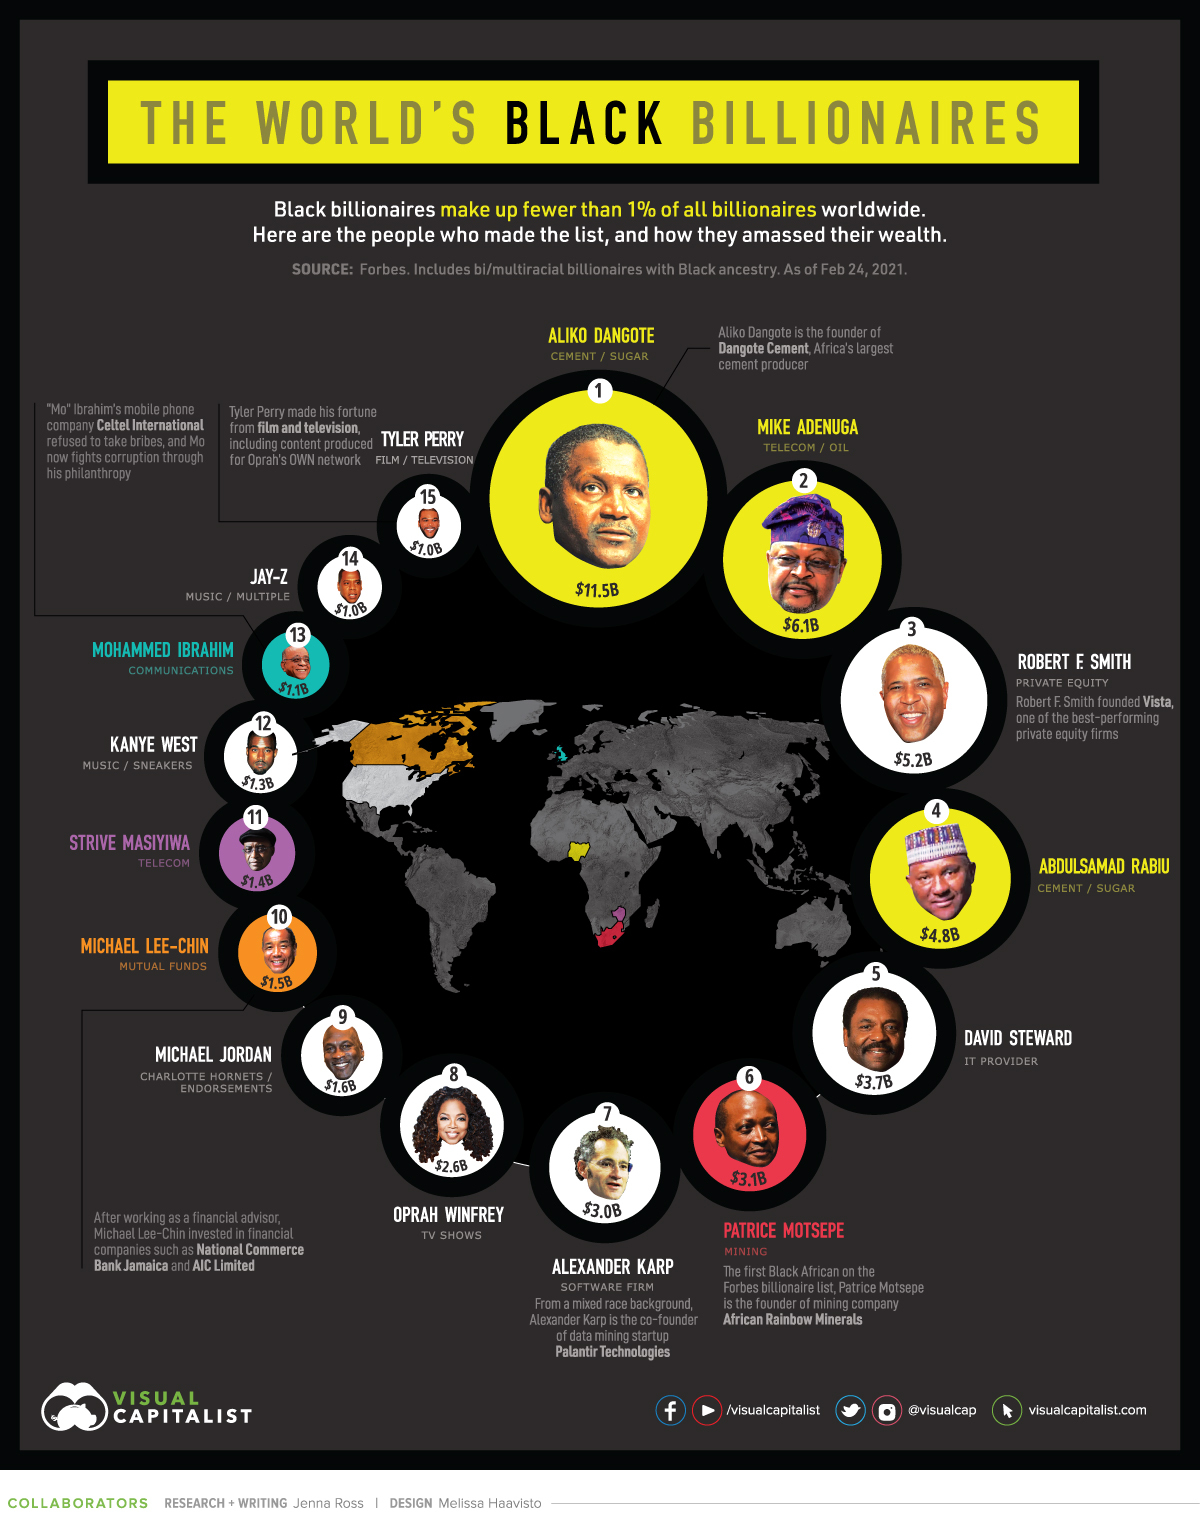
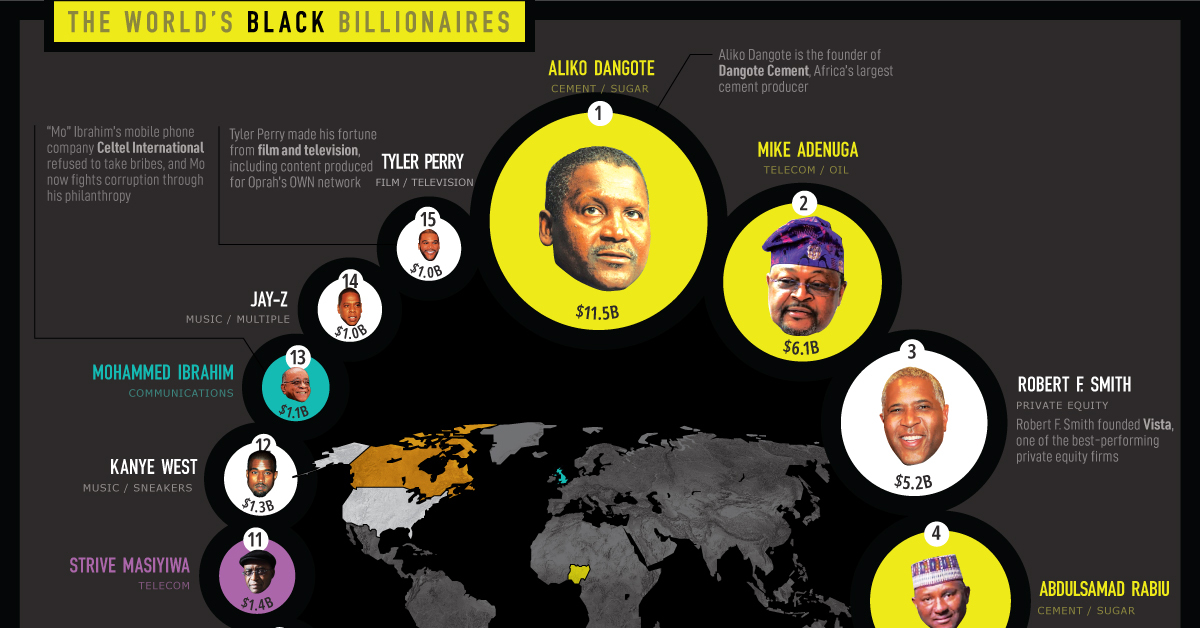
The data is as of February 24, 2021, and includes bi/multi racial individuals with Black ancestry. Altogether, there are 15 Black billionaires with a combined wealth of $48.9 billion.
Here is the how the full list breaks down:
| Rank | Name | Net Worth | Citizenship | Source |
|---|---|---|---|---|
| 1 | Aliko Dangote | $11.5B | Nigeria | Cement, sugar |
| 2 | Mike Adenuga | $6.1B | Nigeria | Telecom, oil |
| 3 | Robert F. Smith | $5.2B | United States | Private equity |
| 4 | Abdulsamad Rabiu | $4.8B | Nigeria | Cement, sugar |
| 5 | David Steward | $3.7B | United States | IT provider |
| 6 | Patrice Motsepe | $3.1B | South Africa | Mining |
| 7 | Alexander Karp | $3.0B | United States | Software firm |
| 8 | Oprah Winfrey | $2.6B | United States | TV shows |
| 9 | Michael Jordan | $1.6B | United States | Charlotte Hornets, endorsements |
| 10 | Michael Lee-Chin | $1.5B | Canada | Mutual funds |
| 11 | Strive Masiyiwa | $1.4B | Zimbabwe | Telecom |
| 12 | Kanye West | $1.3B | United States | Music, sneakers |
| 13 | Mohammed Ibrahim | $1.1B | United Kingdom | Communications |
| 14 | Shawn Carter (Jay-Z) | $1.0B | United States | Music, multiple |
| 15 | Tyler Perry | $1.0B | United States | Movies, television |
Aliko Dangote is the richest Black billionaire, and has held the title since 2013. He owns 85% of publicly-traded Dangote Cement, Africa’s largest cement producer. The company’s stock price went up more than 30% over the last year. In addition, Dangote also has investments in salt and sugar manufacturing companies.
The fifth richest Black person, David Steward, owns the technology solutions provider World Wide Technology. Steward had decided he wanted to be part of the technological revolution and founded the company in 1990, before the first internet browser had even been created. The company has since grown to be the largest Black-owned business in America with over $13.4 billion in annual revenue and more than 7,000 employees.
Best known for his music career, Shawn Carter, more commonly known as Jay-Z, is number 14 on the list. However, the rapper’s wealth goes far beyond his music. Jay-Z has built a diversified business empire, including investments in a fine art collection, an entertainment company, a clothing line, and alcohol brands. He recently sold half of his champagne brand to LVMH, the parent company of Dom Pérignon.
Unequal Representation
Unfortunately, little progress has been made with regards to the proportion of Black billionaires. Since 2011, Black billionaires have made up fewer than 1% of all billionaires worldwide.
In absolute numbers, the total number of billionaires rose by over 1,100 while the number of Black billionaires rose by just nine people.
The number of Black billionaires also falls very short of being representative of the general population. For example, only 8 or 1.2% of America’s 665 billionaires are Black. By contrast, Black people make up 12.2% of the U.S. population.
Breaking Through Barriers
There is still a large racial wealth gap between Black people and White people—even at the highest levels of financial achievement. However, despite these racial and systemic barriers, 14 of the 15 Black billionaires are self-made, meaning they built their wealth from the ground up. Who will be next to join the ranks?
“Innovation doesn’t happen without a person of color or a diversity of thought being at the table in order to challenge the status quo.”
—David Steward


Money
Charted: Which City Has the Most Billionaires in 2024?
Just two countries account for half of the top 20 cities with the most billionaires. And the majority of the other half are found in Asia.


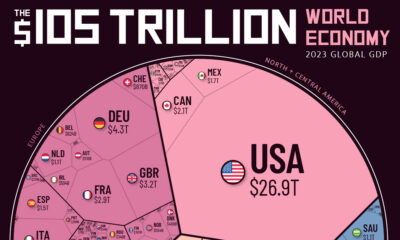
Charted: Which Country Has the Most Billionaires in 2024?
This was originally posted on our Voronoi app. Download the app for free on iOS or Android and discover incredible data-driven charts from a variety of trusted sources.
Some cities seem to attract the rich. Take New York City for example, which has 340,000 high-net-worth residents with investable assets of more than $1 million.
But there’s a vast difference between being a millionaire and a billionaire. So where do the richest of them all live?
Using data from the Hurun Global Rich List 2024, we rank the top 20 cities with the highest number of billionaires in 2024.
A caveat to these rich lists: sources often vary on figures and exact rankings. For example, in last year’s reports, Forbes had New York as the city with the most billionaires, while the Hurun Global Rich List placed Beijing at the top spot.
Ranked: Top 20 Cities with the Most Billionaires in 2024
The Chinese economy’s doldrums over the course of the past year have affected its ultra-wealthy residents in key cities.
Beijing, the city with the most billionaires in 2023, has not only ceded its spot to New York, but has dropped to #4, overtaken by London and Mumbai.
| Rank | City | Billionaires | Rank Change YoY |
|---|---|---|---|
| 1 | 🇺🇸 New York | 119 | +1 |
| 2 | 🇬🇧 London | 97 | +3 |
| 3 | 🇮🇳 Mumbai | 92 | +4 |
| 4 | 🇨🇳 Beijing | 91 | -3 |
| 5 | 🇨🇳 Shanghai | 87 | -2 |
| 6 | 🇨🇳 Shenzhen | 84 | -2 |
| 7 | 🇭🇰 Hong Kong | 65 | -1 |
| 8 | 🇷🇺 Moscow | 59 | No Change |
| 9 | 🇮🇳 New Delhi | 57 | +6 |
| 10 | 🇺🇸 San Francisco | 52 | No Change |
| 11 | 🇹🇭 Bangkok | 49 | +2 |
| 12 | 🇹🇼 Taipei | 45 | +2 |
| 13 | 🇫🇷 Paris | 44 | -2 |
| 14 | 🇨🇳 Hangzhou | 43 | -5 |
| 15 | 🇸🇬 Singapore | 42 | New to Top 20 |
| 16 | 🇨🇳 Guangzhou | 39 | -4 |
| 17T | 🇮🇩 Jakarta | 37 | +1 |
| 17T | 🇧🇷 Sao Paulo | 37 | No Change |
| 19T | 🇺🇸 Los Angeles | 31 | No Change |
| 19T | 🇰🇷 Seoul | 31 | -3 |
In fact all Chinese cities on the top 20 list have lost billionaires between 2023–24. Consequently, they’ve all lost ranking spots as well, with Hangzhou seeing the biggest slide (-5) in the top 20.
Where China lost, all other Asian cities—except Seoul—in the top 20 have gained ranks. Indian cities lead the way, with New Delhi (+6) and Mumbai (+3) having climbed the most.
At a country level, China and the U.S combine to make up half of the cities in the top 20. They are also home to about half of the world’s 3,200 billionaire population.
In other news of note: Hurun officially counts Taylor Swift as a billionaire, estimating her net worth at $1.2 billion.

-

 Science1 week ago
Visualizing the Average Lifespans of Mammals
-

 Markets2 weeks ago
The Top 10 States by Real GDP Growth in 2023
-

 Demographics2 weeks ago
The Smallest Gender Wage Gaps in OECD Countries
-

 United States2 weeks ago
Where U.S. Inflation Hit the Hardest in March 2024
-

 Green2 weeks ago
Top Countries By Forest Growth Since 2001
-

 United States2 weeks ago
Ranked: The Largest U.S. Corporations by Number of Employees
-

 Maps2 weeks ago
The Largest Earthquakes in the New York Area (1970-2024)
-

 Green2 weeks ago
Ranked: The Countries With the Most Air Pollution in 2023