Technology
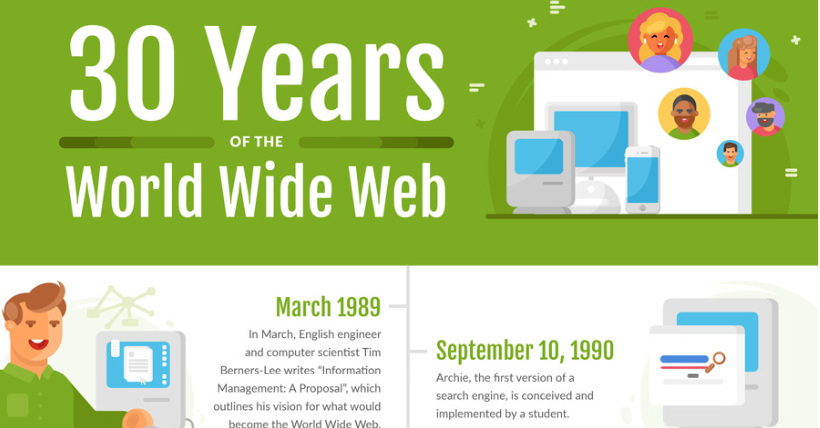
Timeline: The 30-Year History of the World Wide Web
The World Wide Web is now as old as the typical millennial.
On March 12, the World Wide Web celebrated its 30th birthday. Over the last three decades, we’ve seen it mature from the first webpage to having a ubiquitous presence in our lives.
Visualizing the History of the World Wide Web
Today’s infographic comes to us from the App Institute, and highlights key milestones since the inception of the web. We’ll look at some major developments on this timeline that defined what the web is today.
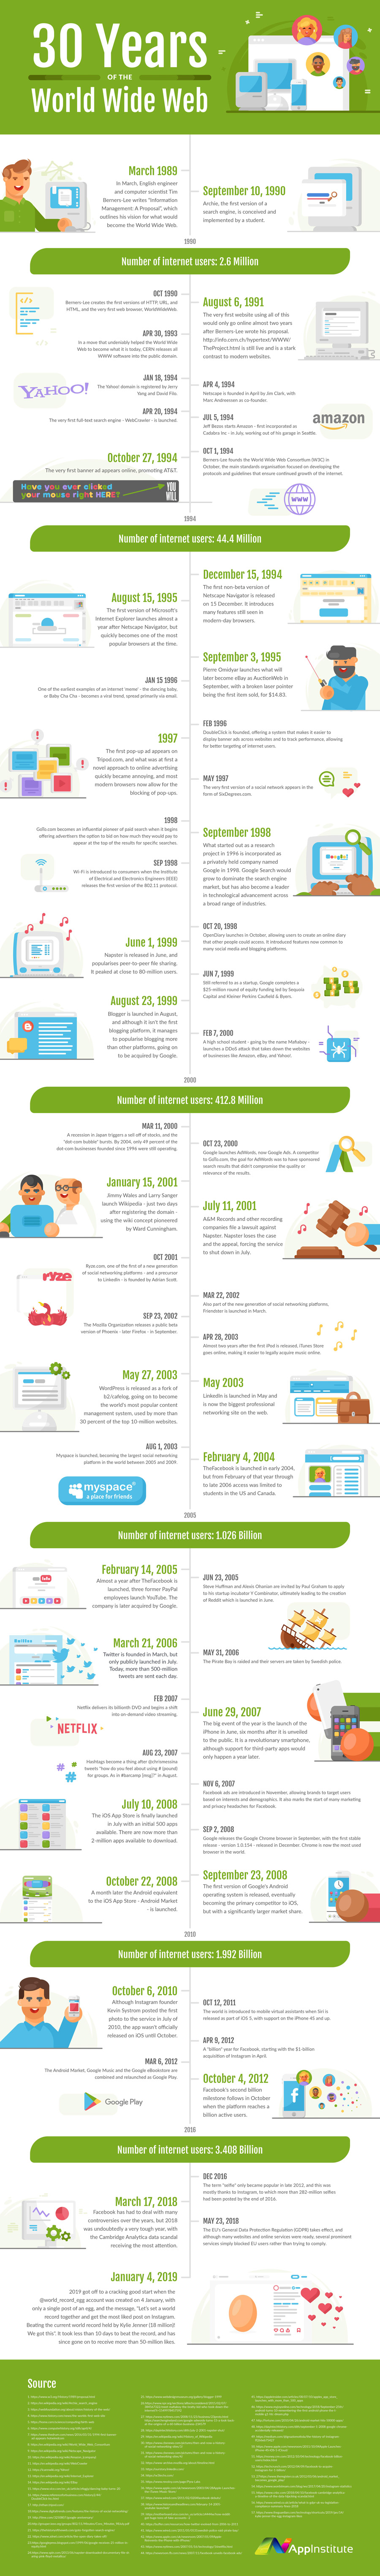
Tim Berners-Lee Proposes The World Wide Web on March 12, 1989
Although the giant network of computers that formed the Internet – and its “ARPANET” predecessor – already existed, there was no universal way of writing, transmitting, storing, and accessing the Internet in a clean and organized manner.
A computer scientist named Tim Berners-Lee is credited with the first formalized proposal of what he would later call the “World Wide Web”.
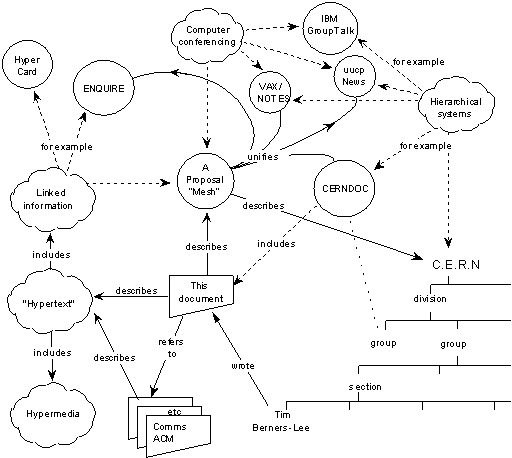
A flow chart of Berners-Lee’s vision in 1989. Source: W3
From this vision, his work would go on to develop and influence assets the web still uses today like hypertext (links), webpages, and browsers.
The founder of the World Wide Web is still around, and most recently Berners-Lee has been fighting for his vision of an open and decentralized Internet.
Browser Wars
Mosaic was the first browser to popularize “surfing the web”. Launched in 1993, Mosaic’s graphical user interface (GUI) made it easy for the average user to browse multimedia webpages.
Soon after, developers from Mosaic launched Netscape Navigator in 1994, introducing features used today like HTTP cookies and JavaScript.
The first browser war began when Microsoft launched Internet Explorer in 1995. Unlike Netscape, Internet Explorer was free of charge. Microsoft overtook Netscape with help from their deep pockets and the fact that they held over 90% of the desktop operating system market share.
This would eventually lead to the U.S. government filing an anti-trust case against Microsoft for engaging in anti-competitive practices – but Internet Explorer escaped mostly unaffected, with it’s market share climbing to 96% by 2002.
Today, the second browser war has largely been dominated by Google Chrome, which launched in 2008 and overtook Internet Explorer by 2012.
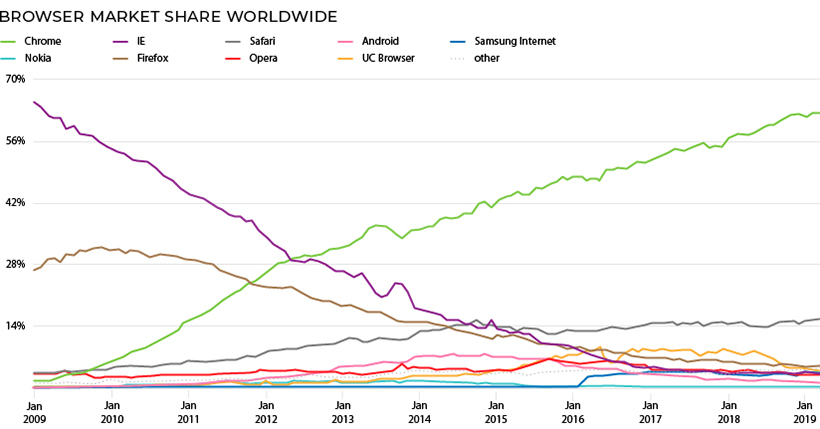
Source: StatCounter
Web Crawling: Search
Search engines helped popularize the web by making information easily accessible and searchable. Web Crawler was the first search engine that allowed users to search for words and terms on a webpage.

Source: App Institute
Since then, dozens of search engines have launched, but one player has dominated the search market. Today, over 90% of searches online are made through Google.
The Social Internet
In the late 1990s, online diaries and “blogging” websites like Open Diary, LiveJournal and Blogger popularized people sharing their thoughts to an audience online.
This evolved into social networking sites like Friendster, MySpace, and Facebook, which allowed people to “add” their friends and follow their lives online.
Today, of course, Facebook dominates the Social Media Universe with over 2.2 billion users.
Smartphone Revolution
The launch of iPhones and Androids in 2007 – 2008 ushered in a new era where people could access the web from their phones. Before this, websites on phones were clunky to use and mostly resembled their desktop counterparts. Third-party apps and websites designed for mobile touchscreens changed the way we browsed the web.
By 2016, mobile phones surpassed desktops and laptops as our favorite way to access the web:
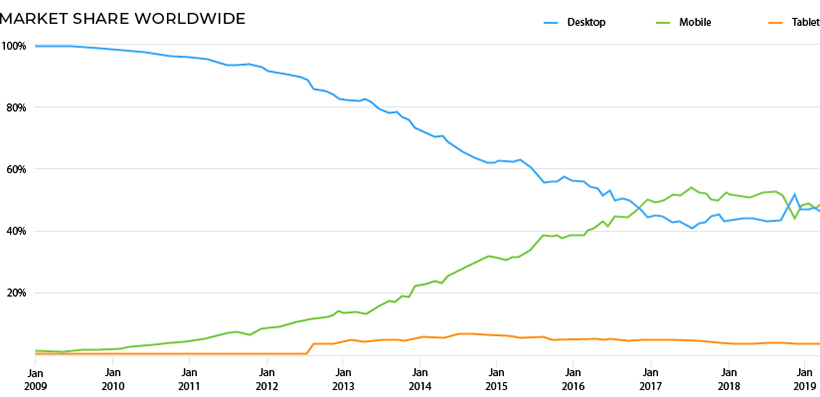
Source: StatCounter
Privacy: You’re the Product Now
With billions of people accessing the web, the trail of data left behind has become extremely profitable for tech giants like Google and Facebook. The data they collect from people’s private information, online behaviors, and demographics allow advertisers to perfectly target consumers.
With ever growing privacy scandals, and even the creation of surveillance states, how people’s privacy and data is handled will likely be the most important issue for the future of the web.


Technology
Ranked: Semiconductor Companies by Industry Revenue Share
Nvidia is coming for Intel’s crown. Samsung is losing ground. AI is transforming the space. We break down revenue for semiconductor companies.


Semiconductor Companies by Industry Revenue Share
This was originally posted on our Voronoi app. Download the app for free on Apple or Android and discover incredible data-driven charts from a variety of trusted sources.
Did you know that some computer chips are now retailing for the price of a new BMW?
As computers invade nearly every sphere of life, so too have the chips that power them, raising the revenues of the businesses dedicated to designing them.
But how did various chipmakers measure against each other last year?
We rank the biggest semiconductor companies by their percentage share of the industry’s revenues in 2023, using data from Omdia research.
Which Chip Company Made the Most Money in 2023?
Market leader and industry-defining veteran Intel still holds the crown for the most revenue in the sector, crossing $50 billion in 2023, or 10% of the broader industry’s topline.
All is not well at Intel, however, with the company’s stock price down over 20% year-to-date after it revealed billion-dollar losses in its foundry business.
| Rank | Company | 2023 Revenue | % of Industry Revenue |
|---|---|---|---|
| 1 | Intel | $51B | 9.4% |
| 2 | NVIDIA | $49B | 9.0% |
| 3 | Samsung Electronics | $44B | 8.1% |
| 4 | Qualcomm | $31B | 5.7% |
| 5 | Broadcom | $28B | 5.2% |
| 6 | SK Hynix | $24B | 4.4% |
| 7 | AMD | $22B | 4.1% |
| 8 | Apple | $19B | 3.4% |
| 9 | Infineon Tech | $17B | 3.2% |
| 10 | STMicroelectronics | $17B | 3.2% |
| 11 | Texas Instruments | $17B | 3.1% |
| 12 | Micron Technology | $16B | 2.9% |
| 13 | MediaTek | $14B | 2.6% |
| 14 | NXP | $13B | 2.4% |
| 15 | Analog Devices | $12B | 2.2% |
| 16 | Renesas Electronics Corporation | $11B | 1.9% |
| 17 | Sony Semiconductor Solutions Corporation | $10B | 1.9% |
| 18 | Microchip Technology | $8B | 1.5% |
| 19 | Onsemi | $8B | 1.4% |
| 20 | KIOXIA Corporation | $7B | 1.3% |
| N/A | Others | $126B | 23.2% |
| N/A | Total | $545B | 100% |
Note: Figures are rounded. Totals and percentages may not sum to 100.
Meanwhile, Nvidia is very close to overtaking Intel, after declaring $49 billion of topline revenue for 2023. This is more than double its 2022 revenue ($21 billion), increasing its share of industry revenues to 9%.
Nvidia’s meteoric rise has gotten a huge thumbs-up from investors. It became a trillion dollar stock last year, and broke the single-day gain record for market capitalization this year.
Other chipmakers haven’t been as successful. Out of the top 20 semiconductor companies by revenue, 12 did not match their 2022 revenues, including big names like Intel, Samsung, and AMD.
The Many Different Types of Chipmakers
All of these companies may belong to the same industry, but they don’t focus on the same niche.
According to Investopedia, there are four major types of chips, depending on their functionality: microprocessors, memory chips, standard chips, and complex systems on a chip.
Nvidia’s core business was once GPUs for computers (graphics processing units), but in recent years this has drastically shifted towards microprocessors for analytics and AI.
These specialized chips seem to be where the majority of growth is occurring within the sector. For example, companies that are largely in the memory segment—Samsung, SK Hynix, and Micron Technology—saw peak revenues in the mid-2010s.

-

 Real Estate2 weeks ago
Visualizing America’s Shortage of Affordable Homes
-

 Technology1 week ago
Ranked: Semiconductor Companies by Industry Revenue Share
-

 Money1 week ago
Which States Have the Highest Minimum Wage in America?
-

 Real Estate1 week ago
Ranked: The Most Valuable Housing Markets in America
-

 Business2 weeks ago
Charted: Big Four Market Share by S&P 500 Audits
-

 AI2 weeks ago
The Stock Performance of U.S. Chipmakers So Far in 2024
-

 Misc2 weeks ago
Almost Every EV Stock is Down After Q1 2024
-

 Money2 weeks ago
Where Does One U.S. Tax Dollar Go?