Markets
Ranked: America’s Best Places to Work in 2023
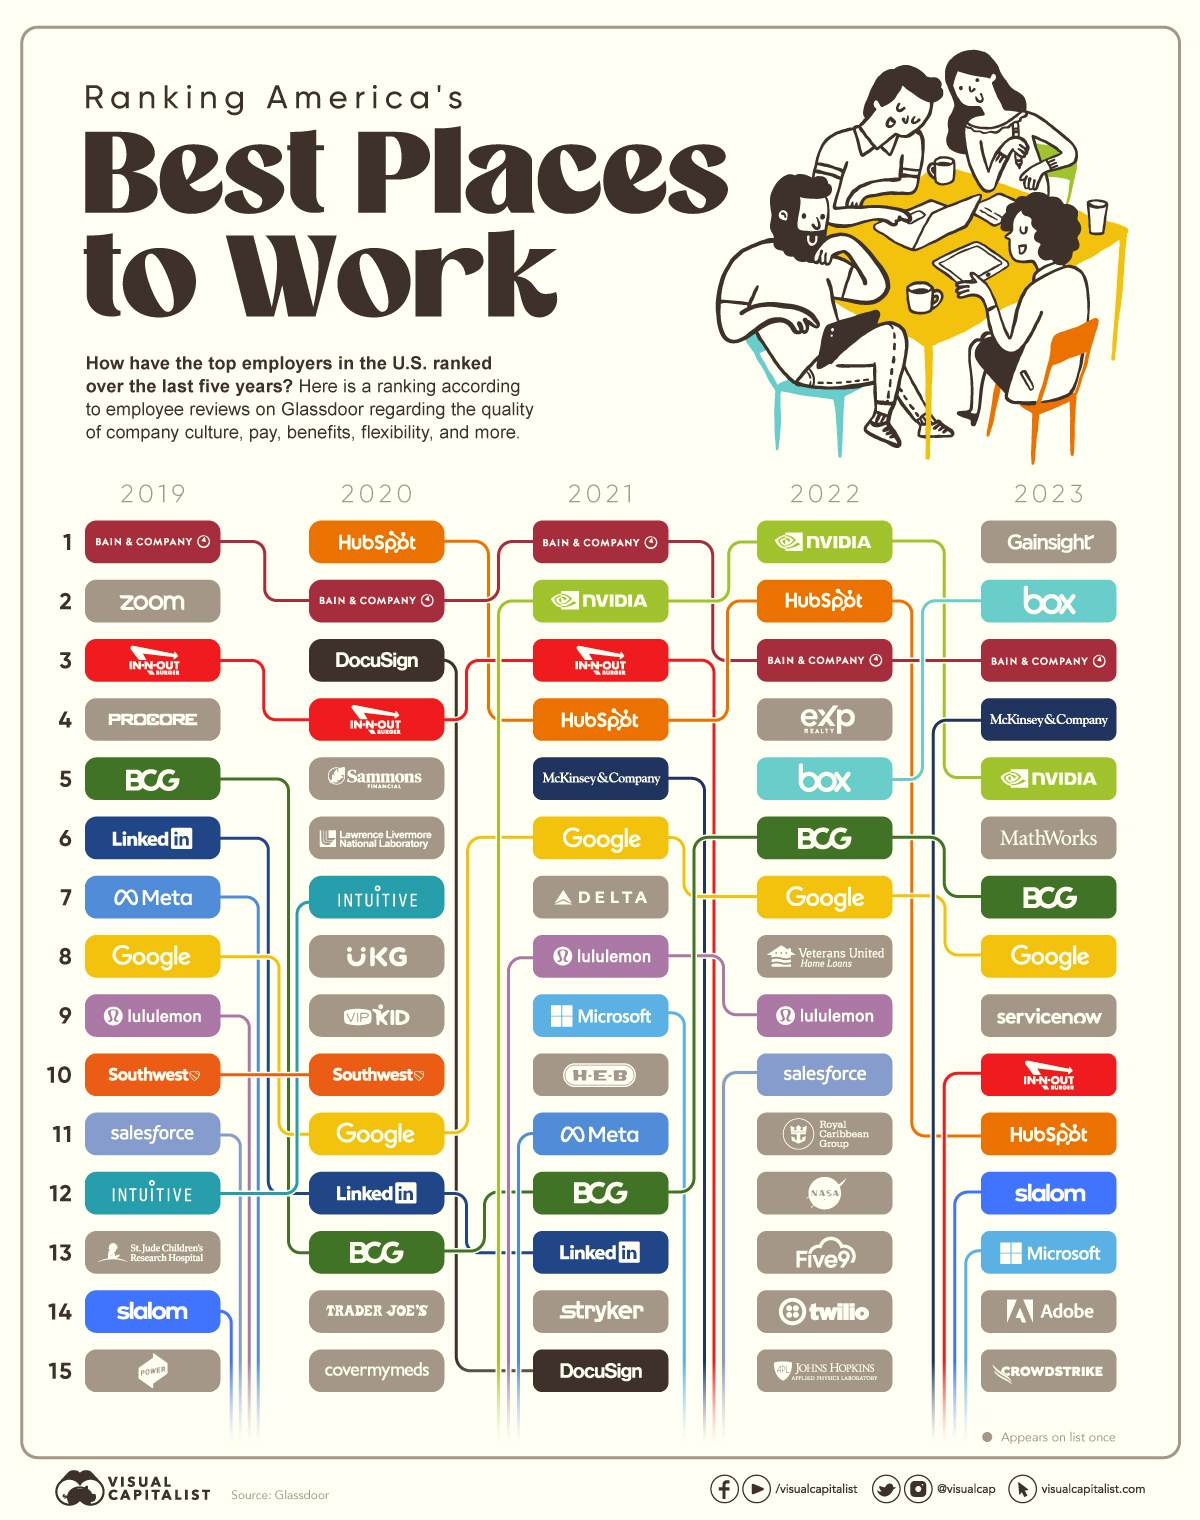


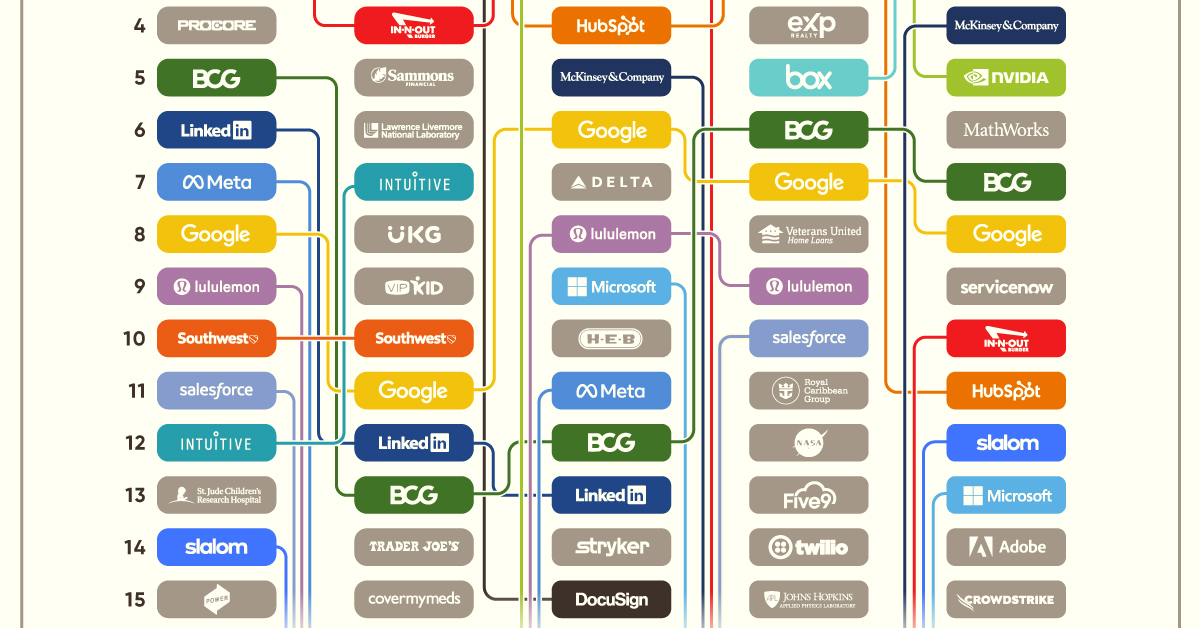
Ranking America’s Best Places to Work
What better way to know more about a company’s work culture than to hear from those who’ve already been on the inside?
In the above graphic, we dissect how America’s top employers have changed over the last five years based on employee reviews on Glassdoor, a website that allows current and former employees to anonymously review their employers on things like company culture, pay, benefits, diversity, and more.
Tech Fares Best
Despite widescale layoffs in 2022, technology companies made up more than 40% of Glassdoor’s Best Places to Work list in 2023. Gainsight, a customer success software company founded in 2009, entered the top 15 ranking for the first time in five years and took the number one spot as the year’s best employer.
The dominance of technology companies in Glassdoor’s Best Places to Work list is nothing new, though. Companies like HubSpot and NVIDIA are staples on the list, with consistent praise from their employees when it comes to pay, benefits, leadership, and career growth.
| Rank | 2019 | 2020 | 2021 | 2022 | 2023 |
|---|---|---|---|---|---|
| #1 | Bain & Company | HubSpot | Bain & Company | NVIDIA | Gainsight |
| #2 | Zoom Video Communications | Bain & Company | NVIDIA | HubSpot | Box |
| #3 | In-N-Out Burger | DocuSign | In-N-Out Burger | Bain & Company | Bain & Company |
| #4 | Procore Technologies | In-N-Out Burger | HubSpot | eXp Realty | McKinsey & Company |
| #5 | Boston Consulting Group | Sammons Financial Group Companies | McKinsey & Company | Box | NVIDIA |
While tech tends to be popular among employees, the industry isn’t the end-all-be-all when it comes to good employee reviews.
Take Bain & Company, a management consulting firm with over 10,000 employees, that’s been consistently ranking in the top three over the last five years. Or look at fast-food chain In-N-Out Burger, whose employees consistently rave about good pay and schedule flexibility in anonymous Glassdoor reviews, making the company one of America’s top 20 employers since 2015.
Analyzing Ranking by Company
Diving into the ranking by company can also give us a good understanding of how some of the giants compare to others in the field.
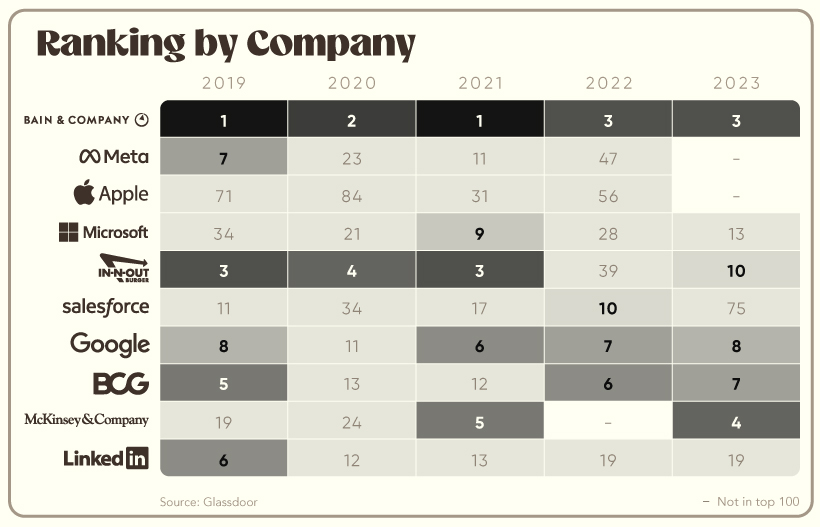
Looking at the above visual, you might notice that two regular winners, Apple and Meta, did not make the top 100 this year. Salesforce’s ranking also fell below the top 50 for the first time since 2015, coming in at #75. While tech fared relatively well in 2023, these companies tumbled down and off the list, making way for smaller tech companies like Gainsight, Box, and MathWorks.
As the global economy faces uncertainty in 2023, it’ll be interesting to observe how these companies fare in terms of employee satisfaction. Against the backdrop of layoffs and slower economic growth, how leadership navigates hard conversations and steps up for their employees may be very telling, potentially resulting in a completely different makeup of the list in 2024.


Markets
The European Stock Market: Attractive Valuations Offer Opportunities
On average, the European stock market has valuations that are nearly 50% lower than U.S. valuations. But how can you access the market?


European Stock Market: Attractive Valuations Offer Opportunities
Europe is known for some established brands, from L’Oréal to Louis Vuitton. However, the European stock market offers additional opportunities that may be lesser known.
The above infographic, sponsored by STOXX, outlines why investors may want to consider European stocks.
Attractive Valuations
Compared to most North American and Asian markets, European stocks offer lower or comparable valuations.
| Index | Price-to-Earnings Ratio | Price-to-Book Ratio |
|---|---|---|
| EURO STOXX 50 | 14.9 | 2.2 |
| STOXX Europe 600 | 14.4 | 2 |
| U.S. | 25.9 | 4.7 |
| Canada | 16.1 | 1.8 |
| Japan | 15.4 | 1.6 |
| Asia Pacific ex. China | 17.1 | 1.8 |
Data as of February 29, 2024. See graphic for full index names. Ratios based on trailing 12 month financials. The price to earnings ratio excludes companies with negative earnings.
On average, European valuations are nearly 50% lower than U.S. valuations, potentially offering an affordable entry point for investors.
Research also shows that lower price ratios have historically led to higher long-term returns.
Market Movements Not Closely Connected
Over the last decade, the European stock market had low-to-moderate correlation with North American and Asian equities.
The below chart shows correlations from February 2014 to February 2024. A value closer to zero indicates low correlation, while a value of one would indicate that two regions are moving in perfect unison.
| EURO STOXX 50 | STOXX EUROPE 600 | U.S. | Canada | Japan | Asia Pacific ex. China |
|
|---|---|---|---|---|---|---|
| EURO STOXX 50 | 1.00 | 0.97 | 0.55 | 0.67 | 0.24 | 0.43 |
| STOXX EUROPE 600 | 1.00 | 0.56 | 0.71 | 0.28 | 0.48 | |
| U.S. | 1.00 | 0.73 | 0.12 | 0.25 | ||
| Canada | 1.00 | 0.22 | 0.40 | |||
| Japan | 1.00 | 0.88 | ||||
| Asia Pacific ex. China | 1.00 |
Data is based on daily USD returns.
European equities had relatively independent market movements from North American and Asian markets. One contributing factor could be the differing sector weights in each market. For instance, technology makes up a quarter of the U.S. market, but health care and industrials dominate the broader European market.
Ultimately, European equities can enhance portfolio diversification and have the potential to mitigate risk for investors.
Tracking the Market
For investors interested in European equities, STOXX offers a variety of flagship indices:
| Index | Description | Market Cap |
|---|---|---|
| STOXX Europe 600 | Pan-regional, broad market | €10.5T |
| STOXX Developed Europe | Pan-regional, broad-market | €9.9T |
| STOXX Europe 600 ESG-X | Pan-regional, broad market, sustainability focus | €9.7T |
| STOXX Europe 50 | Pan-regional, blue-chip | €5.1T |
| EURO STOXX 50 | Eurozone, blue-chip | €3.5T |
Data is as of February 29, 2024. Market cap is free float, which represents the shares that are readily available for public trading on stock exchanges.
The EURO STOXX 50 tracks the Eurozone’s biggest and most traded companies. It also underlies one of the world’s largest ranges of ETFs and mutual funds. As of November 2023, there were €27.3 billion in ETFs and €23.5B in mutual fund assets under management tracking the index.
“For the past 25 years, the EURO STOXX 50 has served as an accurate, reliable and tradable representation of the Eurozone equity market.”
— Axel Lomholt, General Manager at STOXX
Partnering with STOXX to Track the European Stock Market
Are you interested in European equities? STOXX can be a valuable partner:
- Comprehensive, liquid and investable ecosystem
- European heritage, global reach
- Highly sophisticated customization capabilities
- Open architecture approach to using data
- Close partnerships with clients
- Part of ISS STOXX and Deutsche Börse Group
With a full suite of indices, STOXX can help you benchmark against the European stock market.
Learn how STOXX’s European indices offer liquid and effective market access.

-

 Economy2 days ago
Economic Growth Forecasts for G7 and BRICS Countries in 2024
The IMF has released its economic growth forecasts for 2024. How do the G7 and BRICS countries compare?
-

 Markets1 week ago
U.S. Debt Interest Payments Reach $1 Trillion
U.S. debt interest payments have surged past the $1 trillion dollar mark, amid high interest rates and an ever-expanding debt burden.
-

 United States2 weeks ago
Ranked: The Largest U.S. Corporations by Number of Employees
We visualized the top U.S. companies by employees, revealing the massive scale of retailers like Walmart, Target, and Home Depot.
-

 Markets2 weeks ago
The Top 10 States by Real GDP Growth in 2023
This graphic shows the states with the highest real GDP growth rate in 2023, largely propelled by the oil and gas boom.
-

 Markets2 weeks ago
Ranked: The World’s Top Flight Routes, by Revenue
In this graphic, we show the highest earning flight routes globally as air travel continued to rebound in 2023.
-

 Markets2 weeks ago
Ranked: The Most Valuable Housing Markets in America
The U.S. residential real estate market is worth a staggering $47.5 trillion. Here are the most valuable housing markets in the country.

-

 Energy1 week ago
The World’s Biggest Nuclear Energy Producers
-

 Money2 weeks ago
Which States Have the Highest Minimum Wage in America?
-

 Technology2 weeks ago
Ranked: Semiconductor Companies by Industry Revenue Share
-
Markets2 weeks ago
Ranked: The World’s Top Flight Routes, by Revenue
-

 Countries2 weeks ago
Population Projections: The World’s 6 Largest Countries in 2075
-
Markets2 weeks ago
The Top 10 States by Real GDP Growth in 2023
-

 Demographics2 weeks ago
The Smallest Gender Wage Gaps in OECD Countries
-

 United States2 weeks ago
Where U.S. Inflation Hit the Hardest in March 2024