Technology
Ranked: America’s 20 Biggest Tech Layoffs Since 2020


Ranked: America’s 20 Biggest Tech Layoffs This Decade
The events of the last few years could not have been predicted by anyone. From a global pandemic and remote work as the standard, to a subsequent hiring craze, rising inflation, and now, mass layoffs.
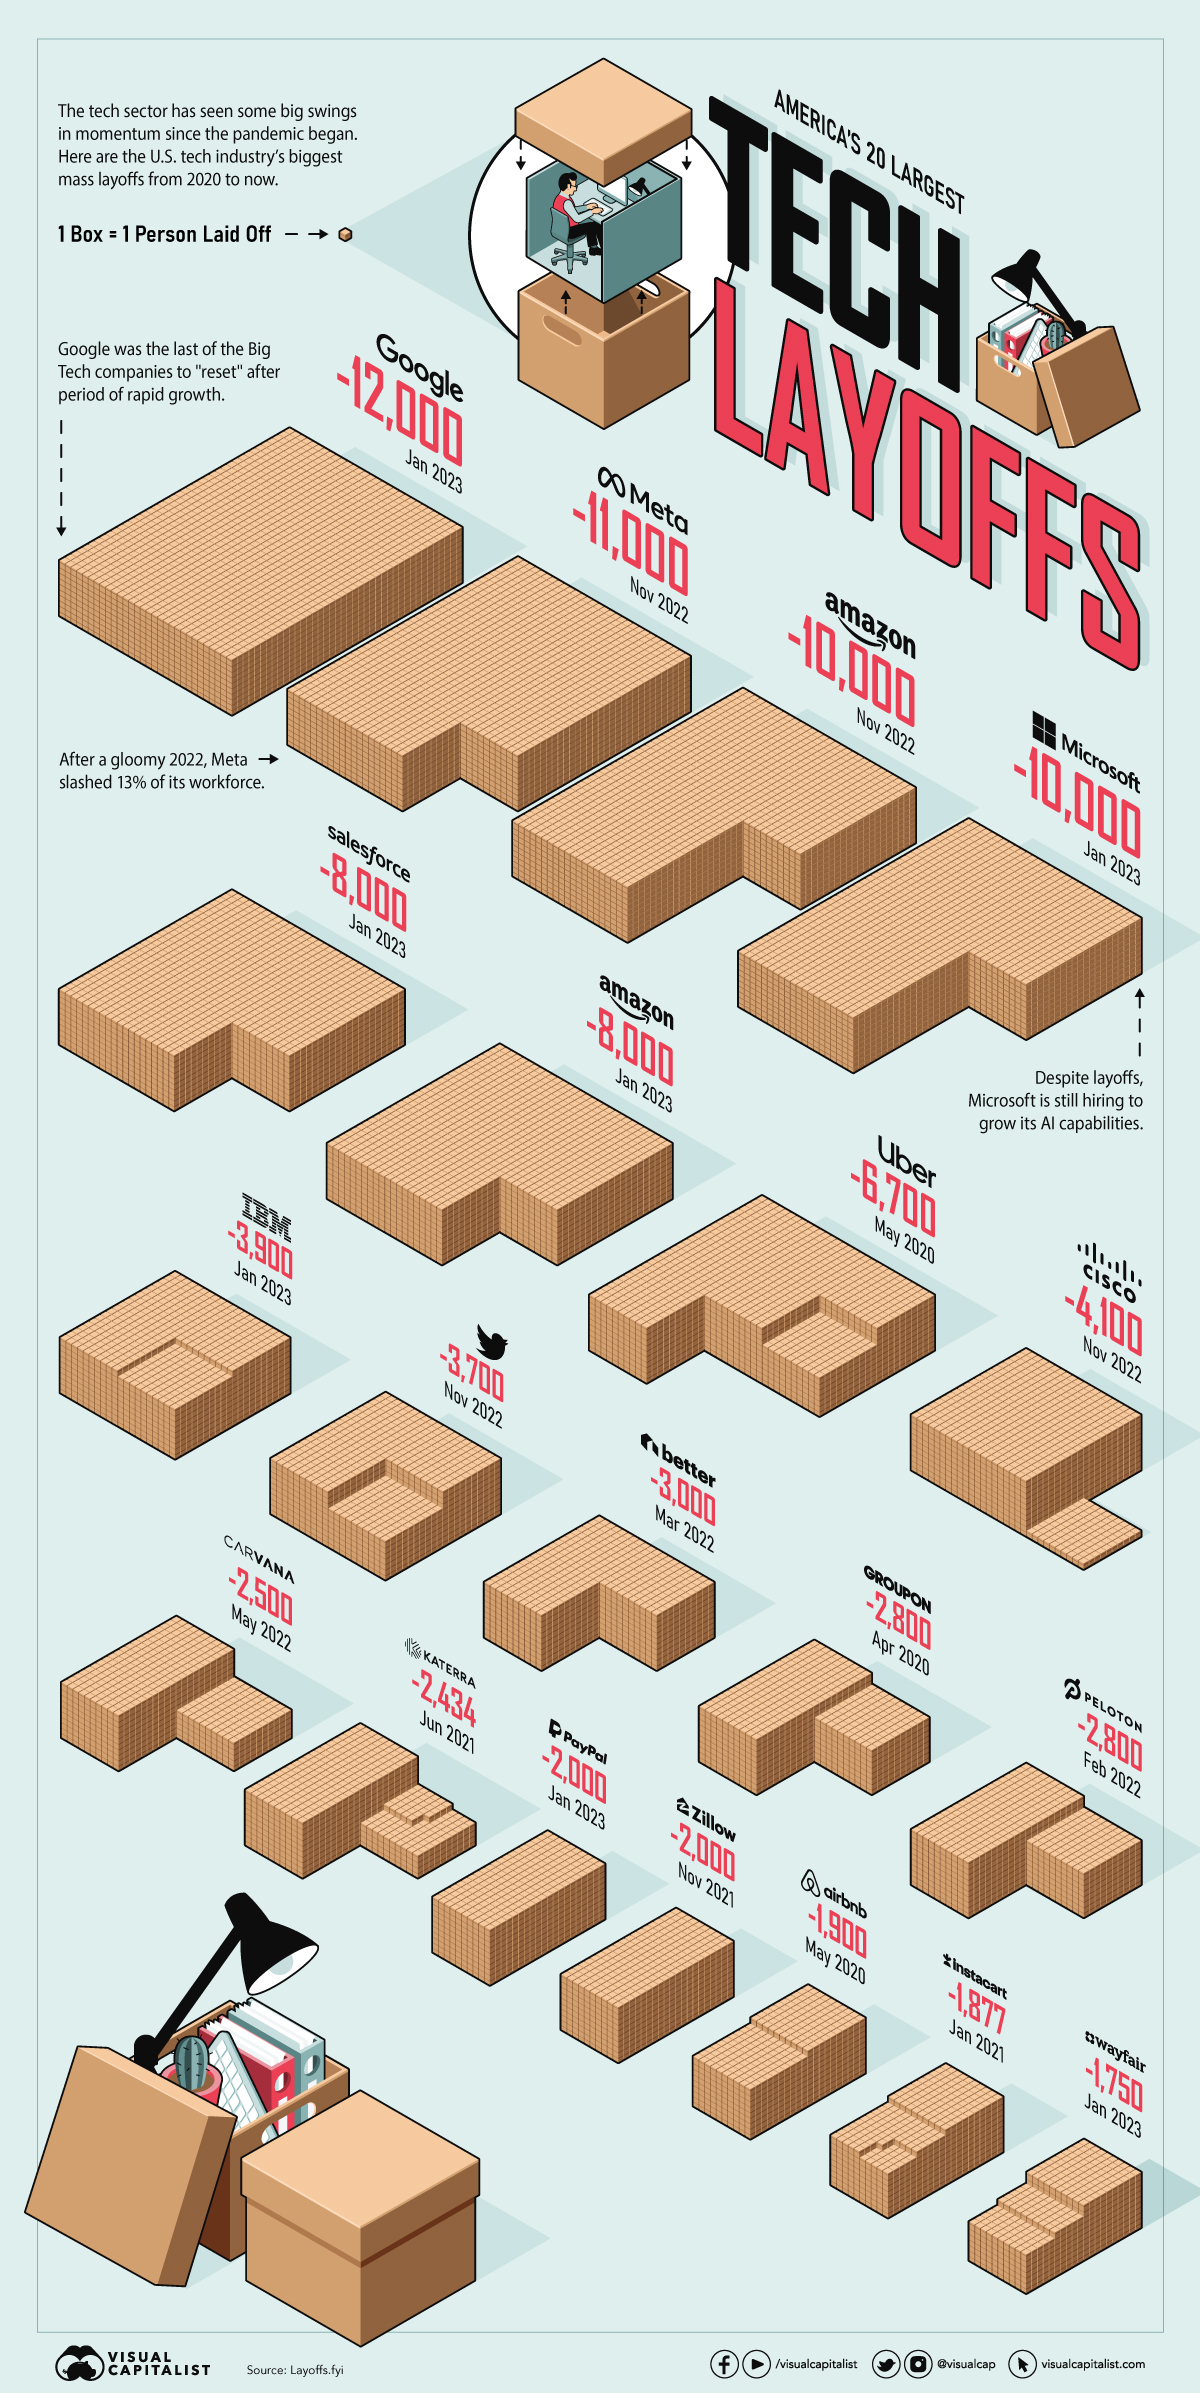
Alphabet, Google’s parent company, essentially laid off the equivalent of a small town just weeks ago, letting go of 12,000 people—the biggest layoffs the company has ever seen in its history. Additionally, Amazon and Microsoft have also laid off 10,000 workers each in the last few months, not to mention Meta’s 11,000.
This visual puts the current layoffs in the tech industry in context and ranks the 20 biggest tech layoffs of the 2020s using data from the tracker, Layoffs.fyi.
The Top 20 Layoffs of the 2020s
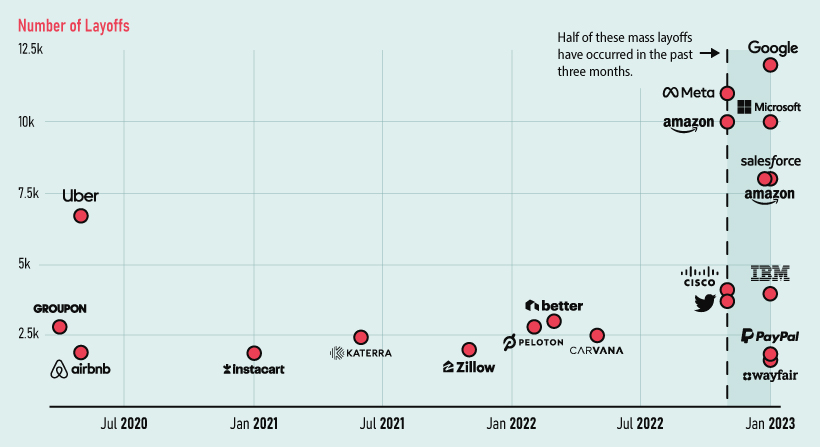
Since 2020, layoffs in the tech industry have been significant, accelerating in 2022 in particular. Here’s a look at the companies that laid off the most people over the last three years.
| Rank | Company | # Laid Off | % of Workforce | As of |
|---|---|---|---|---|
| #1 | 12,000 | 6% | Jan 2023 | |
| #2 | Meta | 11,000 | 13% | Nov 2021 |
| #3 | Amazon | 10,000 | 3% | Nov 2021 |
| #4 | Microsoft | 10,000 | 5% | Jan 2023 |
| #5 | Salesforce | 8,000 | 10% | Jan 2023 |
| #6 | Amazon | 8,000 | 2% | Jan 2023 |
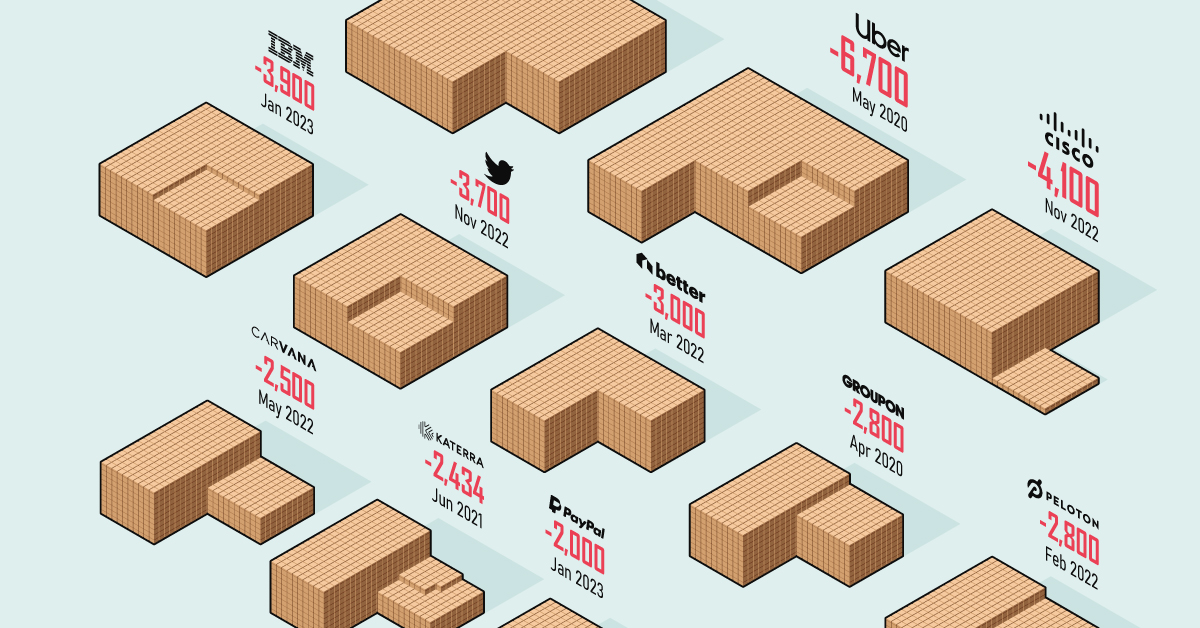
| #7 | Uber | 6,700 | 24% | May 2020 |
| #8 | Cisco | 4,100 | 5% | Nov 2021 |
| #9 | IBM | 3,900 | 2% | Jan 2023 |
| #10 | 3,700 | 50% | Nov 2022 | |
| #11 | Better.com | 3,000 | 33% | Mar 2022 |
| #12 | Groupon | 2,800 | 44% | Apr 2020 |
| #13 | Peloton | 2,800 | 20% | Feb 2022 |
| #14 | Carvana | 2,500 | 12% | May 2022 |
| #15 | Katerra | 2,434 | 100% | Jun 2021 |
| #16 | Zillow | 2,000 | 25% | Nov 2021 |
| #17 | PayPal | 2,000 | 7% | Jan 2023 |
| #18 | Airbnb | 1,900 | 25% | May 2020 |
| #19 | Instacart | 1,877 | -- | Jan 2021 |
| #20 | Wayfair | 1,750 | 10% | Jan 2023 |
Layoffs were high in 2020 thanks to the COVID-19 pandemic, halting the global economy and forcing staff reductions worldwide. After that, things were steady until the economic uncertainty of last year, which ultimately led to large-scale layoffs in tech—with many of the biggest cuts happening in the past three months.
The Cause of Layoffs
Most workforce slashings are being blamed on the impending recession. Companies are claiming they are forced to cut down the excess of the hiring boom that followed the pandemic.
Additionally, during this hiring craze competition was fierce, resulting in higher salaries for workers, which is now translating in an increased need to trim the fat thanks to the current economic conditions.
Of course, the factors leading up to these recent layoffs are more nuanced than simple over-hiring plus recession narrative. In truth, there appears to be a culture shift occurring at many of America’s tech companies. As Rani Molla and Shirin Ghaffary from Recode have astutely pointed out, tech giants really want you to know they’re behaving like scrappy startups again.
Twitter’s highly publicized headcount reduction in late 2022 occurred for reasons beyond just macroeconomic factors. Elon Musk’s goal of doing more with a smaller team seemed to resonate with other founders and executives in Silicon Valley, providing an opening for others in tech space to cut down on labor costs as well. In just one example, Mark Zuckerberg hailed 2023 as the “year of efficiency” for Meta.
Meanwhile, over at Google, 12,000 jobs were put on the chopping block as the company repositions itself to win the AI race. In the words of Google’s own CEO:
“Over the past two years we’ve seen periods of dramatic growth. To match and fuel that growth, we hired for a different economic reality than the one we face today… We have a substantial opportunity in front of us with AI across our products and are prepared to approach it boldly and responsibly.”– Sundar Pichai
The Bigger Picture in the U.S. Job Market
Beyond the tech sector, job openings continue to rise. Recent data from the Bureau of Labor Statistics (BLS) revealed a total of 11 million job openings across the U.S., an increase of almost 7% month-over-month. This means that for every unemployed worker in America right now there are 1.9 job openings available.
Additionally, hiring increased significantly in January, with employers adding 517,000 jobs. While the BLS did report a decrease in openings in information-based industries, openings are increasing rapidly especially in the food services, retail trade, and construction industries.


Technology
All of the Grants Given by the U.S. CHIPS Act
Intel, TSMC, and more have received billions in subsidies from the U.S. CHIPS Act in 2024.


All of the Grants Given by the U.S. CHIPS Act
This was originally posted on our Voronoi app. Download the app for free on iOS or Android and discover incredible data-driven charts from a variety of trusted sources.
This visualization shows which companies are receiving grants from the U.S. CHIPS Act, as of April 25, 2024. The CHIPS Act is a federal statute signed into law by President Joe Biden that authorizes $280 billion in new funding to boost domestic research and manufacturing of semiconductors.
The grant amounts visualized in this graphic are intended to accelerate the production of semiconductor fabrication plants (fabs) across the United States.
Data and Company Highlights
The figures we used to create this graphic were collected from a variety of public news sources. The Semiconductor Industry Association (SIA) also maintains a tracker for CHIPS Act recipients, though at the time of writing it does not have the latest details for Micron.
| Company | Federal Grant Amount | Anticipated Investment From Company |
|---|---|---|
| 🇺🇸 Intel | $8,500,000,000 | $100,000,000,000 |
| 🇹🇼 TSMC | $6,600,000,000 | $65,000,000,000 |
| 🇰🇷 Samsung | $6,400,000,000 | $45,000,000,000 |
| 🇺🇸 Micron | $6,100,000,000 | $50,000,000,000 |
| 🇺🇸 GlobalFoundries | $1,500,000,000 | $12,000,000,000 |
| 🇺🇸 Microchip | $162,000,000 | N/A |
| 🇬🇧 BAE Systems | $35,000,000 | N/A |
BAE Systems was not included in the graphic due to size limitations
Intel’s Massive Plans
Intel is receiving the largest share of the pie, with $8.5 billion in grants (plus an additional $11 billion in government loans). This grant accounts for 22% of the CHIPS Act’s total subsidies for chip production.
From Intel’s side, the company is expected to invest $100 billion to construct new fabs in Arizona and Ohio, while modernizing and/or expanding existing fabs in Oregon and New Mexico. Intel could also claim another $25 billion in credits through the U.S. Treasury Department’s Investment Tax Credit.
TSMC Expands its U.S. Presence
TSMC, the world’s largest semiconductor foundry company, is receiving a hefty $6.6 billion to construct a new chip plant with three fabs in Arizona. The Taiwanese chipmaker is expected to invest $65 billion into the project.
The plant’s first fab will be up and running in the first half of 2025, leveraging 4 nm (nanometer) technology. According to TrendForce, the other fabs will produce chips on more advanced 3 nm and 2 nm processes.
The Latest Grant Goes to Micron
Micron, the only U.S.-based manufacturer of memory chips, is set to receive $6.1 billion in grants to support its plans of investing $50 billion through 2030. This investment will be used to construct new fabs in Idaho and New York.

-

 Debt1 week ago
How Debt-to-GDP Ratios Have Changed Since 2000
-

 Markets2 weeks ago
Ranked: The World’s Top Flight Routes, by Revenue
-

 Countries2 weeks ago
Population Projections: The World’s 6 Largest Countries in 2075
-

 Markets2 weeks ago
The Top 10 States by Real GDP Growth in 2023
-

 Demographics2 weeks ago
The Smallest Gender Wage Gaps in OECD Countries
-

 United States2 weeks ago
Where U.S. Inflation Hit the Hardest in March 2024
-

 Green2 weeks ago
Top Countries By Forest Growth Since 2001
-

 United States2 weeks ago
Ranked: The Largest U.S. Corporations by Number of Employees