Markets
All of the World’s Money and Markets in One Visualization (2022)


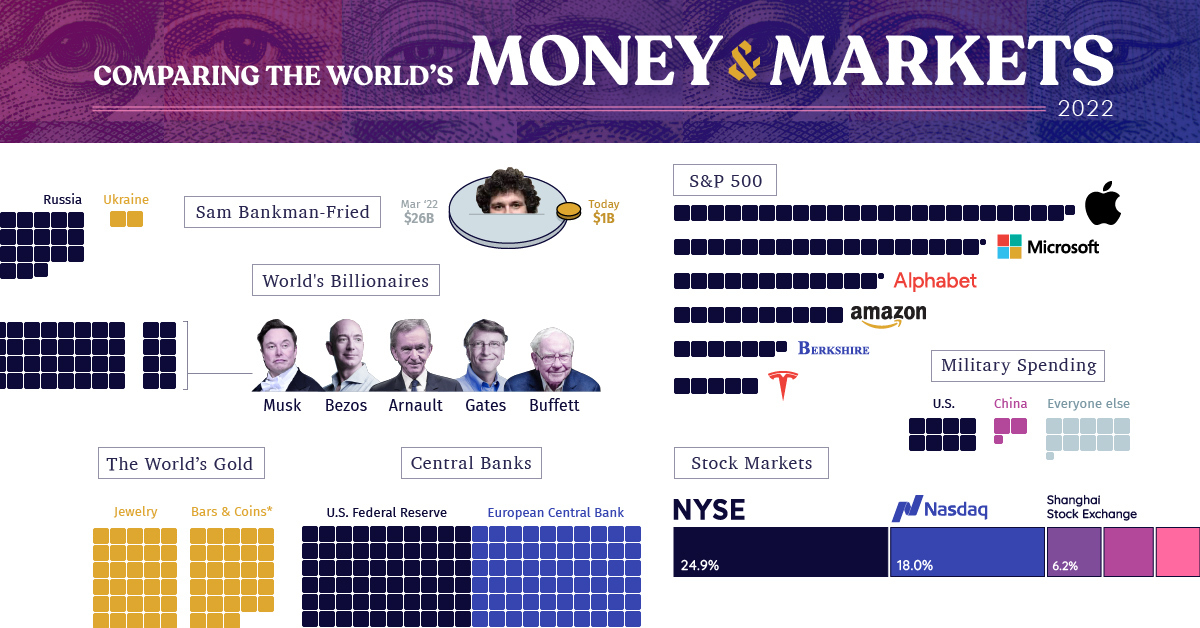
All of the World’s Money and Markets in One Visualization
The era of easy money is now officially over.
For 15 years, policymakers have tried to stimulate the global economy through money creation, zero interest-rate policies, and more recently, aggressive COVID fiscal stimulus.
With capital at near-zero costs over this stretch, investors started to place more value on cash flows in the distant future. Assets inflated and balance sheets expanded, and money inevitably chased more speculative assets like NFTs, crypto, or unproven venture-backed startups.
But the free money party has since ended, after persistent inflation prompted the sudden reversal of many of these policies. And as Warren Buffett says, it’s only when the tide goes out do you get to see “who’s been swimming naked.”
Measuring Money and Markets in 2022
Every time we publish this visualization, our common unit of measurement is a two-dimensional box with a value of $100 billion.
Even though you need many of these to convey the assets on the balance sheet of the U.S. Federal Reserve, or the private wealth held by the world’s billionaires, it’s quite amazing to think what actually fits within this tiny building block of measurement:
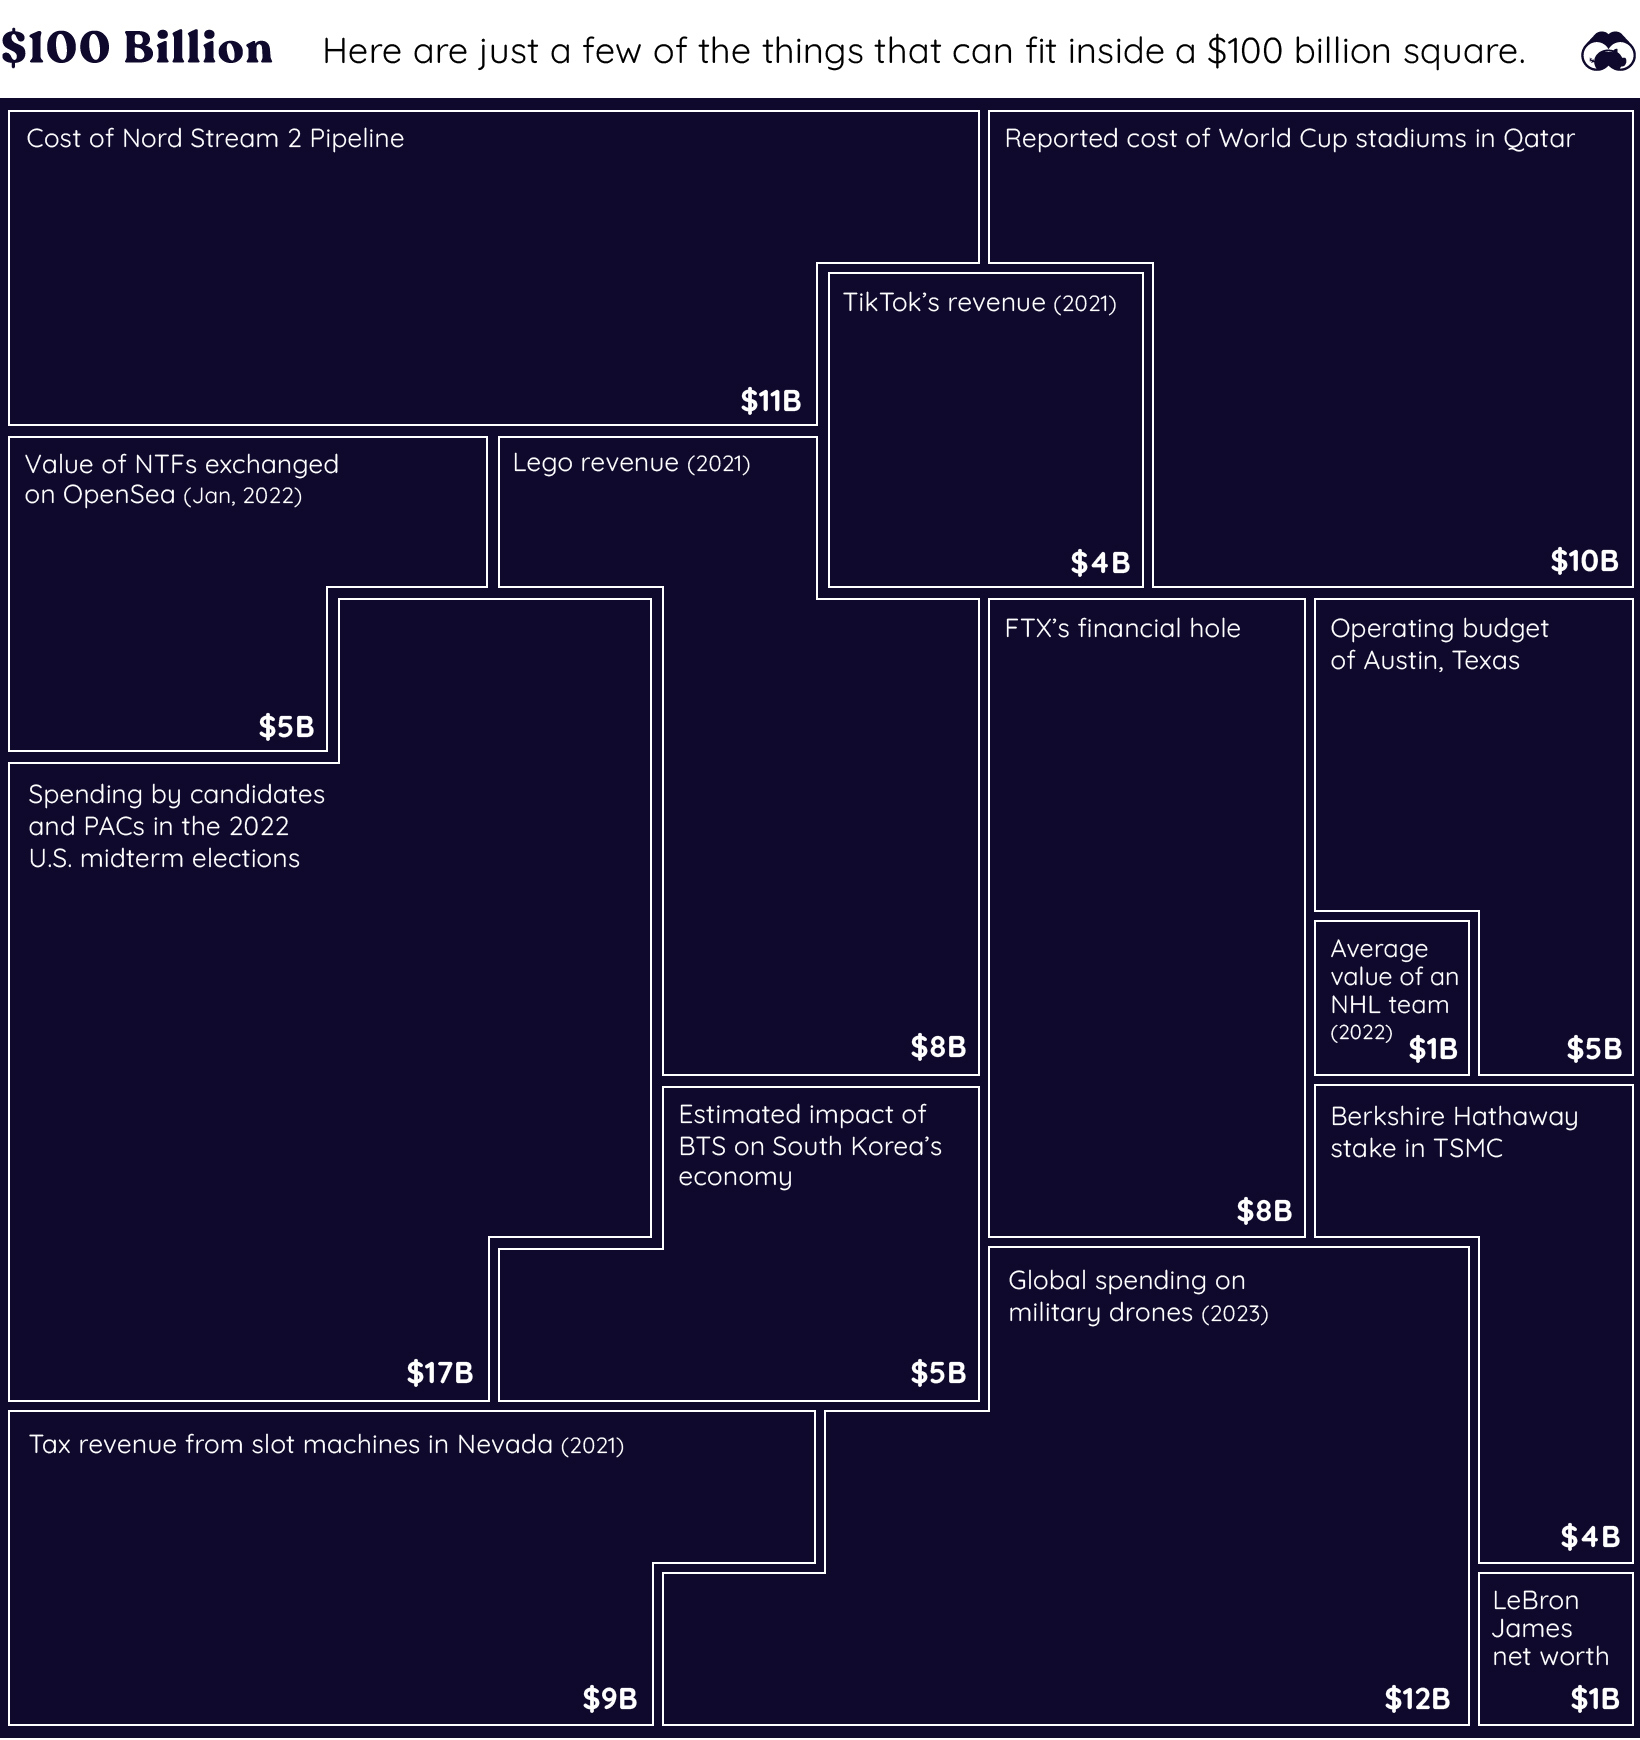
Our little unit of measurement is enough to pay for the construction of the Nord Stream 2 pipeline, while also buying every team in the NHL and digging FTX out of its financial hole several times over.
Here’s an overview of all the items we have listed in this year’s visualization:
| Asset category | Value | Source | Notes |
|---|---|---|---|
| SBF (Peak Net Worth) | $26 billion | Bloomberg | Now sits at <$1B |
| Pro Sports Teams | $340 billion | Forbes | Major pro teams in North America |
| Cryptocurrency | $760 billion | CoinMarketCap | Peaked at $2.8T in 2021 |
| Ukraine GDP | $130 billion | World Bank | Comparable to GDP of Mississippi |
| Russia GDP | $1.8 trillion | World Bank | The world's 11th largest economy |
| Annual Military Spending | $2.1 trillion | SIPRI | 2021 data |
| Physical currency | $8.0 trillion | BIS | 2020 data |
| Gold | $11.5 trillion | World Gold Council | There are 205,238 tonnes of gold in existence |
| Billionaires | $12.7 trillion | Forbes | Sum of fortunes of all 2,668 billionaires |
| Central Bank Assets | $28.0 trillion | Trading Economics | Fed, BoJ, Bank of China, and Eurozone only |
| S&P 500 | $36.0 trillion | Slickcharts | Nov 20, 2022 |
| China GDP | $17.7 trillion | World Bank | |
| U.S. GDP | $23.0 trillion | World Bank | |
| Narrow Money Supply | $49.0 trillion | Trading Economics | Includes US, China, Euro Area, Japan only |
| Broad Money Supply | $82.7 trillion | Trading Economics | Includes US, China, Euro Area, Japan only |
| Global Equities | $95.9 trillion | WFE | Latest available 2022 data |
| Global Debt | $300.1 trillion | IIF | Q2 2022 |
| Global Real Estate | $326.5 trillion | Savills | 2020 data |
| Global Private Wealth | $463.6 trillion | Credit Suisse | 2022 report |
| Derivatives (Market) | $12.4 trillion | BIS | |
| Derivatives (Notional) | $600 trillion | BIS |
Has the Dust Settled Yet?
Through previous editions of our All the World’s Money and Markets visualization, we’ve created snapshots of the world’s assets and markets at different points in time.
For example, in our 2017 edition of this visualization, Apple’s market capitalization was only $807 billion, and all crypto assets combined for $173 billion. The global debt total was at $215 trillion.
| Asset | 2017 edition | 2022 edition | Change (%) |
|---|---|---|---|
| Apple market cap | $807 billion | $2.3 trillion | +185% |
| Crypto | $173 billion | $760 billion | +339% |
| Fed Balance Sheet | $4.5 trillion | $8.7 trillion | +93% |
| Stock Markets | $73 trillion | $95.9 trillion | +31% |
| Global Debt | $215 trillion | $300 trillion | +40% |
And in just five years, Apple nearly quadrupled in size (it peaked at $3 trillion in January 2022), and crypto also expanded into a multi-trillion dollar market until it was brought back to Earth through the 2022 crash and subsequent FTX implosion.
Meanwhile, global debt continues to accumulate—growing by $85 trillion in the five-year period.
With interest rates expected to continue to rise, companies making cost cuts, and policymakers reining in spending and borrowing, today is another unique snapshot in time.
Now that the easy money era is over, where do things go from here?


Markets
Visualizing Global Inflation Forecasts (2024-2026)
Here are IMF forecasts for global inflation rates up to 2026, highlighting a slow descent of price pressures amid resilient global growth.


Visualizing Global Inflation Forecasts (2024-2026)
Global inflation rates are gradually descending, but progress has been slow.
Today, the big question is if inflation will decline far enough to trigger easing monetary policy. So far, the Federal Reserve has held rates for nine months amid stronger than expected core inflation, which excludes volatile energy and food prices.
Yet looking further ahead, inflation forecasts from the International Monetary Fund (IMF) suggest that inflation will decline as price pressures ease, but the path of disinflation is not without its unknown risks.
This graphic shows global inflation forecasts, based on data from the April 2024 IMF World Economic Outlook.
Get the Key Insights of the IMF’s World Economic Outlook
Want a visual breakdown of the insights from the IMF’s 2024 World Economic Outlook report?
This visual is part of a special dispatch of the key takeaways exclusively for VC+ members.
Get the full dispatch of charts by signing up to VC+.
The IMF’s Inflation Outlook
Below, we show the IMF’s latest projections for global inflation rates through to 2026:
| Year | Global Inflation Rate (%) | Advanced Economies Inflation Rate (%) | Emerging Market and Developing Economies Inflation Rate (%) |
|---|---|---|---|
| 2019 | 3.5 | 1.4 | 5.1 |
| 2020 | 3.2 | 0.7 | 5.2 |
| 2021 | 4.7 | 3.1 | 5.9 |
| 2022 | 8.7 | 7.3 | 9.8 |
| 2023 | 6.8 | 4.6 | 8.3 |
| 2024 | 5.9 | 2.6 | 8.3 |
| 2025 | 4.5 | 2.0 | 6.2 |
| 2026 | 3.7 | 2.0 | 4.9 |
After hitting a peak of 8.7% in 2022, global inflation is projected to fall to 5.9% in 2024, reflecting promising inflation trends amid resilient global growth.
While inflation has largely declined due to falling energy and goods prices, persistently high services inflation poses challenges to mitigating price pressures. In addition, the IMF highlights the potential risk of an escalating conflict in the Middle East, which could lead to energy price shocks and higher shipping costs.
These developments could negatively affect inflation scenarios and prompt central banks to adopt tighter monetary policies. Overall, by 2026, global inflation is anticipated to decline to 3.7%—still notably above the 2% target set by several major economies.
Adding to this, we can see divergences in the path of inflation between advanced and emerging economies. While affluent nations are forecast to see inflation edge closer to the 2% target by 2026, emerging economies are projected to have inflation rates reach 4.9%—falling closer to their pre-pandemic averages.
Get the Full Analysis of the IMF’s Outlook on VC+
This visual is part of an exclusive special dispatch for VC+ members which breaks down the key takeaways from the IMF’s 2024 World Economic Outlook.
For the full set of charts and analysis, sign up for VC+.

-

 Culture6 days ago
The World’s Top Media Franchises by All-Time Revenue
-

 Science2 weeks ago
Visualizing the Average Lifespans of Mammals
-

 Brands2 weeks ago
How Tech Logos Have Evolved Over Time
-

 Energy2 weeks ago
Ranked: The Top 10 EV Battery Manufacturers in 2023
-

 Countries2 weeks ago
Countries With the Largest Happiness Gains Since 2010
-

 Economy2 weeks ago
VC+: Get Our Key Takeaways From the IMF’s World Economic Outlook
-

 Demographics1 week ago
The Countries That Have Become Sadder Since 2010
-

 Money1 week ago
Charted: Who Has Savings in This Economy?