Markets
The 8 Ways Urban Demographics are Changing
The 8 Ways Urban Demographics are Changing
Cities are what keep the global economic machine humming.
Over 80% of the world’s economic output is derived from activities in cities – and more specifically, it’s estimated that 60% of GDP growth occurs in just the top 600 urban centers.
Given the above, it’s fair to say that the destiny of humankind is directly linked to what happens in major cities. Further, how urbanization plays out over time could end up having a significant ripple effect on the economy, and we should pay close attention to such trends.
Urbanization 2.0
Today’s infographic comes to us from Raconteur, and it showcases eight different ways that urban demographics are evolving.
Below we will summarize the changes, along with potential impacts on the economy:
1. A Higher Percentage of Urban Dwellers
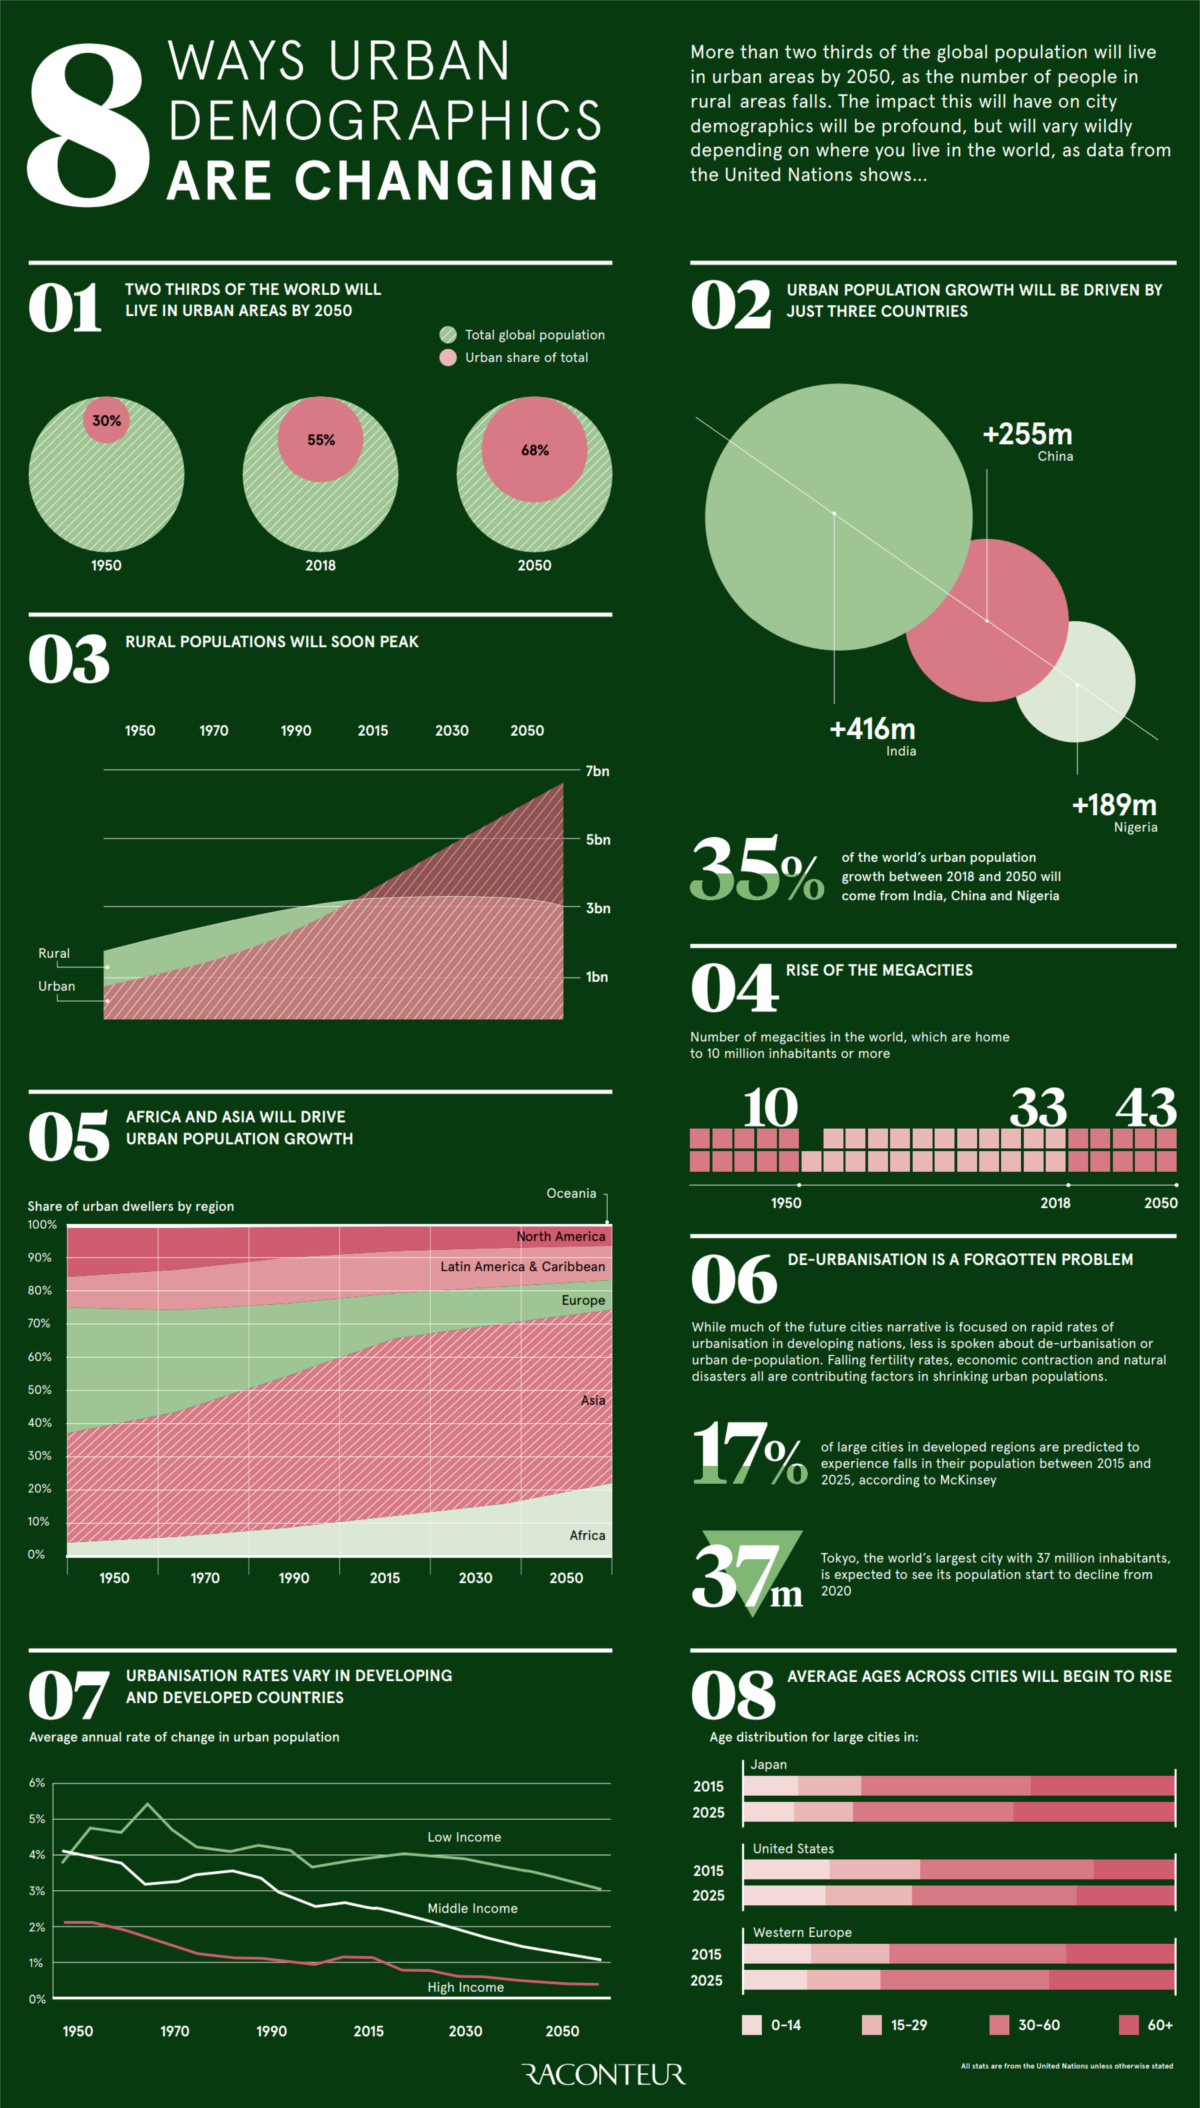
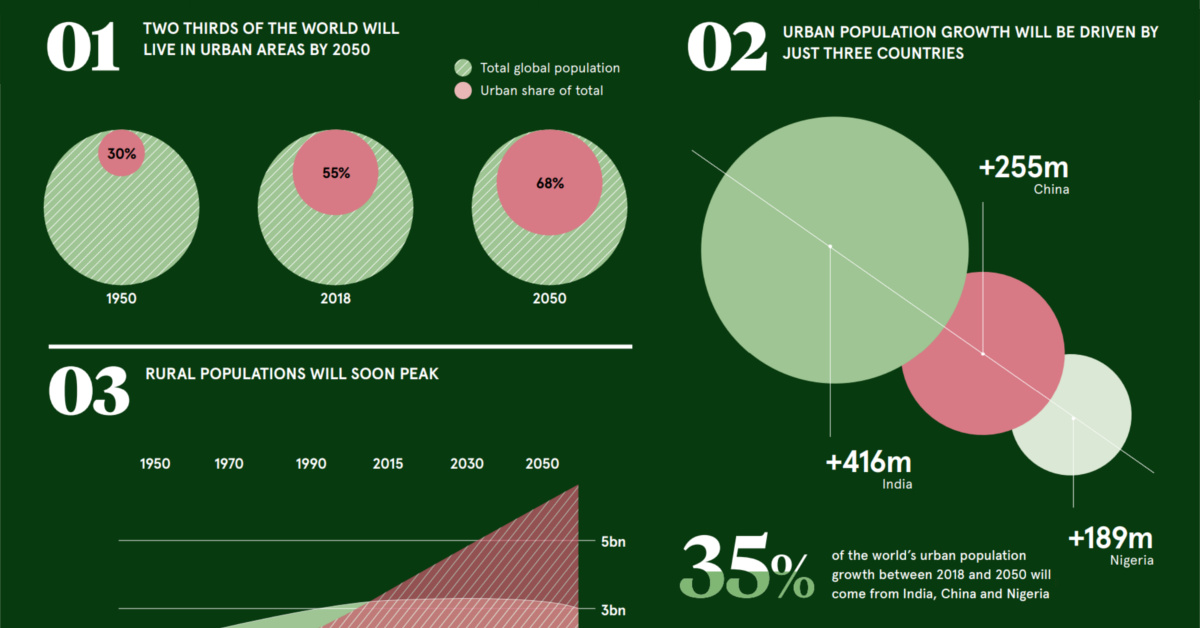
Between 1950 and 2018, we went from 30% to 55% of the world’s population living in cities. This has been driven largely by today’s middle and high income economies in places like North America, South America, Europe, and Japan.
The next stage of urbanization will see us move to 68% – more than two-thirds of the world’s population – living in these urban conglomerations. It will be driven by countries in developing markets, creating a potent investing megatrend along the way.
2. The Countries Driving Growth
It’s estimated that three countries will combine for 35% of all urban population growth.
| Rank | Country | Growth in Urban Population (2018-2050) | % of Global Urban Growth |
|---|---|---|---|
| #1 | India | 416 million people | 17% |
| #2 | China | 255 million people | 10% |
| #3 | Nigeria | 189 million people | 8% |
| World | 860 million people | 35% |
In total, there will be 2.5 billion more urban dwellers in 2050 than there are today. Many of these people will experience rising incomes in cities, increasing the global middle class to an unprecedented size.
3. Peaking Rural Populations
On the flipside, it appears the world’s rural population has nearly flatlined, with anticipation that it will peak in absolute terms in the next couple of years. Rural populations have been slowly growing since 1950 until this point.
4. The Rise of Megacities
There will be 43 megacities by the year 2050, which is more than quadruple the amount that existed back in 1950.
The changing geography of the world’s megacities will be one of the major forces that shapes the future of the global economy and accompanying investment trends.
5. New Population Centers
By 2050, more than 70% of the world’s urban population will live in Asia or Africa. Meanwhile, North America and Europe will combine for closer to 15% of that total.
6. De-Urbanization
The role of de-urbanization is often downplayed or forgot about when discussing urban demographics, but it is an interesting issue.
Factors such as falling fertility rates, economic contraction, and natural disasters are actually shrinking the size of some cities. In fact, McKinsey predicts that 17% of cities in developed regions will see a drop in population between 2015-2025.
7. Disparities in Urban Growth
The rate for urban population growth is actually trending down across all types of economies – however, these rates come from very different starting points.
High income countries are currently averaging growth of less than 1% per year, and this will continue to decline to below 0.5% per year by 2050. Over the same time period, low income nations will go from 4% to 3% per year.
8. Changes in Average Age
The age distributions in large cities within developed nations will begin to skew older, something we’ve shown previously when looking at the median age of every continent.
The biggest impact here may be felt on dependency ratios in the workforce. With a smaller pipeline of new workforce entrants and a burgeoning population of seniors, this changing ratio is one of the most significant stories impacting urban demographics.


Markets
Mapped: Europe’s GDP Per Capita, by Country
Which European economies are richest on a GDP per capita basis? This map shows the results for 44 countries across the continent.


Mapped: Europe’s GDP Per Capita, by Country (2024)
This was originally posted on our Voronoi app. Download the app for free on iOS or Android and discover incredible data-driven charts from a variety of trusted sources.
Europe is home to some of the largest and most sophisticated economies in the world. But how do countries in the region compare with each other on a per capita productivity basis?
In this map, we show Europe’s GDP per capita levels across 44 nations in current U.S. dollars. Data for this visualization and article is sourced from the International Monetary Fund (IMF) via their DataMapper tool, updated April 2024.
Europe’s Richest and Poorest Nations, By GDP Per Capita
Luxembourg, Ireland, and Switzerland, lead the list of Europe’s richest nations by GDP per capita, all above $100,000.
| Rank | Country | GDP Per Capita (2024) |
|---|---|---|
| 1 | 🇱🇺 Luxembourg | $131,380 |
| 2 | 🇮🇪 Ireland | $106,060 |
| 3 | 🇨🇭 Switzerland | $105,670 |
| 4 | 🇳🇴 Norway | $94,660 |
| 5 | 🇮🇸 Iceland | $84,590 |
| 6 | 🇩🇰 Denmark | $68,900 |
| 7 | 🇳🇱 Netherlands | $63,750 |
| 8 | 🇸🇲 San Marino | $59,410 |
| 9 | 🇦🇹 Austria | $59,230 |
| 10 | 🇸🇪 Sweden | $58,530 |
| 11 | 🇧🇪 Belgium | $55,540 |
| 12 | 🇫🇮 Finland | $55,130 |
| 13 | 🇩🇪 Germany | $54,290 |
| 14 | 🇬🇧 UK | $51,070 |
| 15 | 🇫🇷 France | $47,360 |
| 16 | 🇦🇩 Andorra | $44,900 |
| 17 | 🇲🇹 Malta | $41,740 |
| 18 | 🇮🇹 Italy | $39,580 |
| 19 | 🇨🇾 Cyprus | $37,150 |
| 20 | 🇪🇸 Spain | $34,050 |
| 21 | 🇸🇮 Slovenia | $34,030 |
| 22 | 🇪🇪 Estonia | $31,850 |
| 23 | 🇨🇿 Czech Republic | $29,800 |
| 24 | 🇵🇹 Portugal | $28,970 |
| 25 | 🇱🇹 Lithuania | $28,410 |
| 26 | 🇸🇰 Slovakia | $25,930 |
| 27 | 🇱🇻 Latvia | $24,190 |
| 28 | 🇬🇷 Greece | $23,970 |
| 29 | 🇭🇺 Hungary | $23,320 |
| 30 | 🇵🇱 Poland | $23,010 |
| 31 | 🇭🇷 Croatia | $22,970 |
| 32 | 🇷🇴 Romania | $19,530 |
| 33 | 🇧🇬 Bulgaria | $16,940 |
| 34 | 🇷🇺 Russia | $14,390 |
| 35 | 🇹🇷 Türkiye | $12,760 |
| 36 | 🇲🇪 Montenegro | $12,650 |
| 37 | 🇷🇸 Serbia | $12,380 |
| 38 | 🇦🇱 Albania | $8,920 |
| 39 | 🇧🇦 Bosnia & Herzegovina | $8,420 |
| 40 | 🇲🇰 North Macedonia | $7,690 |
| 41 | 🇧🇾 Belarus | $7,560 |
| 42 | 🇲🇩 Moldova | $7,490 |
| 43 | 🇽🇰 Kosovo | $6,390 |
| 44 | 🇺🇦 Ukraine | $5,660 |
| N/A | 🇪🇺 EU Average | $44,200 |
Note: Figures are rounded.
Three Nordic countries (Norway, Iceland, Denmark) also place highly, between $70,000-90,000. Other Nordic peers, Sweden and Finland rank just outside the top 10, between $55,000-60,000.
Meanwhile, Europe’s biggest economies in absolute terms, Germany, UK, and France, rank closer to the middle of the top 20, with GDP per capitas around $50,000.
Finally, at the end of the scale, Eastern Europe as a whole tends to have much lower per capita GDPs. In that group, Ukraine ranks last, at $5,660.
A Closer Look at Ukraine
For a broader comparison, Ukraine’s per capita GDP is similar to Iran ($5,310), El Salvador ($5,540), and Guatemala ($5,680).
According to experts, Ukraine’s economy has historically underperformed to expectations. After the fall of the Berlin Wall, the economy contracted for five straight years. Its transition to a Western, liberalized economic structure was overshadowed by widespread corruption, a limited taxpool, and few revenue sources.
Politically, its transformation from authoritarian regime to civil democracy has proved difficult, especially when it comes to institution building.
Finally, after the 2022 invasion of the country, Ukraine’s GDP contracted by 30% in a single year—the largest loss since independence. Large scale emigration—to the tune of six million refugees—is also playing a role.
Despite these challenges, the country’s economic growth has somewhat stabilized while fighting continues.

-

 Markets5 days ago
Mapped: The Most Valuable Company in Each Southeast Asian Country
-

 Markets2 weeks ago
The Top Private Equity Firms by Country
-

 Jobs2 weeks ago
The Best U.S. Companies to Work for According to LinkedIn
-

 Economy2 weeks ago
Ranked: The Top 20 Countries in Debt to China
-

 Politics1 week ago
Charted: Trust in Government Institutions by G7 Countries
-

 Energy1 week ago
Mapped: The Age of Energy Projects in Interconnection Queues, by State
-

 Mining1 week ago
Visualizing Global Gold Production in 2023
-

 Markets1 week ago
Visualized: Interest Rate Forecasts for Advanced Economies