Markets
30 Years of Gun Manufacturing in America


30 Years of Gun Manufacturing in America
While gun sales have been brisk in recent years, the uncertainty surrounding COVID-19 was a boon for the gun industry.
From 2010-2019, an average of 13 million guns were sold legally in the U.S. each year. In 2020 and 2021, annual gun sales sharply increased to 20 million.
While the U.S. does import millions of weapons each year, a large amount of firearms sold in the country were produced domestically. Let’s dig into the data behind the multi-billion dollar gun manufacturing industry in America.
Gun Manufacturing in the United States
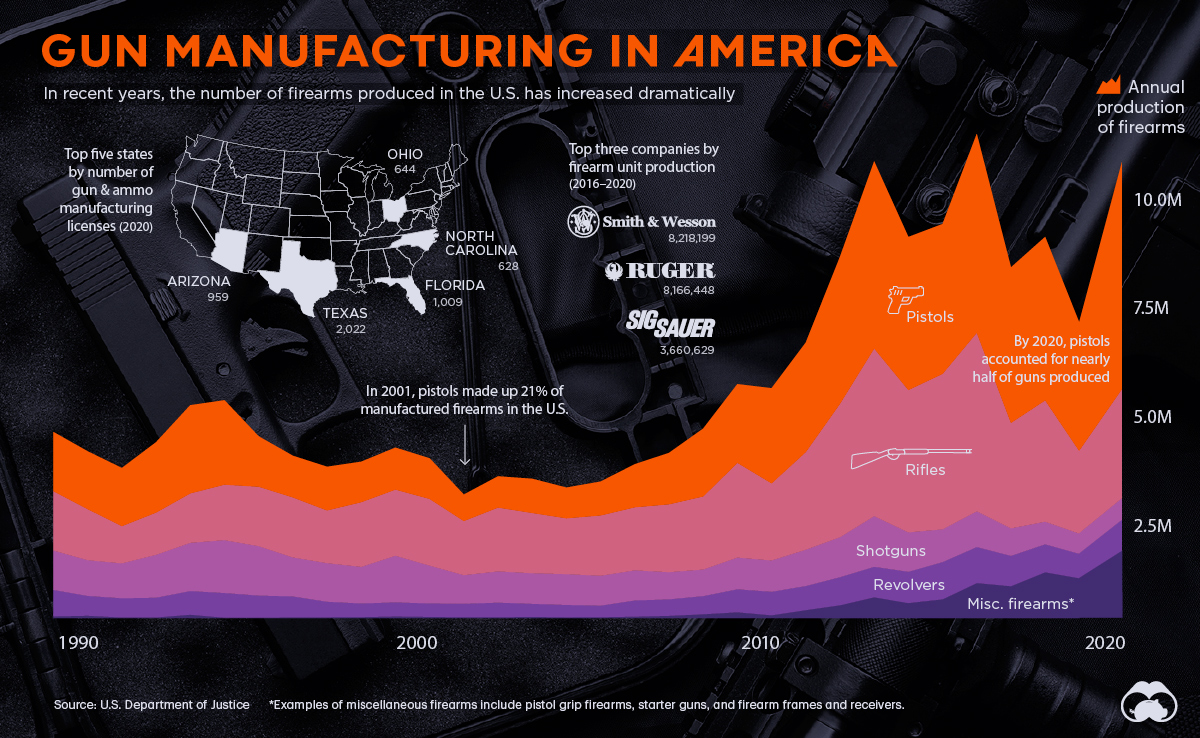
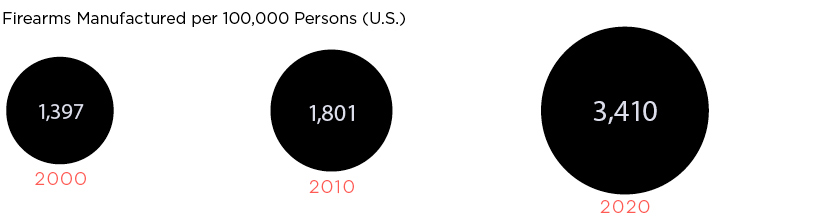
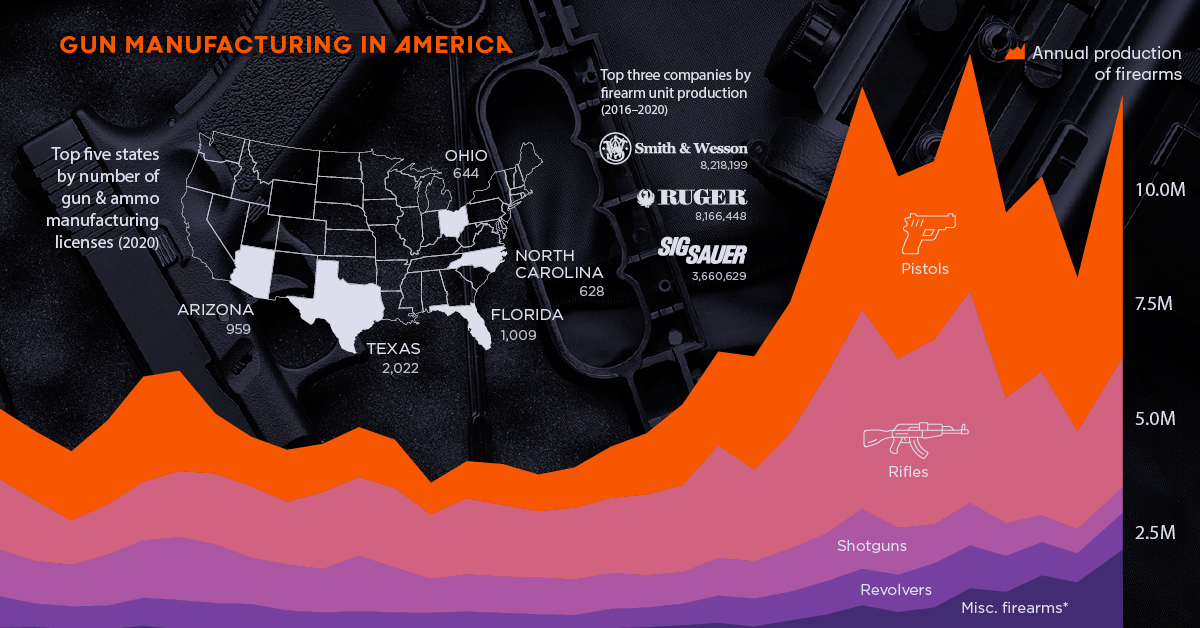
According to a recent report from the Bureau of Alcohol, Tobacco, Firearms and Explosives (ATF), the U.S. has produced nearly 170 million firearms over the past three decades, with production increasing sharply in recent years.
America’s gunmakers produce a wide variety of firearms, but they’re generally grouped into five categories; pistols, rifles, shotguns, revolvers, and everything else.
Below is a breakdown of firearms manufactured in the country over the past 30 years, by type:
| Year | Pistols | Rifles | Revolvers | Shotguns | Misc. Firearms | Total Firearms |
|---|---|---|---|---|---|---|
| 1989 | 1,404,753 | 1,407,400 | 628,573 | 935,541 | 42,126 | 4,418,393 |
| 1990 | 1,371,427 | 1,211,664 | 470,495 | 848,948 | 57,434 | 3,959,968 |
| 1991 | 1,378,252 | 883,482 | 456,966 | 828,426 | 15,980 | 3,563,106 |
| 1992 | 1,669,537 | 1,001,833 | 469,413 | 1,018,204 | 16,849 | 4,175,836 |
| 1993 | 2,093,362 | 1,173,694 | 562,292 | 1,144,940 | 81,349 | 5,055,637 |
| 1994 | 2,004,298 | 1,316,607 | 586,450 | 1,254,926 | 10,936 | 5,173,217 |
| 1995 | 1,195,284 | 1,411,120 | 527,664 | 1,173,645 | 8,629 | 4,316,342 |
| 1996 | 987,528 | 1,424,315 | 498,944 | 925,732 | 17,920 | 3,854,439 |
| 1997 | 1,036,077 | 1,251,341 | 370,428 | 915,978 | 19,680 | 3,593,504 |
| 1998 | 960,365 | 1,535,690 | 324,390 | 868,639 | 24,506 | 3,713,590 |
| 1999 | 995,446 | 1,569,685 | 335,784 | 1,106,995 | 39,837 | 4,047,747 |
| 2000 | 962,901 | 1,583,042 | 318,960 | 898,442 | 30,196 | 3,793,541 |
| 2001 | 626,836 | 1,284,554 | 320,143 | 679,813 | 21,309 | 2,932,655 |
| 2002 | 741,514 | 1,515,286 | 347,070 | 741,325 | 21,700 | 3,366,895 |
| 2003 | 811,660 | 1,430,324 | 309,364 | 726,078 | 30,978 | 3,308,404 |
| 2004 | 728,511 | 1,325,138 | 294,099 | 731,769 | 19,508 | 3,099,025 |
| 2005 | 803,425 | 1,431,372 | 274,205 | 709,313 | 23,179 | 3,241,494 |
| 2006 | 1,021,260 | 1,496,505 | 385,069 | 714,618 | 35,872 | 3,653,324 |
| 2007 | 1,219,664 | 1,610,923 | 391,334 | 645,231 | 55,461 | 3,922,613 |
| 2008 | 1,609,381 | 1,734,536 | 431,753 | 630,710 | 92,564 | 4,498,944 |
| 2009 | 1,868,258 | 2,248,851 | 547,195 | 752,699 | 138,815 | 5,555,818 |
| 2010 | 2,258,450 | 1,830,556 | 558,927 | 743,378 | 67,929 | 5,459,240 |
| 2011 | 2,598,133 | 2,318,088 | 572,857 | 862,401 | 190,407 | 6,541,886 |
| 2012 | 3,487,883 | 3,168,206 | 667,357 | 949,010 | 306,154 | 8,578,610 |
| 2013 | 4,441,726 | 3,979,570 | 725,282 | 1,203,072 | 495,142 | 10,844,792 |
| 2014 | 3,633,454 | 3,379,549 | 744,047 | 935,411 | 358,165 | 9,050,626 |
| 2015 | 3,557,199 | 3,691,799 | 885,259 | 777,273 | 447,131 | 9,358,661 |
| 2016 | 4,720,075 | 4,239,335 | 856,291 | 848,617 | 833,123 | 11,497,441 |
| 2017 | 3,691,010 | 2,504,092 | 720,917 | 653,139 | 758,634 | 8,327,792 |
| 2018 | 3,881,158 | 2,880,536 | 664,835 | 536,126 | 1,089,973 | 9,052,628 |
| 2019 | 3,046,013 | 1,957,667 | 580,601 | 480,735 | 946,929 | 7,011,945 |
| Total | 60,804,840 | 59,796,760 | 15,826,964 | 26,241,134 | 6,298,415 | 168,968,113 |
Pistols (36%) and rifles (35%) are the dominant categories, and over time, the former has become the most commonly produced firearm type.
In 2001, pistols accounted for 21% of firearms produced. Today, nearly half of all firearms produced are pistols.
Who is Producing America’s Firearms?
There are a wide variety of firearm manufacturing companies in the U.S., but production is dominated by a few key players.
Here are the top 10 gunmakers in America, which collectively make up 70% of production:
| Rank | Firearm Manufacturer | Guns Produced (2016-2020) | Share of total |
|---|---|---|---|
| 1 | Smith & Wesson Corp | 8,218,199 | 17.2% |
| 2 | Sturm, Ruger & Company, Inc | 8,166,448 | 17.1% |
| 3 | Sig Sauer Inc | 3,660,629 | 7.7% |
| 4 | Freedom Group | 3,045,427 | 6.4% |
| 5 | 0 F Mossberg & Sons Inc | 2,223,241 | 4.7% |
| 6 | Taurus International Manufacturing | 1,996,121 | 4.2% |
| 7 | WM C Anderson Inc | 1,816,625 | 3.8% |
| 8 | Glock Inc | 1,510,437 | 3.2% |
| 9 | Henry RAC Holding Corp | 1,378,544 | 2.9% |
| 10 | JIE Capital Holdings / Enterprises | 1,258,969 | 2.6% |
| Total | 33,274,640 | 69.7% |
One-third of production comes from two publicly-traded parent companies: Smith & Wesson (NASDAQ: SWBI), and Sturm, Ruger & Co. (NYSE: RGR)
Some of these players are especially dominant within certain types of firearms. For example:
- 58% of pistols were made by Smith & Wesson, Ruger, and SIG SAUER (2008–2018)
- 45% of rifles were made by Remington*, Ruger, and Smith & Wesson (2008–2018)
*In 2020, Remington filed for Chapter 11 bankruptcy protection, and its assets were divided and sold to various buyers. The Remington brand name is now owned by Vista Outdoor (NYSE: VSTO)
The Geography of Gun Manufacturing
Companies that manufacture guns hold a Type 07 license from the ATF. As of 2020, there are more than 16,000 Type 07 licensees across the United States.
Below is a state-level look at where the country’s licensees are located:
| State | Licenses (2000) | Licenses (2020) | Population | Licenses per 100,000 pop. (2020) |
|---|---|---|---|---|
| Alaska | 8 | 117 | 733,391 | 16.0 |
| Alabama | 40 | 276 | 5,039,877 | 5.5 |
| Arkansas | 28 | 302 | 3,011,524 | 10.0 |
| Arizona | 100 | 959 | 7,276,316 | 13.2 |
| California | 159 | 620 | 39,237,836 | 1.6 |
| Colorado | 27 | 481 | 5,812,069 | 8.3 |
| Connecticut | 71 | 194 | 3,605,944 | 5.4 |
| Delaware | 0 | 10 | 989,948 | 1.0 |
| Florida | 131 | 1,009 | 21,781,128 | 4.6 |
| Georgia | 52 | 510 | 10,799,566 | 4.7 |
| Hawaii | 0 | 11 | 1,455,271 | 0.8 |
| Iowa | 11 | 187 | 3,190,369 | 5.9 |
| Idaho | 38 | 358 | 1,839,106 | 19.5 |
| Illinois | 40 | 263 | 12,671,469 | 2.1 |
| Indiana | 39 | 280 | 6,805,985 | 4.1 |
| Kansas | 17 | 229 | 2,937,880 | 7.8 |
| Kentucky | 22 | 211 | 4,505,836 | 4.7 |
| Louisiana | 20 | 258 | 4,657,757 | 5.5 |
| Massachusetts | 67 | 263 | 6,984,723 | 3.8 |
| Maryland | 36 | 146 | 6,165,129 | 2.4 |
| Maine | 13 | 107 | 1,362,359 | 7.9 |
| Michigan | 43 | 386 | 10,050,811 | 3.8 |
| Minnesota | 63 | 254 | 5,707,390 | 4.5 |
| Missouri | 62 | 401 | 6,168,187 | 6.5 |
| Mississippi | 12 | 190 | 2,961,279 | 6.4 |
| Montana | 24 | 240 | 1,084,225 | 22.1 |
| North Carolina | 52 | 628 | 10,551,162 | 6.0 |
| North Dakota | 3 | 46 | 779,094 | 5.9 |
| Nebraska | 15 | 91 | 1,961,504 | 4.6 |
| New Hampshire | 25 | 188 | 1,377,529 | 13.6 |
| New Jersey | 10 | 26 | 9,267,130 | 0.3 |
| New Mexico | 18 | 179 | 2,117,522 | 8.5 |
| Nevada | 45 | 276 | 3,104,614 | 8.9 |
| New York | 35 | 299 | 19,835,913 | 1.5 |
| Ohio | 80 | 644 | 11,780,017 | 5.5 |
| Oklahoma | 37 | 423 | 3,959,353 | 10.7 |
| Oregon | 55 | 226 | 4,237,256 | 5.3 |
| Pennsylvania | 87 | 519 | 12,964,056 | 4.0 |
| Rhode Island | 1 | 20 | 1,097,379 | 1.8 |
| South Carolina | 25 | 284 | 5,190,705 | 5.5 |
| South Dakota | 14 | 79 | 886,667 | 8.9 |
| Tennessee | 76 | 352 | 6,975,218 | 5.0 |
| Texas | 150 | 2,022 | 29,527,941 | 6.8 |
| Utah | 33 | 478 | 3,271,616 | 14.6 |
| Virginia | 48 | 412 | 8,642,274 | 4.8 |
| Vermont | 15 | 85 | 643,077 | 13.2 |
| Washington | 49 | 351 | 7,738,692 | 4.5 |
| Wisconsin | 38 | 306 | 5,895,908 | 5.2 |
| West Virginia | 20 | 115 | 1,793,716 | 6.4 |
| Wyoming | 20 | 147 | 576,851 | 25.5 |
These manufacturers are located all around the country, so these numbers are somewhat reflective of population. Unsurprisingly, large states like Texas and Florida have the most licensees.
Sorting by the number of licensees per 100,000 people offers a different point of view. By this measure, Wyoming, Montana, and Idaho come out on top.
If recent sales and production trends are any indication, these numbers may only continue to grow.


Markets
The European Stock Market: Attractive Valuations Offer Opportunities
On average, the European stock market has valuations that are nearly 50% lower than U.S. valuations. But how can you access the market?


European Stock Market: Attractive Valuations Offer Opportunities
Europe is known for some established brands, from L’Oréal to Louis Vuitton. However, the European stock market offers additional opportunities that may be lesser known.
The above infographic, sponsored by STOXX, outlines why investors may want to consider European stocks.
Attractive Valuations
Compared to most North American and Asian markets, European stocks offer lower or comparable valuations.
| Index | Price-to-Earnings Ratio | Price-to-Book Ratio |
|---|---|---|
| EURO STOXX 50 | 14.9 | 2.2 |
| STOXX Europe 600 | 14.4 | 2 |
| U.S. | 25.9 | 4.7 |
| Canada | 16.1 | 1.8 |
| Japan | 15.4 | 1.6 |
| Asia Pacific ex. China | 17.1 | 1.8 |
Data as of February 29, 2024. See graphic for full index names. Ratios based on trailing 12 month financials. The price to earnings ratio excludes companies with negative earnings.
On average, European valuations are nearly 50% lower than U.S. valuations, potentially offering an affordable entry point for investors.
Research also shows that lower price ratios have historically led to higher long-term returns.
Market Movements Not Closely Connected
Over the last decade, the European stock market had low-to-moderate correlation with North American and Asian equities.
The below chart shows correlations from February 2014 to February 2024. A value closer to zero indicates low correlation, while a value of one would indicate that two regions are moving in perfect unison.
| EURO STOXX 50 | STOXX EUROPE 600 | U.S. | Canada | Japan | Asia Pacific ex. China |
|
|---|---|---|---|---|---|---|
| EURO STOXX 50 | 1.00 | 0.97 | 0.55 | 0.67 | 0.24 | 0.43 |
| STOXX EUROPE 600 | 1.00 | 0.56 | 0.71 | 0.28 | 0.48 | |
| U.S. | 1.00 | 0.73 | 0.12 | 0.25 | ||
| Canada | 1.00 | 0.22 | 0.40 | |||
| Japan | 1.00 | 0.88 | ||||
| Asia Pacific ex. China | 1.00 |
Data is based on daily USD returns.
European equities had relatively independent market movements from North American and Asian markets. One contributing factor could be the differing sector weights in each market. For instance, technology makes up a quarter of the U.S. market, but health care and industrials dominate the broader European market.
Ultimately, European equities can enhance portfolio diversification and have the potential to mitigate risk for investors.
Tracking the Market
For investors interested in European equities, STOXX offers a variety of flagship indices:
| Index | Description | Market Cap |
|---|---|---|
| STOXX Europe 600 | Pan-regional, broad market | €10.5T |
| STOXX Developed Europe | Pan-regional, broad-market | €9.9T |
| STOXX Europe 600 ESG-X | Pan-regional, broad market, sustainability focus | €9.7T |
| STOXX Europe 50 | Pan-regional, blue-chip | €5.1T |
| EURO STOXX 50 | Eurozone, blue-chip | €3.5T |
Data is as of February 29, 2024. Market cap is free float, which represents the shares that are readily available for public trading on stock exchanges.
The EURO STOXX 50 tracks the Eurozone’s biggest and most traded companies. It also underlies one of the world’s largest ranges of ETFs and mutual funds. As of November 2023, there were €27.3 billion in ETFs and €23.5B in mutual fund assets under management tracking the index.
“For the past 25 years, the EURO STOXX 50 has served as an accurate, reliable and tradable representation of the Eurozone equity market.”
— Axel Lomholt, General Manager at STOXX
Partnering with STOXX to Track the European Stock Market
Are you interested in European equities? STOXX can be a valuable partner:
- Comprehensive, liquid and investable ecosystem
- European heritage, global reach
- Highly sophisticated customization capabilities
- Open architecture approach to using data
- Close partnerships with clients
- Part of ISS STOXX and Deutsche Börse Group
With a full suite of indices, STOXX can help you benchmark against the European stock market.
Learn how STOXX’s European indices offer liquid and effective market access.

-

 Economy1 day ago
Economic Growth Forecasts for G7 and BRICS Countries in 2024
The IMF has released its economic growth forecasts for 2024. How do the G7 and BRICS countries compare?
-

 Markets1 week ago
U.S. Debt Interest Payments Reach $1 Trillion
U.S. debt interest payments have surged past the $1 trillion dollar mark, amid high interest rates and an ever-expanding debt burden.
-

 United States2 weeks ago
Ranked: The Largest U.S. Corporations by Number of Employees
We visualized the top U.S. companies by employees, revealing the massive scale of retailers like Walmart, Target, and Home Depot.
-

 Markets2 weeks ago
The Top 10 States by Real GDP Growth in 2023
This graphic shows the states with the highest real GDP growth rate in 2023, largely propelled by the oil and gas boom.
-

 Markets2 weeks ago
Ranked: The World’s Top Flight Routes, by Revenue
In this graphic, we show the highest earning flight routes globally as air travel continued to rebound in 2023.
-

 Markets2 weeks ago
Ranked: The Most Valuable Housing Markets in America
The U.S. residential real estate market is worth a staggering $47.5 trillion. Here are the most valuable housing markets in the country.


-

 Mining1 week ago
Gold vs. S&P 500: Which Has Grown More Over Five Years?
-
Markets2 weeks ago
Ranked: The Most Valuable Housing Markets in America
-

 Money2 weeks ago
Which States Have the Highest Minimum Wage in America?
-

 AI2 weeks ago
Ranked: Semiconductor Companies by Industry Revenue Share
-
Markets2 weeks ago
Ranked: The World’s Top Flight Routes, by Revenue
-

 Demographics2 weeks ago
Population Projections: The World’s 6 Largest Countries in 2075
-
Markets2 weeks ago
The Top 10 States by Real GDP Growth in 2023
-

 Demographics2 weeks ago
The Smallest Gender Wage Gaps in OECD Countries