Agriculture
202 Drought Maps of California Show How Dry It Is
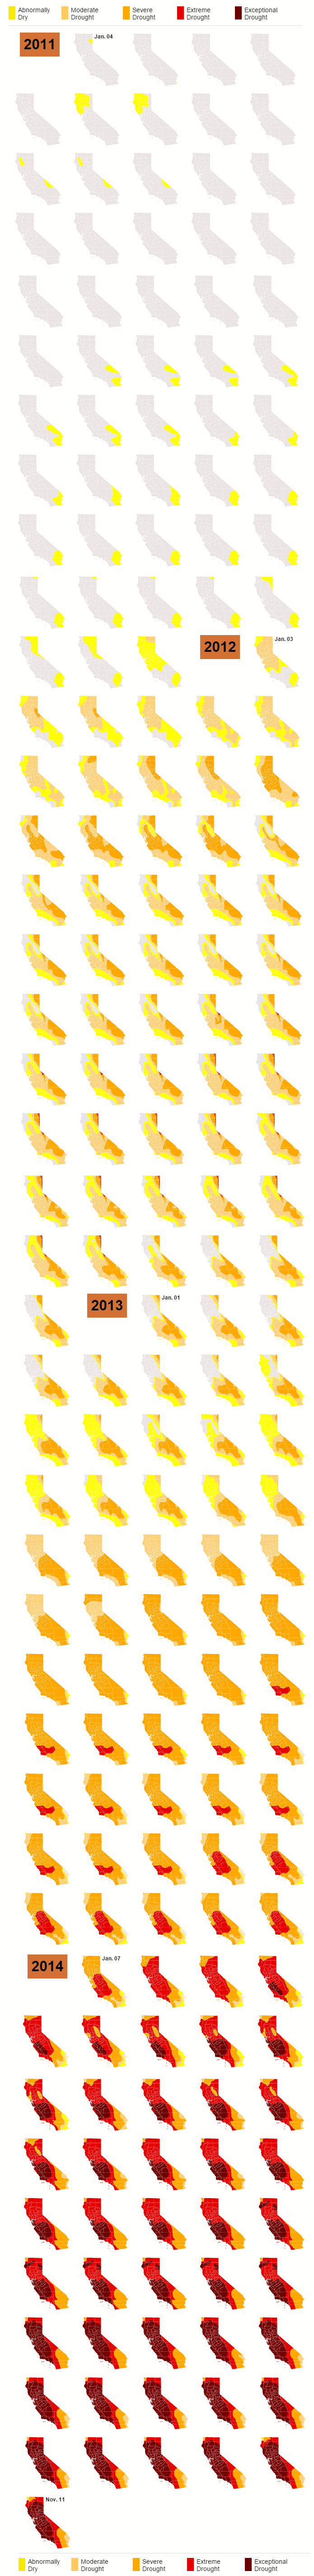
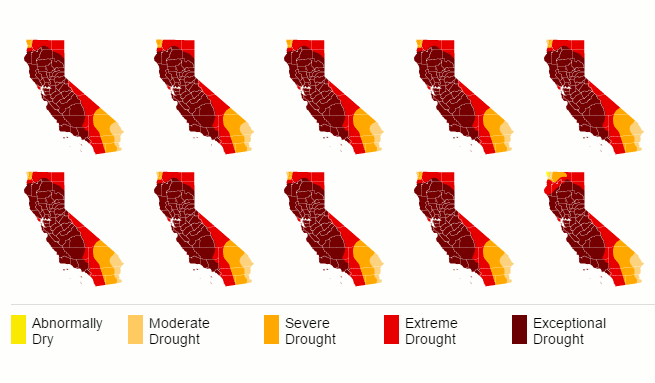
The following drought maps of California are weekly, from the beginning of 2011 to now.
202 Drought Maps of California Show How Dry It Is
If there is one thing we are tuned in here to at Visual Capitalist, it is the value of all natural resources: from metals and energy to fresh water. With population, money, and economic growth all happening at exponential rates, and only a limited amount of underlying resources, there are problems abound.
We had a previous post discussing the possibility of Peak Water as well, and it is something we are also addressing in our editorial calendar with an upcoming original infographic series on overpopulation.
California has been the victim of years of drought now, and it has cost the state dearly. It’s expected to cost , with the loss of 17,000 jobs as farmers must fallow their regular cash crops.
The Week published an interesting excerpt about the impact of the drought on California aquifers and infrastructure:
The drought has prompted farmers to race to drill wells into the Central Valley’s aquifers and access the underground water reserves. “He with the biggest pump or deepest straw wins,” says Felicia Marcus, chair of the state’s water board. But though this groundwater will replace about three quarters of the current deficit from rivers and streams, pumping is certainly not a sustainable solution to the crisis: Sucking water out of aquifers has caused the ground to compact and sink almost a foot a year in some regions of the San Joaquin Valley, causing $1.3 billion of infrastructure damage to roads, bridges, and pipelines. Worse, these depleted aquifers can take decades to replenish.
Nearly 75% of all California fresh water comes from the Sierra Nevada snowpack, and right now it is reduced to only about 20% of its usual size.
Sadly, we expect fresh water problems to be more common in the future as aquifers get depleted and climate changes happen.
Original graphic from: The LA Times


Markets
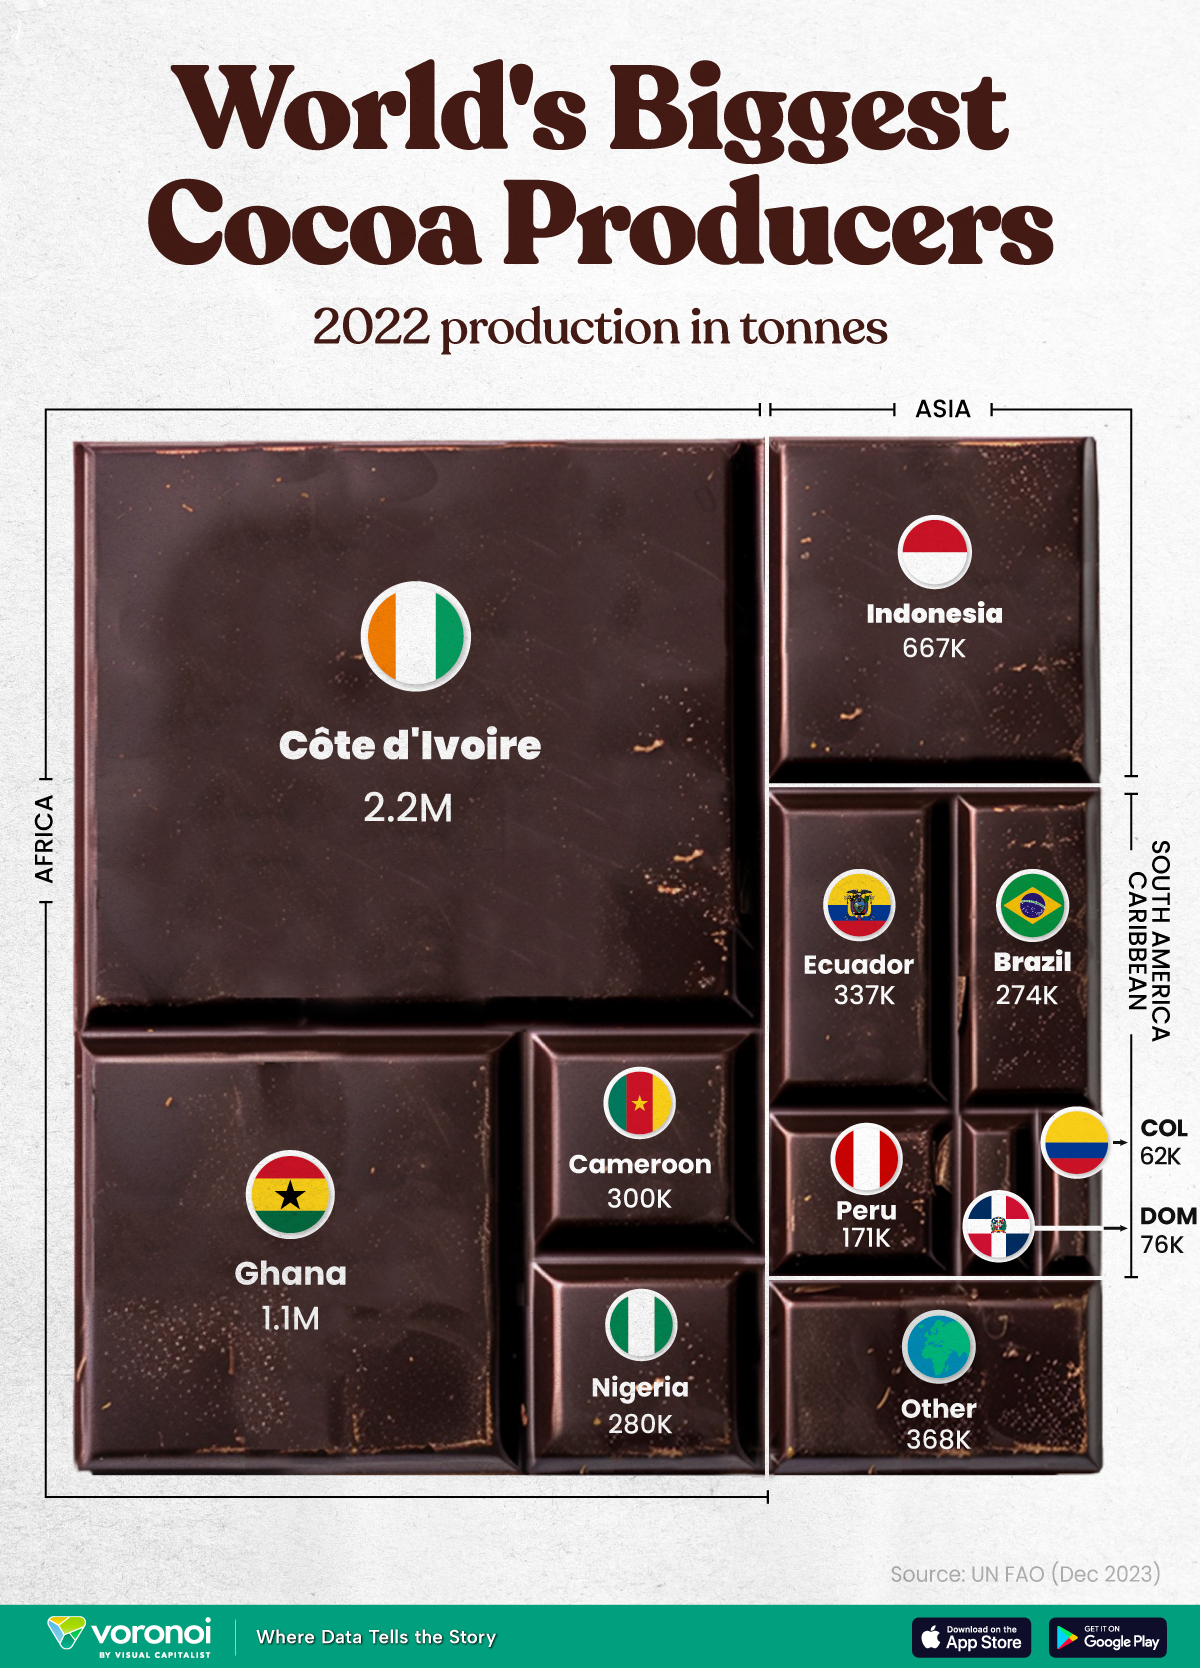
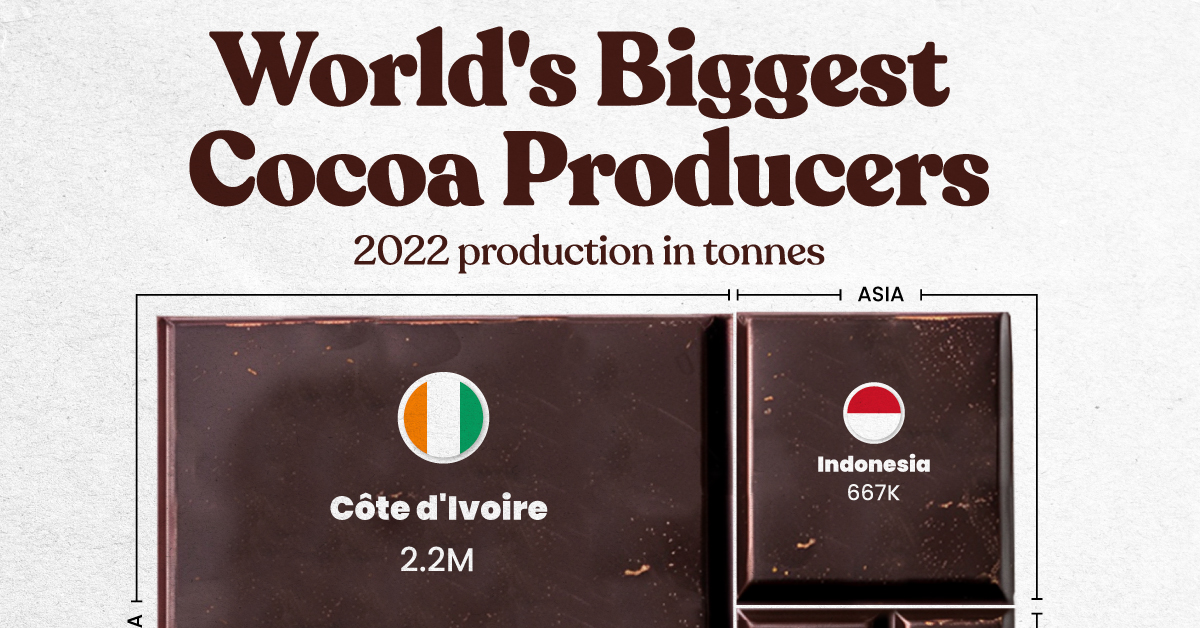
The World’s Top Cocoa Producing Countries
Here are the largest cocoa producing countries globally—from Côte d’Ivoire to Brazil—as cocoa prices hit record highs.
The World’s Top Cocoa Producing Countries
This was originally posted on our Voronoi app. Download the app for free on iOS or Android and discover incredible data-driven charts from a variety of trusted sources.
West Africa is home to the largest cocoa producing countries worldwide, with 3.9 million tonnes of production in 2022.
In fact, there are about one million farmers in Côte d’Ivoire supplying cocoa to key customers such as Nestlé, Mars, and Hershey. But the massive influence of this industry has led to significant forest loss to plant cocoa trees.
This graphic shows the leading producers of cocoa, based on data from the UN FAO.
Global Hotspots for Cocoa Production
Below, we break down the top cocoa producing countries as of 2022:
| Country | 2022 Production, Tonnes |
|---|---|
| 🇨🇮 Côte d'Ivoire | 2.2M |
| 🇬🇭 Ghana | 1.1M |
| 🇮🇩 Indonesia | 667K |
| 🇪🇨 Ecuador | 337K |
| 🇨🇲 Cameroon | 300K |
| 🇳🇬 Nigeria | 280K |
| 🇧🇷 Brazil | 274K |
| 🇵🇪 Peru | 171K |
| 🇩🇴 Dominican Republic | 76K |
| 🌍 Other | 386K |
With 2.2 million tonnes of cocoa in 2022, Côte d’Ivoire is the world’s largest producer, accounting for a third of the global total.
For many reasons, the cocoa trade in Côte d’Ivoire and Western Africa has been controversial. Often, farmers make about 5% of the retail price of a chocolate bar, and earn $1.20 each day. Adding to this, roughly a third of cocoa farms operate on forests that are meant to be protected.
As the third largest producer, Indonesia produced 667,000 tonnes of cocoa with the U.S., Malaysia, and Singapore as major importers. Overall, small-scale farmers produce 95% of cocoa in the country, but face several challenges such as low pay and unwanted impacts from climate change. Alongside aging trees in the country, these setbacks have led productivity to decline.
In South America, major producers include Ecuador and Brazil. In the early 1900s, Ecuador was the world’s largest cocoa producing country, however shifts in the global marketplace and crop disease led its position to fall. Today, the country is most known for its high-grade single-origin chocolate, with farms seen across the Amazon rainforest.
Altogether, global cocoa production reached 6.5 million tonnes, supported by strong demand. On average, the market has grown 3% annually over the last several decades.

-

 Mining1 week ago
Gold vs. S&P 500: Which Has Grown More Over Five Years?
-

 Markets2 weeks ago
Ranked: The Most Valuable Housing Markets in America
-

 Money2 weeks ago
Which States Have the Highest Minimum Wage in America?
-

 AI2 weeks ago
Ranked: Semiconductor Companies by Industry Revenue Share
-

 Markets2 weeks ago
Ranked: The World’s Top Flight Routes, by Revenue
-

 Countries2 weeks ago
Population Projections: The World’s 6 Largest Countries in 2075
-

 Markets2 weeks ago
The Top 10 States by Real GDP Growth in 2023
-

 Demographics2 weeks ago
The Smallest Gender Wage Gaps in OECD Countries