Uncategorized
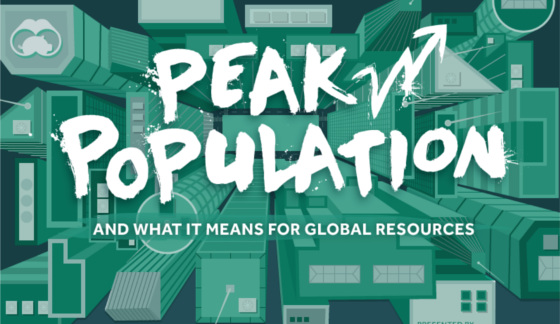
Peak Population: What it Means for Global Resources (Part 1)

Peak Population: What it Means for Global Resources (Part 1)
Presented by: Gainesville Coins
Even with having existed for millions of years, the process for humans to reach 1 billion in population was long and arduous. It is only about 12,000 years ago that humans started engaging in sedentary agriculture. This allowed humans to settle and consistently produce food, rather than hunt and gather throughout.
However, it is with the Industrial Revolution that the means for exponential human population increases was created. New technology, boosts in productivity, and the use of energy allowed for a new frontier in increasing health, sanitation, and standard of living. It is also around this time – in 1804 to be exact – that the earth’s population hit 1 billion people.
Fast forward two hundred years, and the impact of the Industrial Revolution is loud and clear. Now with over 7 billion people, global population has risen so fast that by one estimate, 14% of all human beings that have ever existed are alive today.
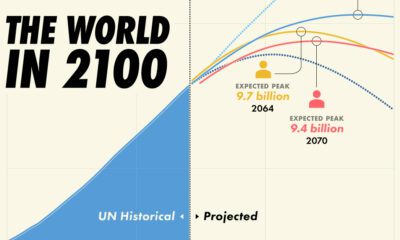
Based on a recent UN study, by 2100, our global population is predicted to be between 9.6 and 12.3 billion people. The world will be much different than we know it today in the future.
For starters, the vast majority of growth will happen in the less developed regions of the world. As an example, Nigeria’s population will increase five-fold, from around 174 million today to almost a billion people. It will likely be the 3rd most populous country behind India and China in 2100. Sub-Saharan Africa as a whole could hold up to almost half of the world’s population in the future.
While population has exploded exponentially, unfortunately the resources on our planet are finite. The ecological term for this is “carrying capacity”, which is the maximum population that an environment and resources can sustain indefinitely.
Human carrying capacity is very complex and takes into account many factors, including nutrients, fresh water, environmental conditions, space, technology, medical care, and sanitation. The carrying capacity for humans is not static, and can be changed by adding or subtracting resources from the ecosystem.
While technology has saved the human race time after time, we have not yet found ways to address many of the problems tied to overpopulation such as consumption, changes to climate, inequality, and scarcity of resources.
There are certain realities we will have to face. Here are just some of the issues:
• By 2025, 1.8 billion people will be living in countries or regions with absolute water scarcity.
• The United States uses 1 million gallons of oil every 2 minutes.
• The marginal cost of producing oil and metals has never been higher.
• Food prices are skyrocketing, and availability of essential nutrients (like phosphorus) needed to grow food is becoming scarcer.
• Governments continue to create new currency and debt at unprecedented and unsustainable levels.
• Potential collapses in biodiversity and changes in our climate.
Is our future littered with disease, famine, stunted growth, currency collapse, and a lower quality of life?
Or should we be optimistic that we can persist? Can technology and smart decisions save the day?
Visual Capitalist continues to look at Peak Population in Parts 2 and 3 of this series in early 2015. Subscribe below to make sure you get it.


Uncategorized
Ranked: The 50 Most Innovative Companies
Companies need to adapt quickly to changing markets in order to thrive. Here’s a look at the top 50 most innovative companies in 2020.
Ranked: the Top 50 Most Innovative Companies in 2020
Corporate longevity is on the decline. In the 1960s, a typical S&P 500 company was estimated to last more than 60 years—these days, the average lifespan is just 18 years.
In today’s fast-paced world, companies need to stay relevant in order to survive. Because of this, it’s become increasingly more important for businesses to prioritize innovation.
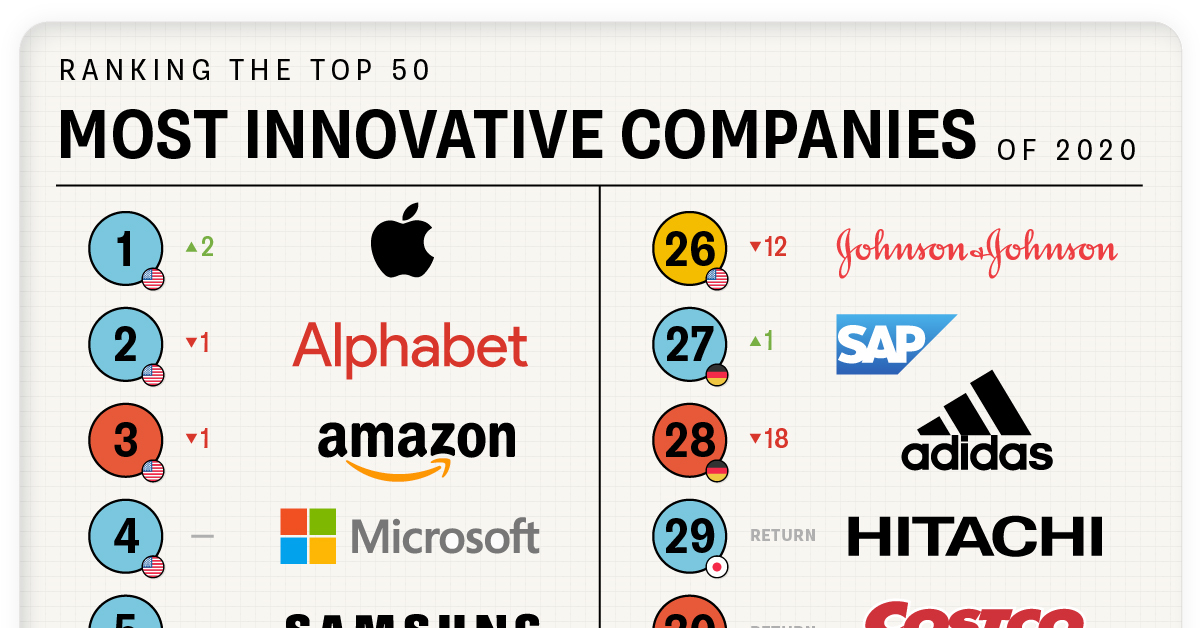
This chart looks at the top 50 most innovative companies in 2020, based on a survey by Boston Consulting Group (BCG). The companies have been ranked based on four variables:
- Global “Mindshare”: The number of votes from all innovation executives.
- Industry Peer Review: The number of votes from executives in a company’s industry.
- Industry Disruption: A diversity index to measure votes across industries.
- Value Creation: Total share return.
Breakdown of the Leaderboard
BCG has been ranking the most innovative companies since 2005. Here’s a look at the top 50 most innovative companies in 2020:
| Rank | Company | Industry | HQ | Change from 2019 |
|---|---|---|---|---|
| 1 | Apple | Technology | U.S. | 2 |
| 2 | Alphabet | Technology | U.S. | -1 |
| 3 | Amazon | Consumer Goods | U.S. | -1 |
| 4 | Microsoft | Technology | U.S. | - |
| 5 | Samsung | Technology | South Korea | - |
| 6 | Huawei | Technology | China | 42 |
| 7 | Alibaba | Consumer Goods | China | 16 |
| 8 | IBM | Technology | U.S. | -1 |
| 9 | Sony | Consumer Goods | Japan | return |
| 10 | Technology | U.S. | -2 | |
| 11 | Tesla | Transportation & Energy | U.S. | -2 |
| 12 | Cisco Systems | Technology | U.S. | 5 |
| 13 | Walmart | Consumer Goods | U.S. | 29 |
| 14 | Tencent | Other | China | return |
| 15 | HP Inc. | Technology | U.S. | 29 |
| 16 | Nike | Consumer Goods | U.S. | return |
| 17 | Netflix | Other | U.S. | -11 |
| 18 | LG Electronics | Consumer Goods | South Korea | - |
| 19 | Intel | Technology | U.S. | return |
| 20 | Dell | Technology | U.S. | 21 |
| 21 | Siemens | Other | Germany | -5 |
| 22 | Target | Consumer Goods | U.S. | return |
| 23 | Philips | Pharmaceuticals & Medtech | Netherlands | 6 |
| 24 | Xiaomi | Technology | China | return |
| 25 | Oracle | Technology | U.S. | return |
| 26 | Johnson & Johnson | Pharmaceuticals & Medtech | U.S. | -12 |
| 27 | SAP | Technology | Germany | 1 |
| 28 | Adidas | Consumer Goods | Germany | -18 |
| 29 | Hitachi | Technology | Japan | return |
| 30 | Costco | Consumer Goods | U.S. | return |
| 31 | JD.com | Consumer Goods | China | new |
| 32 | Volkswagen | Transportation & Energy | Germany | 6 |
| 33 | Bosch | Transportation & Energy | Germany | new |
| 34 | Airbus | Transportation & Energy | Netherlands | return |
| 35 | Salesforce | Technology | U.S. | -2 |
| 36 | JPMorgan Chase | Other | U.S. | -16 |
| 37 | Uber | Technology | U.S. | return |
| 38 | Bayer | Pharmaceuticals & Medtech | Germany | -14 |
| 39 | Procter & Gamble | Consumer Goods | U.S. | return |
| 40 | Royal Dutch Shell | Transportation & Energy | Netherlands | -10 |
| 41 | Toyota | Transportation & Energy | Japan | -4 |
| 42 | Nestle | Consumer Goods | Switzerland | return |
| 43 | ABB | Other | Switzerland | new |
| 44 | 3M | Other | U.S. | -5 |
| 45 | Unilever | Consumer Goods | U.K. | -13 |
| 46 | FCA | Transportation & Energy | U.K. | new |
| 47 | Novartis | Pharmaceuticals & Medtech | Switzerland | new |
| 48 | Coca-Cola | Consumer Goods | U.S. | return |
| 49 | Volvo | Transportation & Energy | Sweden | new |
| 50 | McDonald’s | Consumer Goods | U.S. | -29 |
When you think about innovative companies, Walmart might not be top of mind. However, the retail giant has moved up to the 13th spot on the list, an increase of 29 places since 2019.
Walmart has put significant efforts into its e-commerce and omnichannel offerings. For instance, the company launched NextDay Delivery in 2020, and now offers one-day delivery to a majority of the U.S. population. The company also has a stake in the Chinese e-commerce platform JD.com, which has grown from 5% to 12%.
Costco makes it to 30th place this year, and the company is known for its effective use of data. Thanks to the company’s members-only model, it has been able to compile a ton of information on its customers. It uses this data not only for marketing purposes, but to help streamline processes like recall notices. Costco also uses data monitoring sensors in its warehouses to save money on water usage and to spot any potential leaks before they happen.
Another company worth touching on is Huawei—the Chinese tech company has taken the 6th spot, a 42 rank increase since 2019. This rise in the ranks is likely due to the company’s significant $19 billion investment in research and development (R&D) in 2019. These types of investments seem to be paying off, as Huawei sold more smartphones in 2019 than Apple.
Innovation Leaders Come in All Sizes
While people may picture startups when they think of innovation and adaptability, big firms aren’t lagging far behind when it comes to innovation output.
In this context, firms with new product sales above their industry median are considered “innovation leaders.” Although 52% of small firms are considered innovation leaders, 43% of large firms still find themselves in the same boat.
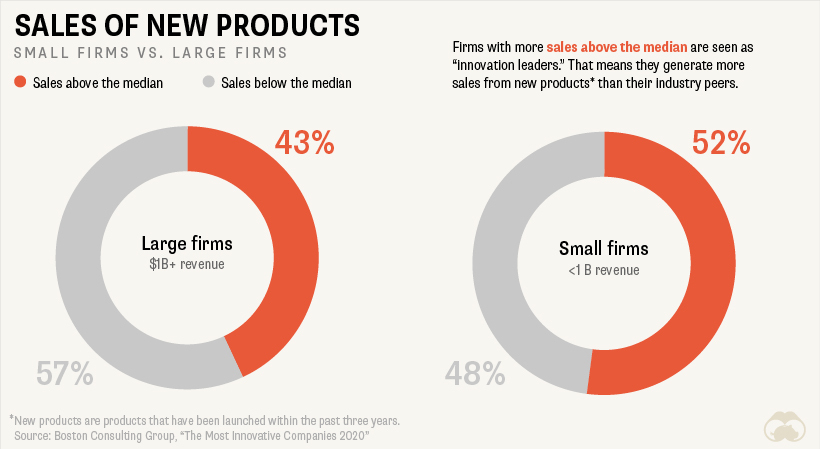
In fact, because larger firms generally have more access to resources and manpower than smaller firms, they often have an advantage when it comes to research and development and the creation of innovation-focused programs.
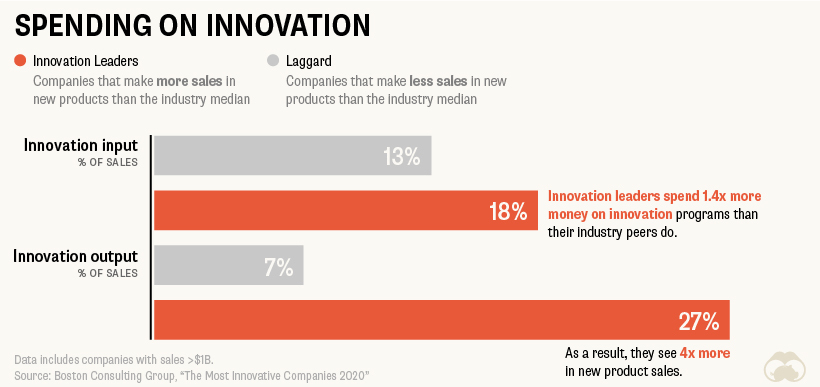
Investing in innovation shows a far greater payoff down the line—firms that invested 1.4x more in innovation input saw 4x the amount of new products sales.
Innovation as a Lifestyle
Unless you’re in a startup that’s hoping to get acquired by a larger firm, innovation can’t be a one-hit-wonder. Yet, despite its importance, innovation over the long term is hard to maintain.
There have only been 8 companies that have appeared on the list every year. Here’s a look at the companies that have consistently made the cut since 2005:
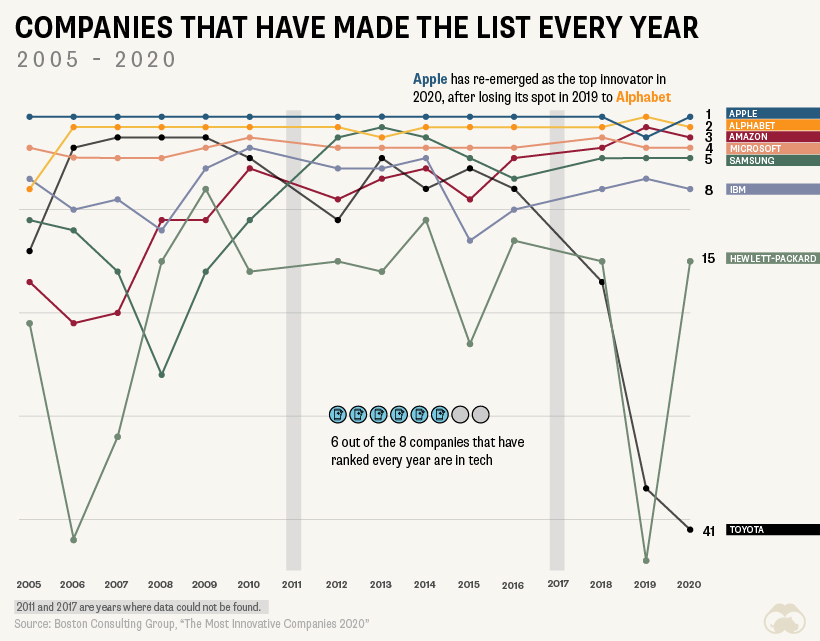
These companies are serial innovators, and have managed to create innovation systems to perpetually foster creativity and agility. It’s an intentional, laborious process—but when done right, the payoff can be huge.

-

 Markets1 week ago
Ranked: The Largest U.S. Corporations by Number of Employees
-

 Green3 weeks ago
Ranked: Top Countries by Total Forest Loss Since 2001
-

 Money2 weeks ago
Where Does One U.S. Tax Dollar Go?
-

 Automotive2 weeks ago
Almost Every EV Stock is Down After Q1 2024
-

 AI2 weeks ago
The Stock Performance of U.S. Chipmakers So Far in 2024
-

 Markets2 weeks ago
Charted: Big Four Market Share by S&P 500 Audits
-

 Real Estate2 weeks ago
Ranked: The Most Valuable Housing Markets in America
-

 Money2 weeks ago
Which States Have the Highest Minimum Wage in America?