Money
This 1-Minute Animation Puts $110 Billion of Wealth in Perspective
Just over a week ago, Bill Gates reclaimed the familiar title of the world’s richest person after seeing his net worth jump to the $110 billion mark.
The recent gains can be attributed to a surge in Microsoft’s stock price, after the tech company surprised the market by winning a $10 billion cloud contract from the Pentagon. This also pushed Gates past fellow Seattle billionaire Jeff Bezos, who currently holds a $108.7 billion fortune.
With these numbers topping a hundred billion dollars, they can be difficult to comprehend. Luckily for us, Twitter user @betty__cam put together a short animation that simplifies things.
$110 Billion, Visualized
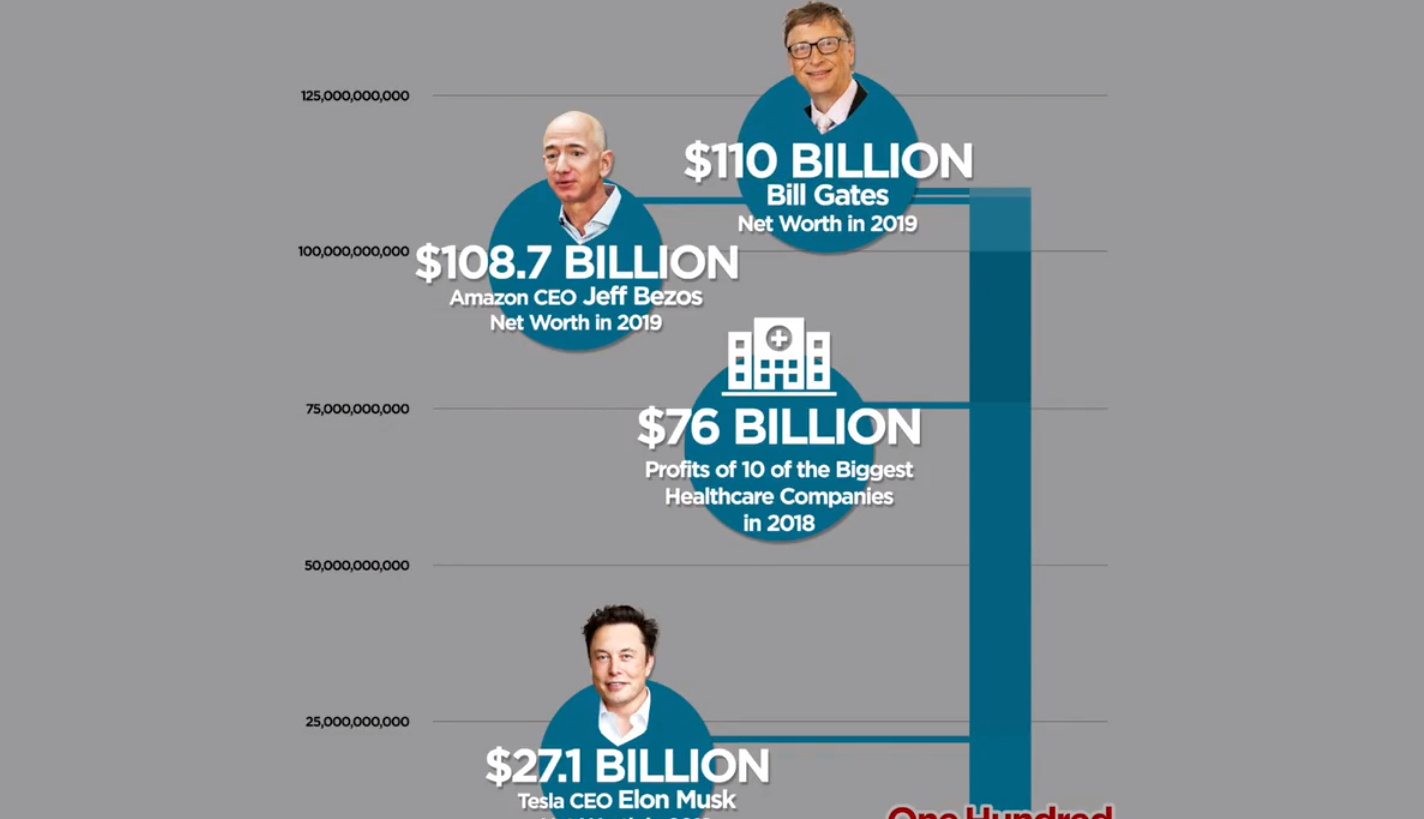
The following one minute animation starts with the median household wealth in the United States of $61,937, working its way up to the Bill Gates fortune of $110 billion:
Along the way, the animation points out comparable dollar amounts to put things in perspective.
This includes the amount that people should save for retirement ($1.33 million), Katy Perry’s mansion in Beverly Hills ($19 million), settlements paid by the NYPD in a year ($230 million), and even the wealth of Elon Musk ($27.1 billion).
Millions vs. Billions
Part of the impact of the animation comes as it flips from millions to billions of dollars.
For example, the retirement figure of $1.33 million is clearly a solid chunk of money — but when that turns into a tiny speck in contrast to $1 billion, it’s evident that we’re talking about very different scales.
This is also illustrated when we look at seconds:
- 1 million seconds = 11.5 days
- 1 billion seconds = 31.71 years
- 110 billion seconds = 3,488.1 years
Go back a million seconds in time, and we’re talking about last week — go back Bill Gates’ wealth in seconds, and you’ll be hanging out with the Ancient Babylonians.
The Equities Effect
The short animation helps put this immense amount of wealth in perspective, but it also has raises a fair question: why is Bill Gates’ net worth growing if he signed The Giving Pledge, a commitment to give away at least half of his net worth to philanthropic causes?
The disconnect lies in the fact that fluctuations in Gates’ net worth are largely connected to the movement of Microsoft’s stock price, as well as the stock market in general.
Even though he’s no longer an active officer of the tech giant, Gates still owns close to 1% of outstanding shares — and with Satya Nadella at the helm, Microsoft’s market capitalization has soared to a record-setting $1.15 trillion. Gates also has over 60% of his assets invested in the stock market, which sits at all-time highs as well.
For the above reasons, Bill Gates gave away $35 billion in wealth in 2019, but still ended up gaining $16 billion in overall net worth.


Money
Charted: Which City Has the Most Billionaires in 2024?
Just two countries account for half of the top 20 cities with the most billionaires. And the majority of the other half are found in Asia.


Charted: Which Country Has the Most Billionaires in 2024?
This was originally posted on our Voronoi app. Download the app for free on iOS or Android and discover incredible data-driven charts from a variety of trusted sources.
Some cities seem to attract the rich. Take New York City for example, which has 340,000 high-net-worth residents with investable assets of more than $1 million.
But there’s a vast difference between being a millionaire and a billionaire. So where do the richest of them all live?
Using data from the Hurun Global Rich List 2024, we rank the top 20 cities with the highest number of billionaires in 2024.
A caveat to these rich lists: sources often vary on figures and exact rankings. For example, in last year’s reports, Forbes had New York as the city with the most billionaires, while the Hurun Global Rich List placed Beijing at the top spot.
Ranked: Top 20 Cities with the Most Billionaires in 2024
The Chinese economy’s doldrums over the course of the past year have affected its ultra-wealthy residents in key cities.
Beijing, the city with the most billionaires in 2023, has not only ceded its spot to New York, but has dropped to #4, overtaken by London and Mumbai.
| Rank | City | Billionaires | Rank Change YoY |
|---|---|---|---|
| 1 | 🇺🇸 New York | 119 | +1 |
| 2 | 🇬🇧 London | 97 | +3 |
| 3 | 🇮🇳 Mumbai | 92 | +4 |
| 4 | 🇨🇳 Beijing | 91 | -3 |
| 5 | 🇨🇳 Shanghai | 87 | -2 |
| 6 | 🇨🇳 Shenzhen | 84 | -2 |
| 7 | 🇭🇰 Hong Kong | 65 | -1 |
| 8 | 🇷🇺 Moscow | 59 | No Change |
| 9 | 🇮🇳 New Delhi | 57 | +6 |
| 10 | 🇺🇸 San Francisco | 52 | No Change |
| 11 | 🇹🇭 Bangkok | 49 | +2 |
| 12 | 🇹🇼 Taipei | 45 | +2 |
| 13 | 🇫🇷 Paris | 44 | -2 |
| 14 | 🇨🇳 Hangzhou | 43 | -5 |
| 15 | 🇸🇬 Singapore | 42 | New to Top 20 |
| 16 | 🇨🇳 Guangzhou | 39 | -4 |
| 17T | 🇮🇩 Jakarta | 37 | +1 |
| 17T | 🇧🇷 Sao Paulo | 37 | No Change |
| 19T | 🇺🇸 Los Angeles | 31 | No Change |
| 19T | 🇰🇷 Seoul | 31 | -3 |
In fact all Chinese cities on the top 20 list have lost billionaires between 2023–24. Consequently, they’ve all lost ranking spots as well, with Hangzhou seeing the biggest slide (-5) in the top 20.
Where China lost, all other Asian cities—except Seoul—in the top 20 have gained ranks. Indian cities lead the way, with New Delhi (+6) and Mumbai (+3) having climbed the most.
At a country level, China and the U.S combine to make up half of the cities in the top 20. They are also home to about half of the world’s 3,200 billionaire population.
In other news of note: Hurun officially counts Taylor Swift as a billionaire, estimating her net worth at $1.2 billion.

-

 Debt1 week ago
How Debt-to-GDP Ratios Have Changed Since 2000
-

 Markets2 weeks ago
Ranked: The World’s Top Flight Routes, by Revenue
-

 Countries2 weeks ago
Population Projections: The World’s 6 Largest Countries in 2075
-

 Markets2 weeks ago
The Top 10 States by Real GDP Growth in 2023
-

 Demographics2 weeks ago
The Smallest Gender Wage Gaps in OECD Countries
-

 United States2 weeks ago
Where U.S. Inflation Hit the Hardest in March 2024
-

 Green2 weeks ago
Top Countries By Forest Growth Since 2001
-

 United States2 weeks ago
Ranked: The Largest U.S. Corporations by Number of Employees