Markets
The $100 Trillion Global Economy in One Chart
Check out the latest 2023 update of the global economy in one chart.


Visualizing the $100 Trillion Global Economy in One Chart
Check out the latest 2023 update of the global economy in one chart.
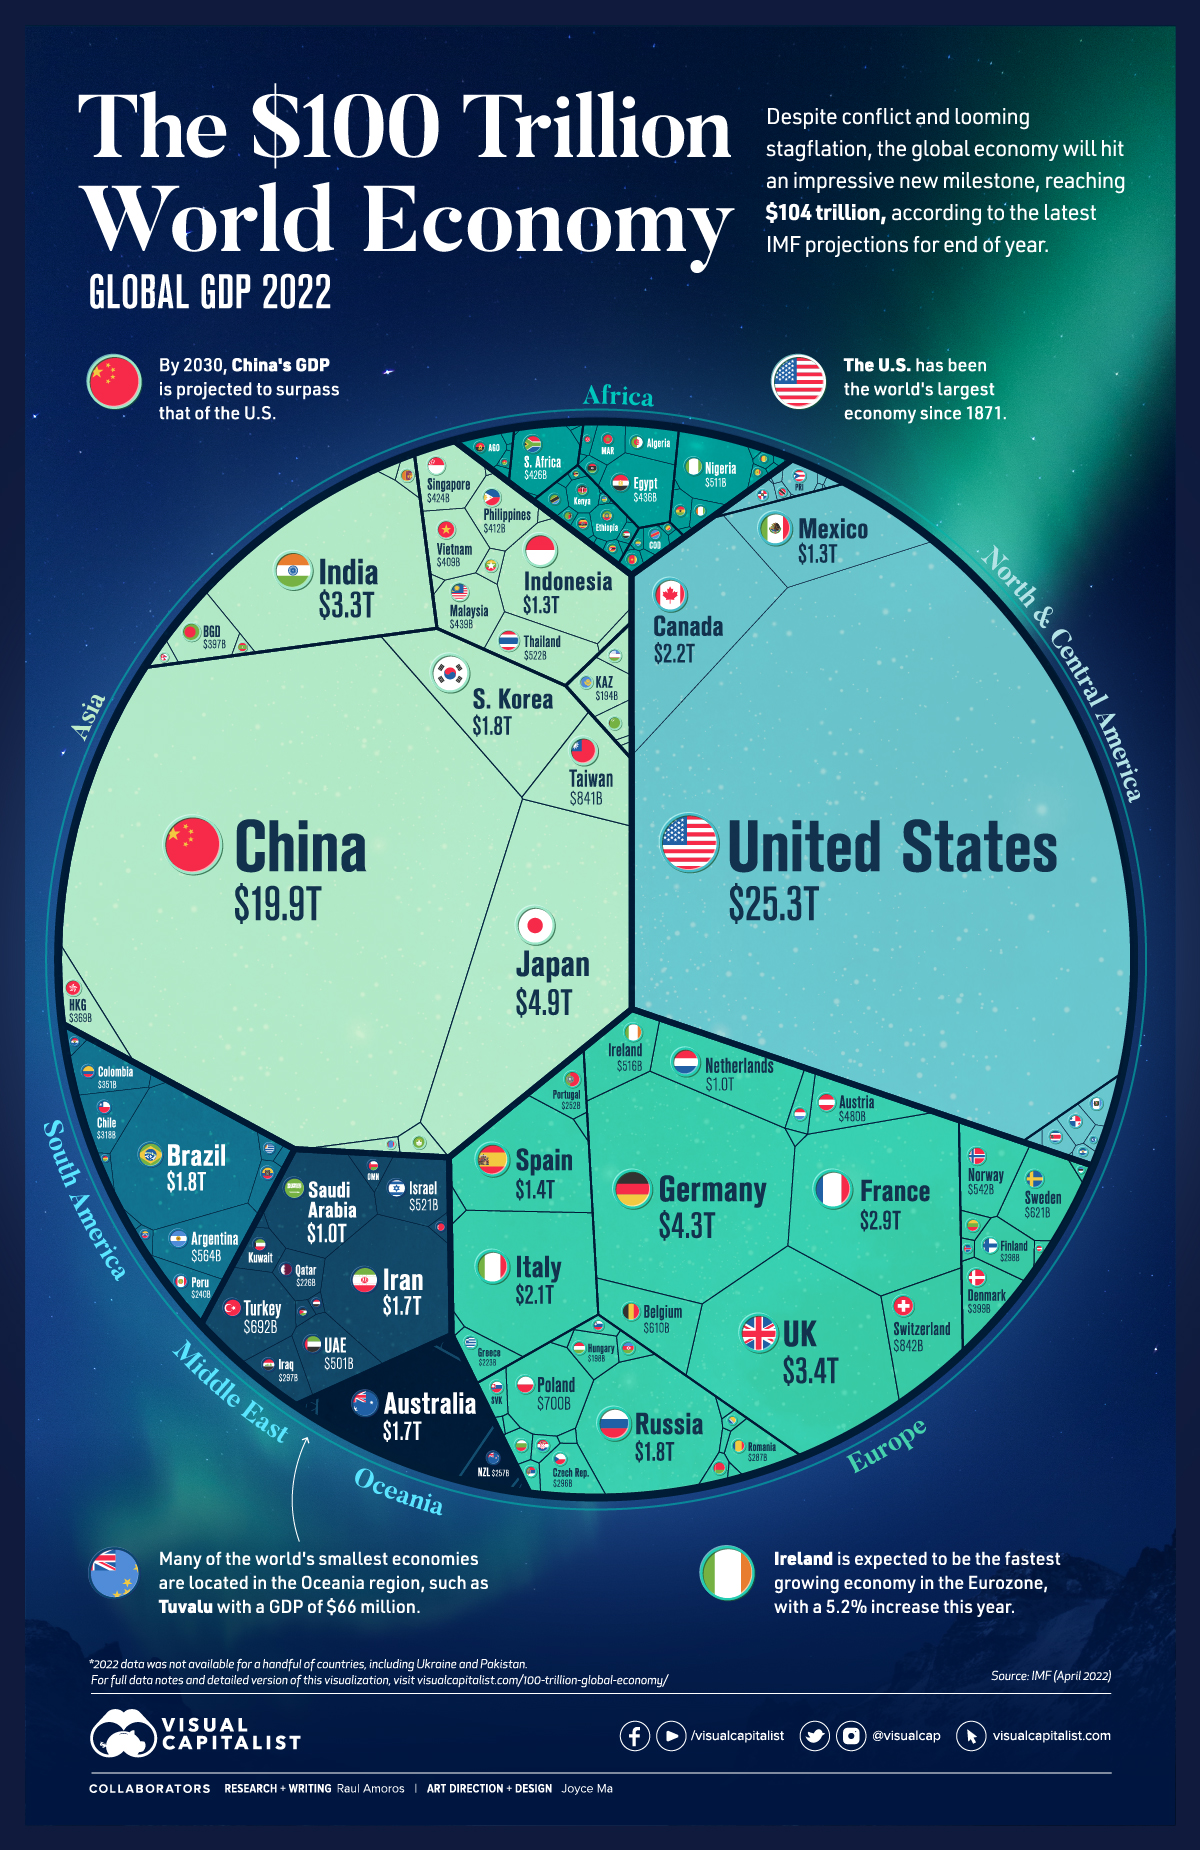
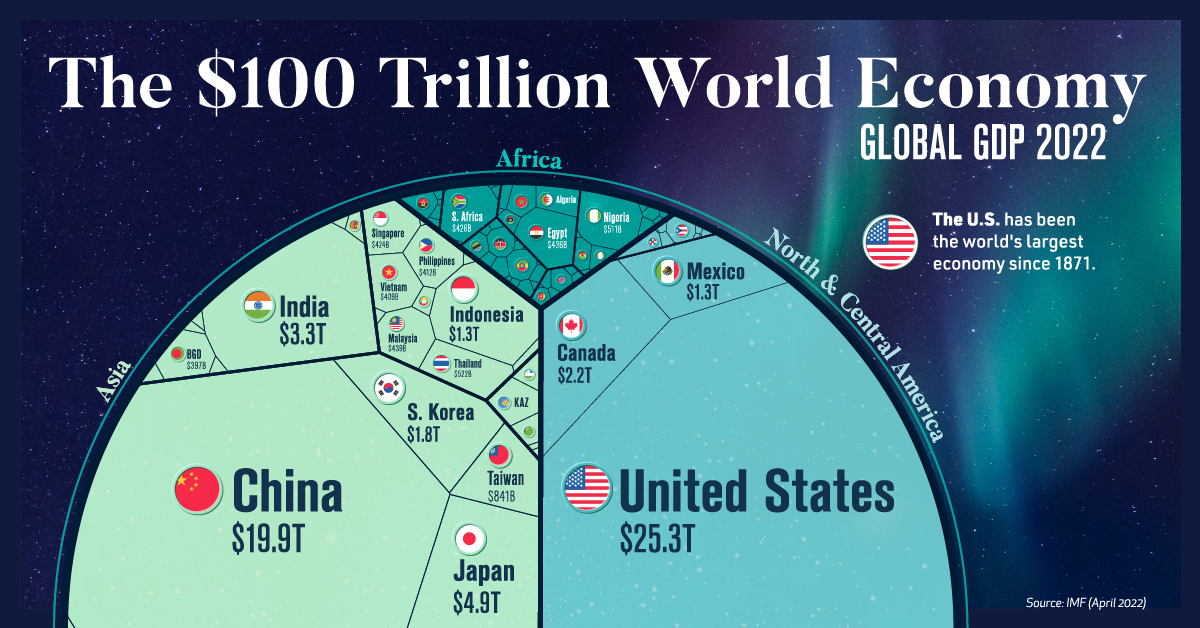
Surpassing the $100 trillion mark is a new milestone for global economic output.
We’ve covered this topic in the past when the world’s GDP was $88 trillion (2020) and then $94 trillion (2021), and now according to the latest projections, the IMF expects the global economy to reach nearly $104 trillion in nominal value by the end of 2022.
Although growth keeps trending upwards, the recovery that was expected in the post-pandemic period is looking strained. Because of recent conflicts, supply chain bottlenecks, and subsequent inflation, global economic projections are getting revised downwards.
Global annual GDP growth for 2022 was initially projected to be 4.4% as of January, but this has since been adjusted to 3.6%.
Note: This data from the IMF represents the most recent nominal projections for end of year as of April 2022.
The 50 Largest Economies in the World
The United States is still the economic leader worldwide, with a GDP of $25.3 trillion—making up nearly one quarter of the global economy. China follows close behind at $19.9 trillion. Here’s a look at the top 50 countries in terms of GDP:
| Rank | Country | GDP (current prices, USD) |
|---|---|---|
| #1 | 🇺🇸 United States | $25.3 trillion |
| #2 | 🇨🇳 China | $19.9 trillion |
| #3 | 🇯🇵 Japan | $4.9 trillion |
| #4 | 🇩🇪 Germany | $4.3 trillion |
| #5 | 🇬🇧 United Kingdom | $3.4 trillion |
| #6 | 🇮🇳 India | $3.3 trillion |
| #7 | 🇫🇷 France | $2.9 trillion |
| #8 | 🇨🇦 Canada | $2.2 trillion |
| #9 | 🇮🇹 Italy | $2.1 trillion |
| #10 | 🇧🇷 Brazil | $1.8 trillion |
| #11 | 🇷🇺 Russia | $1.8 trillion |
| #12 | 🇰🇷 South Korea | $1.8 trillion |
| #13 | 🇦🇺 Australia | $1.7 trillion |
| #14 | 🇮🇷 Iran | $1.7 trillion |
| #15 | 🇪🇸 Spain | $1.4 trillion |
| #16 | 🇲🇽 Mexico | $1.3 trillion |
| #17 | 🇮🇩 Indonesia | $1.3 trillion |
| #18 | 🇸🇦 Saudi Arabia | $1.0 trillion |
| #19 | 🇳🇱 Netherlands | $1.0 trillion |
| #20 | 🇨🇭 Switzerland | $842 billion |
| #21 | 🇹🇼 Taiwan | $841 billion |
| #22 | 🇵🇱 Poland | $700 billion |
| #23 | 🇹🇷 Turkey | $692 billion |
| #24 | 🇸🇪 Sweden | $621 billion |
| #25 | 🇧🇪 Belgium | $610 billion |
| #26 | 🇦🇷 Argentina | $564 billion |
| #27 | 🇳🇴 Norway | $542 billion |
| #28 | 🇹🇭 Thailand | $522 billion |
| #29 | 🇮🇱 Israel | $521 billion |
| #30 | 🇮🇪 Ireland | $516 billion |
| #31 | 🇳🇬 Nigeria | $511 billion |
| #32 | 🇦🇪 United Arab Emirates | $501 billion |
| #33 | 🇦🇹 Austria | $480 billion |
| #34 | 🇲🇾 Malaysia | $439 billion |
| #35 | 🇪🇬 Egypt | $436 billion |
| #36 | 🇿🇦 South Africa | $426 billion |
| #37 | 🇸🇬 Singapore | $424 billion |
| #38 | 🇵🇭 Philippines | $412 billion |
| #39 | 🇻🇳 Vietnam | $409 billion |
| #40 | 🇩🇰 Denmark | $399 billion |
| #41 | 🇧🇩 Bangladesh | $397 billion |
| #42 | 🇭🇰 Hong Kong SAR | $369 billion |
| #43 | 🇨🇴 Colombia | $351 billion |
| #44 | 🇨🇱 Chile | $318 billion |
| #45 | 🇫🇮 Finland | $298 billion |
| #46 | 🇮🇶 Iraq | $297 billion |
| #47 | 🇨🇿 Czechia | $296 billion |
| #48 | 🇷🇴 Romania | $287 billion |
| #49 | 🇳🇿 New Zealand | $257 billion |
| #50 | 🇵🇹 Portugal | $252 billion |
The frontrunner in Europe is Germany at $4.3 trillion, with the UK coming in second place. One significant change since the last reported figures is that Brazil now cracks the top 10, having surpassed South Korea. Russia falls just outside, in 11th place, with a GDP of $1.8 trillion.
While China’s GDP growth has slowed in recent years, projections still indicate that the country will overtake the U.S. by 2030, dethroning the world’s economic leader.
One region also expected to experience growth in the near future is the Middle East and North Africa, thanks to higher oil prices—Iraq and Saudi Arabia in particular are leading this charge. Regional GDP growth in the area is expected to be around 5% in 2022.
The 50 Smallest Economies in the World
Some of the world’s smallest economies were hit particularly hard by the pandemic, and have subsequently been the most affected by the inflation and food supply shortages resulting from the war in Ukraine.
Here’s a look at the countries worldwide with the lowest GDP in 2022:
| Rank | Country | GDP (current prices, USD) |
|---|---|---|
| #191 | 🇹🇻 Tuvalu | $66 million |
| #190 | 🇳🇷 Nauru | $134 million |
| #189 | 🇰🇮 Kiribati | $216 million |
| #188 | 🇵🇼 Palau | $244 million |
| #187 | 🇲🇭 Marshall Islands | $267 million |
| #186 | 🇫🇲 Micronesia | $427 million |
| #185 | 🇸🇹 São Tomé and Príncipe | $1 billion |
| #184 | 🇹🇴 Tonga | $1 billion |
| #183 | 🇩🇲 Dominica | $1 billion |
| #182 | 🇼🇸 Samoa | $1 billion |
| #181 | 🇻🇨 Saint Vincent and the Grenadines | $1 billion |
| #180 | 🇻🇺 Vanuatu | $1 billion |
| #179 | 🇰🇳 Saint Kitts and Nevis | $1 billion |
| #178 | 🇬🇩 Grenada | $1 billion |
| #177 | 🇰🇲 Comoros | $1 billion |
| #176 | 🇦🇬 Antigua and Barbuda | $2 billion |
| #175 | 🇬🇼 Guinea-Bissau | $2 billion |
| #174 | 🇸🇧 Solomon Islands | $2 billion |
| #173 | 🇸🇲 San Marino | $2 billion |
| #172 | 🇸🇨 Seychelles | $2 billion |
| #171 | 🇹🇱 Timor-Leste | $2 billion |
| #170 | 🇧🇿 Belize | $2 billion |
| #169 | 🇨🇻 Cabo Verde | $2 billion |
| #168 | 🇱🇨 Saint Lucia | $2 billion |
| #167 | 🇬🇲 The Gambia | $2 billion |
| #166 | 🇱🇸 Lesotho | $3 billion |
| #165 | 🇪🇷 Eritrea | $3 billion |
| #164 | 🇨🇫 Central African Republic | $3 billion |
| #163 | 🇧🇹 Bhutan | $3 billion |
| #162 | 🇸🇷 Suriname | $3 billion |
| #161 | 🇦🇼 Aruba | $3 billion |
| #160 | 🇦🇩 Andorra | $3 billion |
| #159 | 🇧🇮 Burundi | $3 billion |
| #158 | 🇱🇷 Liberia | $4 billion |
| #157 | 🇩🇯 Djibouti | $4 billion |
| #156 | 🇸🇱 Sierra Leone | $4 billion |
| #155 | 🇸🇿 Eswatini | $5 billion |
| #154 | 🇫🇯 Fiji | $5 billion |
| #153 | 🇲🇻 Maldives | $6 billion |
| #152 | 🇧🇧 Barbados | $6 billion |
| #151 | 🇸🇸 South Sudan | $6 billion |
| #150 | 🇲🇪 Montenegro | $6 billion |
| #149 | 🇹🇯 Tajikistan | $8 billion |
| #148 | 🇸🇴 Somalia | $8 billion |
| #147 | 🇹🇬 Togo | $9 billion |
| #146 | 🇰🇬 Kyrgyzstan | $9 billion |
| #145 | 🇲🇷 Mauritania | $9 billion |
| #144 | 🇽🇰 Kosovo | $10 billion |
| #143 | 🇲🇺 Mauritius | $11 billion |
| #142 | 🇲🇼 Malawi | $12 billion |
The smallest economy in the world measured in the IMF rankings is Tuvalu at $66 million. Most of the bottom 50 are considered low- to middle-income and emerging/developing countries. According to the World Bank, in developing countries, the level of per capita income in 2022 will be about 5% below the pre-pandemic trends.
Some countries are actually projected to experience negative GDP growth this year, particularly emerging and developing economies in Europe.
For example, Russia is expected to experience a GDP growth rate of -8.5% in 2022, though it still remains to be seen how the cost of war and increasingly harsh global sanctions impact the country’s economic prospects.
Inflation, Stagflation, Recession – How Bad is it?
While global economic growth has already been revised downwards, it’s possible the situation could be even more serious. Organizations like the World Bank say that risks of stagflation are rising. Stagflation, which hasn’t occurred since the 1970s, is defined as an economy that’s experiencing rising inflation combined with a stagnant economic output.
Currently, global consumer inflation is currently pegged at 7%. Daily goods are becoming increasingly difficult to purchase and interest rates are on the rise as central banks worldwide try to control the situation. As recent events in Sri Lanka demonstrate, low-income countries are particularly at risk to economic volatility.


Markets
Mapped: Europe’s GDP Per Capita, by Country
Which European economies are richest on a GDP per capita basis? This map shows the results for 44 countries across the continent.


Mapped: Europe’s GDP Per Capita, by Country (2024)
This was originally posted on our Voronoi app. Download the app for free on iOS or Android and discover incredible data-driven charts from a variety of trusted sources.
Europe is home to some of the largest and most sophisticated economies in the world. But how do countries in the region compare with each other on a per capita productivity basis?
In this map, we show Europe’s GDP per capita levels across 44 nations in current U.S. dollars. Data for this visualization and article is sourced from the International Monetary Fund (IMF) via their DataMapper tool, updated April 2024.
Europe’s Richest and Poorest Nations, By GDP Per Capita
Luxembourg, Ireland, and Switzerland, lead the list of Europe’s richest nations by GDP per capita, all above $100,000.
| Rank | Country | GDP Per Capita (2024) |
|---|---|---|
| 1 | 🇱🇺 Luxembourg | $131,380 |
| 2 | 🇮🇪 Ireland | $106,060 |
| 3 | 🇨🇭 Switzerland | $105,670 |
| 4 | 🇳🇴 Norway | $94,660 |
| 5 | 🇮🇸 Iceland | $84,590 |
| 6 | 🇩🇰 Denmark | $68,900 |
| 7 | 🇳🇱 Netherlands | $63,750 |
| 8 | 🇸🇲 San Marino | $59,410 |
| 9 | 🇦🇹 Austria | $59,230 |
| 10 | 🇸🇪 Sweden | $58,530 |
| 11 | 🇧🇪 Belgium | $55,540 |
| 12 | 🇫🇮 Finland | $55,130 |
| 13 | 🇩🇪 Germany | $54,290 |
| 14 | 🇬🇧 UK | $51,070 |
| 15 | 🇫🇷 France | $47,360 |
| 16 | 🇦🇩 Andorra | $44,900 |
| 17 | 🇲🇹 Malta | $41,740 |
| 18 | 🇮🇹 Italy | $39,580 |
| 19 | 🇨🇾 Cyprus | $37,150 |
| 20 | 🇪🇸 Spain | $34,050 |
| 21 | 🇸🇮 Slovenia | $34,030 |
| 22 | 🇪🇪 Estonia | $31,850 |
| 23 | 🇨🇿 Czech Republic | $29,800 |
| 24 | 🇵🇹 Portugal | $28,970 |
| 25 | 🇱🇹 Lithuania | $28,410 |
| 26 | 🇸🇰 Slovakia | $25,930 |
| 27 | 🇱🇻 Latvia | $24,190 |
| 28 | 🇬🇷 Greece | $23,970 |
| 29 | 🇭🇺 Hungary | $23,320 |
| 30 | 🇵🇱 Poland | $23,010 |
| 31 | 🇭🇷 Croatia | $22,970 |
| 32 | 🇷🇴 Romania | $19,530 |
| 33 | 🇧🇬 Bulgaria | $16,940 |
| 34 | 🇷🇺 Russia | $14,390 |
| 35 | 🇹🇷 Türkiye | $12,760 |
| 36 | 🇲🇪 Montenegro | $12,650 |
| 37 | 🇷🇸 Serbia | $12,380 |
| 38 | 🇦🇱 Albania | $8,920 |
| 39 | 🇧🇦 Bosnia & Herzegovina | $8,420 |
| 40 | 🇲🇰 North Macedonia | $7,690 |
| 41 | 🇧🇾 Belarus | $7,560 |
| 42 | 🇲🇩 Moldova | $7,490 |
| 43 | 🇽🇰 Kosovo | $6,390 |
| 44 | 🇺🇦 Ukraine | $5,660 |
| N/A | 🇪🇺 EU Average | $44,200 |
Note: Figures are rounded.
Three Nordic countries (Norway, Iceland, Denmark) also place highly, between $70,000-90,000. Other Nordic peers, Sweden and Finland rank just outside the top 10, between $55,000-60,000.
Meanwhile, Europe’s biggest economies in absolute terms, Germany, UK, and France, rank closer to the middle of the top 20, with GDP per capitas around $50,000.
Finally, at the end of the scale, Eastern Europe as a whole tends to have much lower per capita GDPs. In that group, Ukraine ranks last, at $5,660.
A Closer Look at Ukraine
For a broader comparison, Ukraine’s per capita GDP is similar to Iran ($5,310), El Salvador ($5,540), and Guatemala ($5,680).
According to experts, Ukraine’s economy has historically underperformed to expectations. After the fall of the Berlin Wall, the economy contracted for five straight years. Its transition to a Western, liberalized economic structure was overshadowed by widespread corruption, a limited taxpool, and few revenue sources.
Politically, its transformation from authoritarian regime to civil democracy has proved difficult, especially when it comes to institution building.
Finally, after the 2022 invasion of the country, Ukraine’s GDP contracted by 30% in a single year—the largest loss since independence. Large scale emigration—to the tune of six million refugees—is also playing a role.
Despite these challenges, the country’s economic growth has somewhat stabilized while fighting continues.

-

 Markets6 days ago
The World’s Fastest Growing Emerging Markets (2024-2029 Forecast)
-

 Technology2 weeks ago
All of the Grants Given by the U.S. CHIPS Act
-

 Green2 weeks ago
The Carbon Footprint of Major Travel Methods
-

 United States2 weeks ago
Visualizing the Most Common Pets in the U.S.
-

 Culture2 weeks ago
The World’s Top Media Franchises by All-Time Revenue
-

 Visual Capitalist1 week ago
Best Visualizations of April on the Voronoi App
-

 Wealth1 week ago
Charted: Which Country Has the Most Billionaires in 2024?
-

 Markets1 week ago
The Top Private Equity Firms by Country