Markets
The U.S. States With the Most Million Dollar Homes
Whether it’s a mansion in the suburbs or a penthouse in the city center, the price tag of any prime piece of real estate is usually measured in the millions.
Where in the United States can the most multi-million dollar homes be found – and which specific cities have the highest growth rates for high-end property listings?
Million Dollar Homes
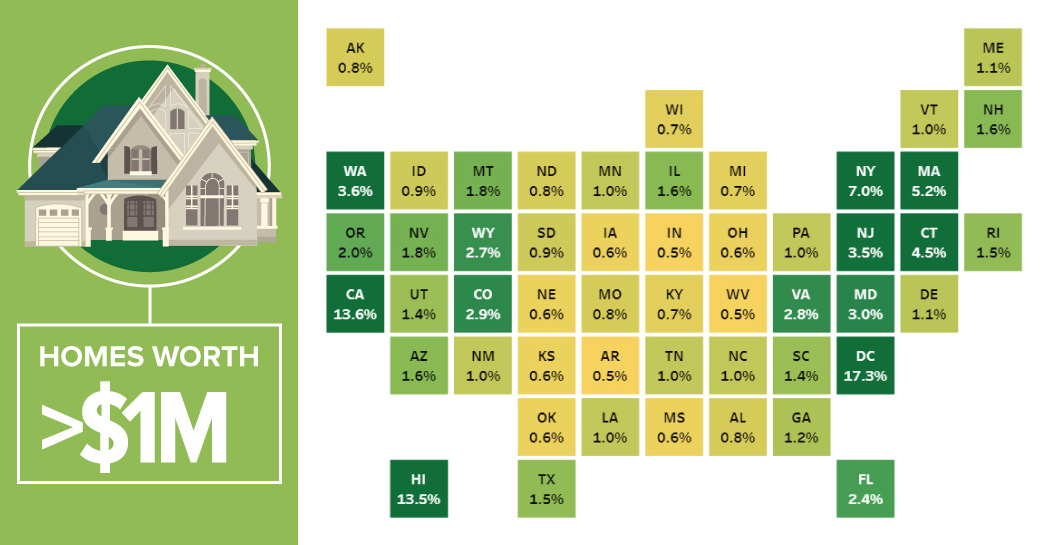
Today’s interactive visualization comes to us from Overflow Data, and it shows the percentage of homes worth greater than a million dollars in each state, as well as D.C.
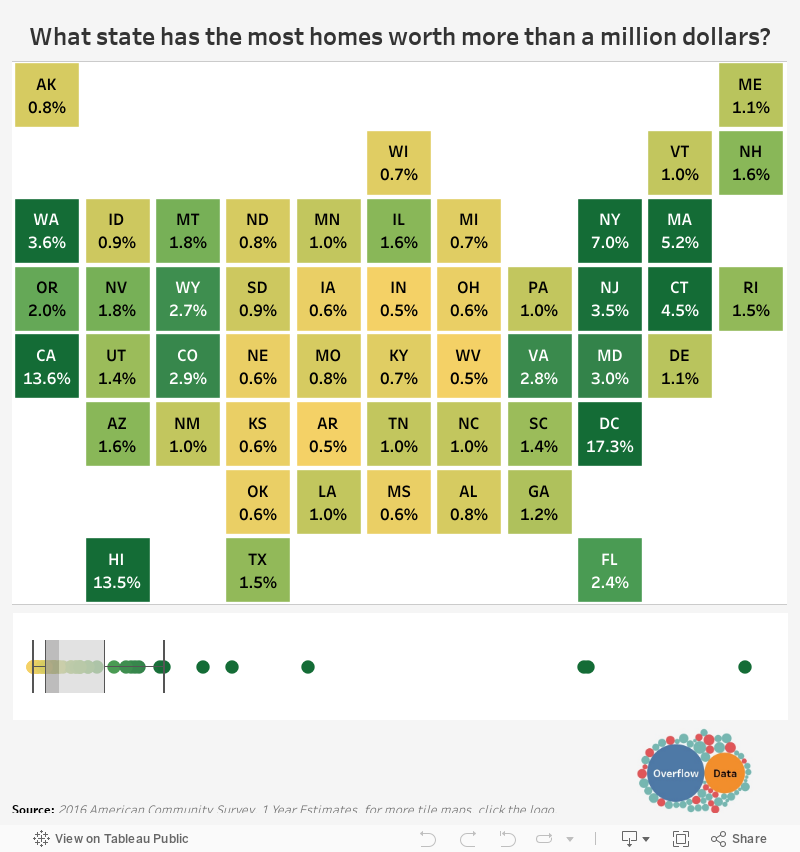
The first thing that stands out here is the skewed distribution.
The rate of million dollar homes per state ranges from 0.5% (Indiana) to 17.3% (D.C.), but the median is only 1.1%. That means that the vast amount of states are closer to the zero end of the spectrum.
In fact, only six jurisdictions exceed the 4% mark:
| Rank | Jurisdiction | % of million dollar homes |
|---|---|---|
| #1 | Washington, D.C. | 17.3% |
| #2 | California | 13.6% |
| #3 | Hawaii | 13.5% |
| #4 | New York | 7.0% |
| #5 | Massachusetts | 5.2% |
| #6 | Connecticut | 4.5% |
Leading the pack is Washington D.C. with 17.3% of all homes exceeding the $1 million benchmark. This puts the nation’s capital ahead of California (13.6%), Hawaii (13.5%), and New York (7.0%).
The high degree of expensive homes in D.C. is not surprising, since the district is a small, urban jurisdiction, with no real “countryside” where more affordable homes can usually be found.
Changing Cities
But what specific cities are trending upwards? Where are there increasing amounts of homes worth over a million bucks?
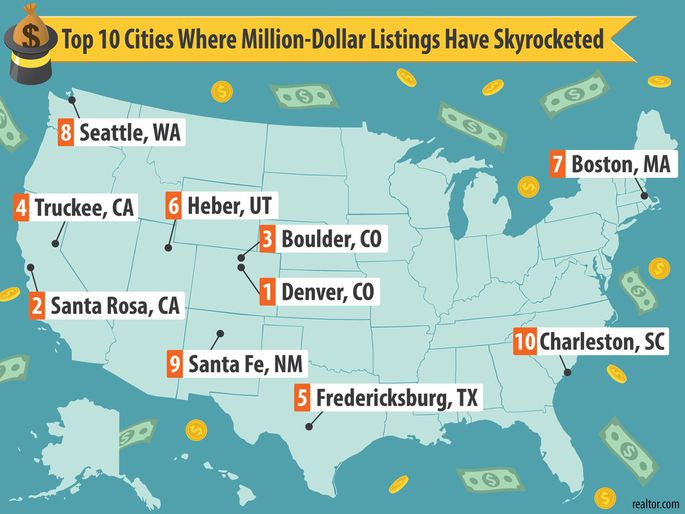
The above map from Realtor.com breaks down the cities that have the biggest increases in million dollar homes over the last three years.
Here’s a closer look:
| Rank | City | >$1mm homes (2017) | >$1 mm homes (2014) | Difference |
|---|---|---|---|---|
| #1 | Denver, CO | 9.4% | 3.3% | +6.1% |
| #2 | Santa Rosa, CA | 14.1% | 8.1% | +6.0% |
| #3 | Boulder, CO | 14.7% | 9.0% | +5.7% |
| #4 | Truckee, CA | 12.4% | 7.1% | +5.3% |
| #5 | Fredericksburg, TX | 13.6% | 9.8% | +3.8% |
| #6 | Heber, UT | 10.5% | 6.8% | +3.7% |
| #7 | Boston, MA | 9.9% | 6.8% | +3.1% |
| #8 | Seattle, WA | 7.7% | 5.3% | +2.4% |
| #9 | Santa Fe, NM | 11.7% | 9.4% | +2.3% |
| #10 | Charleston, SC | 7.0% | 4.9% | +2.1% |
The most impressive representation on the list comes from Colorado, where Denver and Boulder are #1 and #3 respectively.
That said, these cities are anomalies within Colorado as a whole, which has just 2.9% of all homes worth $1 million or more.


Markets
The European Stock Market: Attractive Valuations Offer Opportunities
On average, the European stock market has valuations that are nearly 50% lower than U.S. valuations. But how can you access the market?


European Stock Market: Attractive Valuations Offer Opportunities
Europe is known for some established brands, from L’Oréal to Louis Vuitton. However, the European stock market offers additional opportunities that may be lesser known.
The above infographic, sponsored by STOXX, outlines why investors may want to consider European stocks.
Attractive Valuations
Compared to most North American and Asian markets, European stocks offer lower or comparable valuations.
| Index | Price-to-Earnings Ratio | Price-to-Book Ratio |
|---|---|---|
| EURO STOXX 50 | 14.9 | 2.2 |
| STOXX Europe 600 | 14.4 | 2 |
| U.S. | 25.9 | 4.7 |
| Canada | 16.1 | 1.8 |
| Japan | 15.4 | 1.6 |
| Asia Pacific ex. China | 17.1 | 1.8 |
Data as of February 29, 2024. See graphic for full index names. Ratios based on trailing 12 month financials. The price to earnings ratio excludes companies with negative earnings.
On average, European valuations are nearly 50% lower than U.S. valuations, potentially offering an affordable entry point for investors.
Research also shows that lower price ratios have historically led to higher long-term returns.
Market Movements Not Closely Connected
Over the last decade, the European stock market had low-to-moderate correlation with North American and Asian equities.
The below chart shows correlations from February 2014 to February 2024. A value closer to zero indicates low correlation, while a value of one would indicate that two regions are moving in perfect unison.
| EURO STOXX 50 | STOXX EUROPE 600 | U.S. | Canada | Japan | Asia Pacific ex. China |
|
|---|---|---|---|---|---|---|
| EURO STOXX 50 | 1.00 | 0.97 | 0.55 | 0.67 | 0.24 | 0.43 |
| STOXX EUROPE 600 | 1.00 | 0.56 | 0.71 | 0.28 | 0.48 | |
| U.S. | 1.00 | 0.73 | 0.12 | 0.25 | ||
| Canada | 1.00 | 0.22 | 0.40 | |||
| Japan | 1.00 | 0.88 | ||||
| Asia Pacific ex. China | 1.00 |
Data is based on daily USD returns.
European equities had relatively independent market movements from North American and Asian markets. One contributing factor could be the differing sector weights in each market. For instance, technology makes up a quarter of the U.S. market, but health care and industrials dominate the broader European market.
Ultimately, European equities can enhance portfolio diversification and have the potential to mitigate risk for investors.
Tracking the Market
For investors interested in European equities, STOXX offers a variety of flagship indices:
| Index | Description | Market Cap |
|---|---|---|
| STOXX Europe 600 | Pan-regional, broad market | €10.5T |
| STOXX Developed Europe | Pan-regional, broad-market | €9.9T |
| STOXX Europe 600 ESG-X | Pan-regional, broad market, sustainability focus | €9.7T |
| STOXX Europe 50 | Pan-regional, blue-chip | €5.1T |
| EURO STOXX 50 | Eurozone, blue-chip | €3.5T |
Data is as of February 29, 2024. Market cap is free float, which represents the shares that are readily available for public trading on stock exchanges.
The EURO STOXX 50 tracks the Eurozone’s biggest and most traded companies. It also underlies one of the world’s largest ranges of ETFs and mutual funds. As of November 2023, there were €27.3 billion in ETFs and €23.5B in mutual fund assets under management tracking the index.
“For the past 25 years, the EURO STOXX 50 has served as an accurate, reliable and tradable representation of the Eurozone equity market.”
— Axel Lomholt, General Manager at STOXX
Partnering with STOXX to Track the European Stock Market
Are you interested in European equities? STOXX can be a valuable partner:
- Comprehensive, liquid and investable ecosystem
- European heritage, global reach
- Highly sophisticated customization capabilities
- Open architecture approach to using data
- Close partnerships with clients
- Part of ISS STOXX and Deutsche Börse Group
With a full suite of indices, STOXX can help you benchmark against the European stock market.
Learn how STOXX’s European indices offer liquid and effective market access.

-

 Economy3 days ago
Economic Growth Forecasts for G7 and BRICS Countries in 2024
The IMF has released its economic growth forecasts for 2024. How do the G7 and BRICS countries compare?
-

 Markets2 weeks ago
U.S. Debt Interest Payments Reach $1 Trillion
U.S. debt interest payments have surged past the $1 trillion dollar mark, amid high interest rates and an ever-expanding debt burden.
-

 United States2 weeks ago
Ranked: The Largest U.S. Corporations by Number of Employees
We visualized the top U.S. companies by employees, revealing the massive scale of retailers like Walmart, Target, and Home Depot.
-

 Markets2 weeks ago
The Top 10 States by Real GDP Growth in 2023
This graphic shows the states with the highest real GDP growth rate in 2023, largely propelled by the oil and gas boom.
-

 Markets3 weeks ago
Ranked: The World’s Top Flight Routes, by Revenue
In this graphic, we show the highest earning flight routes globally as air travel continued to rebound in 2023.
-

 Markets3 weeks ago
Ranked: The Most Valuable Housing Markets in America
The U.S. residential real estate market is worth a staggering $47.5 trillion. Here are the most valuable housing markets in the country.

-

 Science1 week ago
Visualizing the Average Lifespans of Mammals
-

 Demographics2 weeks ago
The Smallest Gender Wage Gaps in OECD Countries
-

 United States2 weeks ago
Where U.S. Inflation Hit the Hardest in March 2024
-

 Green2 weeks ago
Top Countries By Forest Growth Since 2001
-
United States2 weeks ago
Ranked: The Largest U.S. Corporations by Number of Employees
-

 Maps2 weeks ago
The Largest Earthquakes in the New York Area (1970-2024)
-

 Green2 weeks ago
Ranked: The Countries With the Most Air Pollution in 2023
-

 Green2 weeks ago
Ranking the Top 15 Countries by Carbon Tax Revenue