Misc
A Timeline of Media-Inflamed Fears (2000-2017)
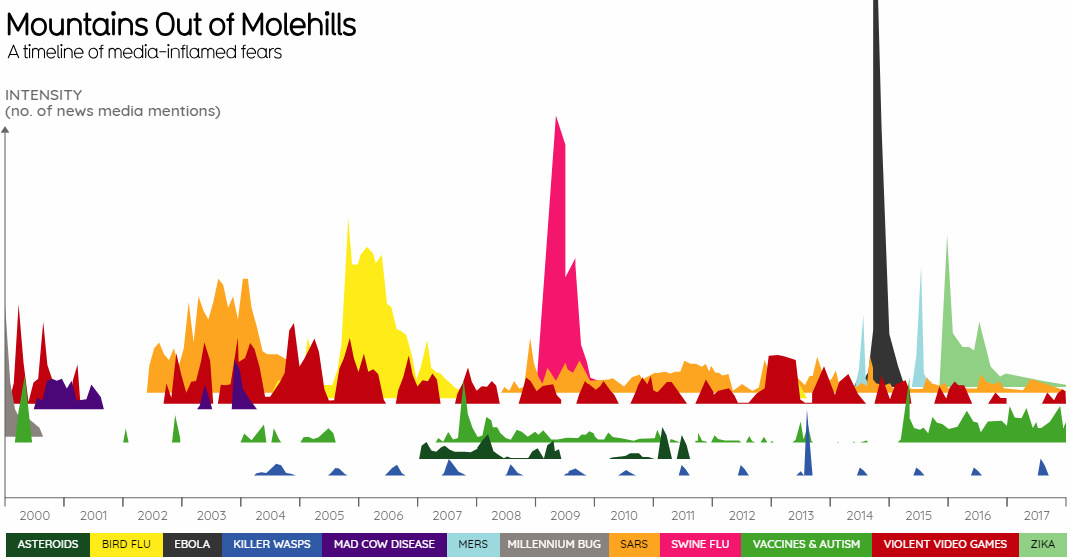
A Timeline of Media-Inflamed Fears (2000-2017)
Modern media does not always have the best reputation for providing complex and nuanced commentary.
The news cycle is sensational enough when we’re dealing with the regular issues of the day. But add in some uncertainty and urgency – such as when the world is dealing with an outbreak like SARS, Mad Cow Disease, Ebola, or even Y2K – and each headline seems to get more provocative or speculative than the last.
Today’s graphics come to us from Information is Beautiful, and they show the intensity of news mentions for different topics that stoked frenzies in the media from 2000-2017.
Visualizing Ebola Sensationalism
We all make mistakes, but headlines for Ebola brought a new level of hyperbole to the table.
“Ebola in the air? A nightmare that could happen” – CNN (link)
“New Ebola Cases May Soon Reach 10,000 a Week, Officials Predict” – NYT (link)
“Ebola as ISIS Bio-Weapon?” – Forbes (link)
In fact, the outbreak in 2014 goes down as the most sensationalized events in the last 17 years.
Here’s all other topics scaled to match Ebola mentions (which go “off the page” in the first graph):
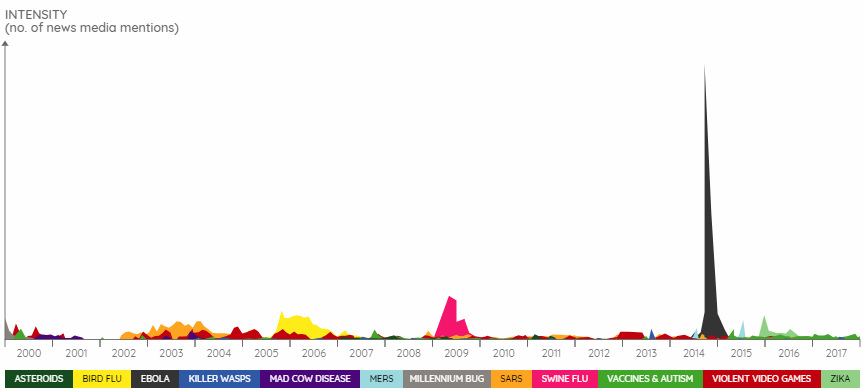
Nothing is even close.
By the way, it turned out that Ebola didn’t mutate into a scary airborne virus. The CNN article with the crazy headline even admits in the body of the article itself: “Speculation that Ebola virus disease might mutate into a form that could easily spread among humans through the air is just that: speculation, unsubstantiated by any evidence.”
Meanwhile, Ebola cases hit a maximum rate of 6,987 in a month, mainly because of delayed reporting of older cases in Liberia. Regardless, that is just 17% of the predicted “10,000 cases per week” rate reported in a New York Times headline.
Finally, as you’re probably aware: ISIS did not weaponize Ebola, either. Made for good clickbait, though.
Scaled to Death
When we scale the data to match total deaths, the sensationalism of many of the outbreaks is even clearer:
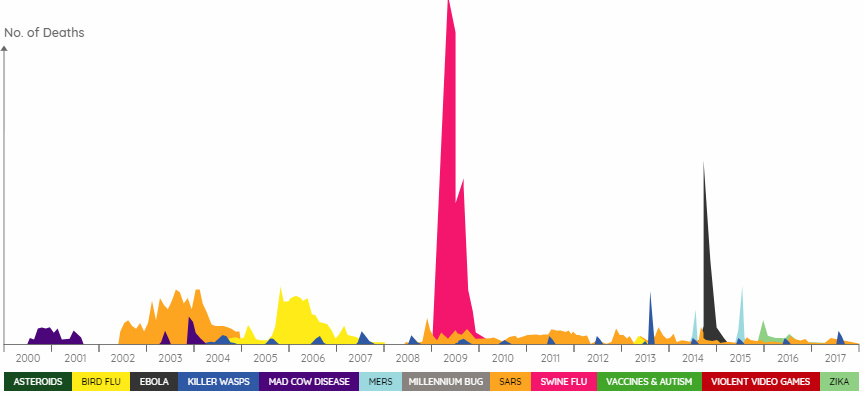
The death count for Ebola did eventually hit 11,310 globally, and Swine Flu resulted in 18,500 lab-confirmed deaths (and potentially many more). However, most of these outbreaks were relatively harmless in relative terms. The Zika Virus, for example, resulted in only a handful of deaths.
While having zero deaths is certainly the ideal, and many of the issues above should be taken very seriously especially as stories develop, we should be careful not to blow things out of proportion. Making mountains out of molehills does not help anyone, and it adds to growing distrust of media in general.


Misc
Visualizing the Most Common Pets in the U.S.
Lions, tigers, and bears, oh my!—these animals do not feature on this list of popular American household pets.


Visualizing The Most Common Pets in the U.S.
This was originally posted on our Voronoi app. Download the app for free on iOS or Android and discover incredible data-driven charts from a variety of trusted sources.
In this graphic, we visualized the most common American household pets, based on 2023-2024 data from the American Pet Products Association (accessed via Forbes Advisor).
Figures represent the number of households that own each pet type, rather than the actual number of each animal. The “small animal” category includes hamsters, gerbils, rabbits, guinea pigs, chinchillas, mice, rats, and ferrets.
What is the Most Popular American Household Pet?
Based on this data, dogs—one of the first domesticated animals—are the most common pets in the United States. In fact, around 65 million households own a dog, and spend an average of $900 a year on their care.
| Rank | Species | Households |
|---|---|---|
| 1 | 🐶 Dog | 65M |
| 2 | 🐱 Cat | 47M |
| 3 | 🐟 Freshwater Fish | 11M |
| 4 | 🐰 Small Animals | 7M |
| 5 | 🐦 Bird | 6M |
| 6 | 🦎 Reptile | 6M |
| 7 | 🐴 Horse | 2M |
| 8 | 🐠 Saltwater Fish | 2M |
Note: Households can own multiple pets, and are counted for all relevant categories.
Cats rank second, at 47 million households, and these smaller felines are a little less expensive to own at $700/year according to Forbes estimates.
But aside from these two juggernauts, there are plenty of other common pet types found in households across the country.
Freshwater fish can be found in 11 million households, along with small animals—rabbits, hamsters, guinea pigs—in 7 million. Meanwhile, nearly 6 million homes have birds or reptiles.
Pet Ownership is on the Rise in America
Forbes found that 66% of all American households (numbering 87 million) own at least one pet, up from 56% in 1988. One third of these (29 million) own multiple pets.
A combination of factors is driving this increase: rising incomes, delayed childbirth, and of course the impact of the pandemic which nearly cleared out animal shelters across the globe.
America’s loneliness epidemic may also be a factor. Fledgling research has shown that single-individual households with pets recorded lower rates of loneliness during the pandemic than those without a pet.

-

 Lithium6 days ago
Ranked: The Top 10 EV Battery Manufacturers in 2023
-

 Green2 weeks ago
Top Countries By Forest Growth Since 2001
-

 United States2 weeks ago
Ranked: The Largest U.S. Corporations by Number of Employees
-

 Maps2 weeks ago
The Largest Earthquakes in the New York Area (1970-2024)
-

 Green2 weeks ago
Ranked: The Countries With the Most Air Pollution in 2023
-

 Green2 weeks ago
Ranking the Top 15 Countries by Carbon Tax Revenue
-

 Markets2 weeks ago
U.S. Debt Interest Payments Reach $1 Trillion
-

 Mining2 weeks ago
Gold vs. S&P 500: Which Has Grown More Over Five Years?