Markets
The World’s Most Famous Case of Deflation
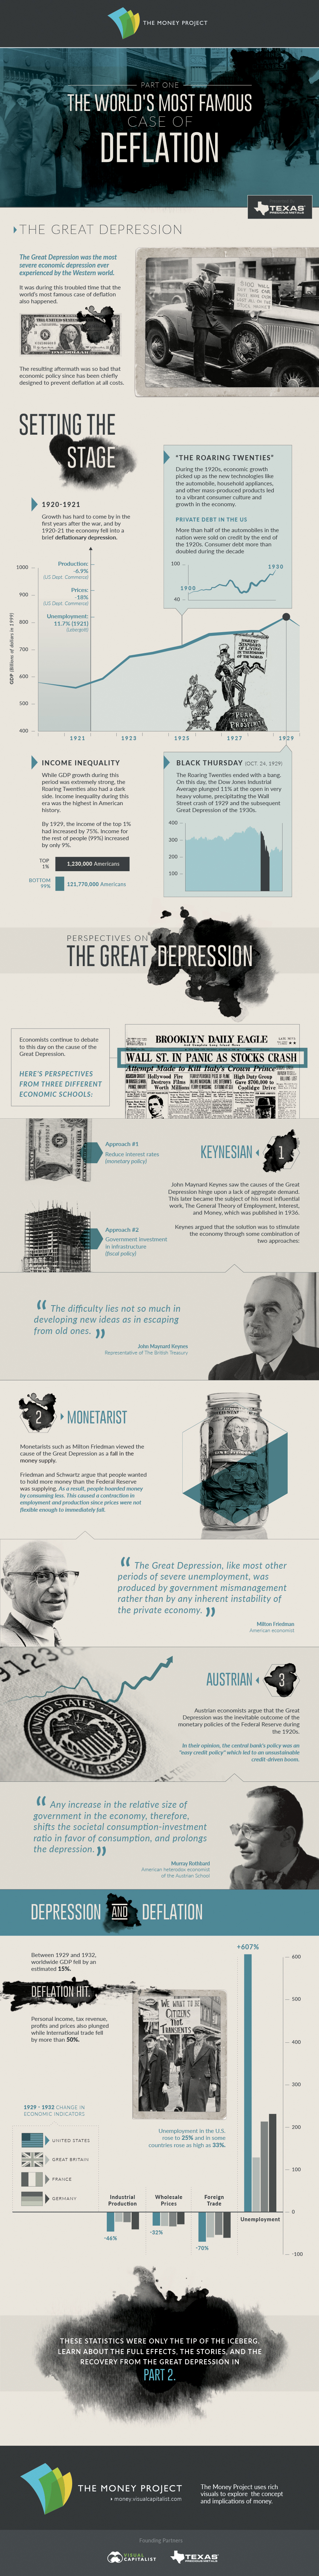
The World’s Most Famous Case of Deflation (Part 1 of 2)
The Money Project is an ongoing collaboration between Visual Capitalist and Texas Precious Metals that seeks to use intuitive visualizations to explore the origins, nature, and use of money.
The Great Depression was the most severe economic depression ever experienced by the Western world.
It was during this troubled time that the world’s most famous case of deflation also happened. The resulting aftermath was so bad that economic policy since has been chiefly designed to prevent deflation at all costs.
Setting the Stage
The transition from wartime to peacetime created a bumpy economic road after World War I.
Growth has hard to come by in the first years after the war, and by 1920-21 the economy fell into a brief deflationary depression. Prices dropped -18%, and unemployment jumped up to 11.7% in 1921.
However, the troubles wouldn’t last. During the “Roaring Twenties”, economic growth picked up as the new technologies like the automobile, household appliances, and other mass-produced products led to a vibrant consumer culture and growth in the economy.
More than half of the automobiles in the nation were sold on credit by the end of the 1920s. Consumer debt more than doubled during the decade.
While GDP growth during this period was extremely strong, the Roaring Twenties also had a dark side. Income inequality during this era was the highest in American history. By 1929, the income of the top 1% had increased by 75%. Income for the rest of people (99%) increased by only 9%.
The Roaring Twenties ended with a bang. On Black Thursday (Oct 24, 1929), the Dow Jones Industrial Average plunged 11% at the open in very heavy volume, precipitating the Wall Street crash of 1929 and the subsequent Great Depression of the 1930s.
The Cause of the Great Depression
Economists continue to debate to this day on the cause of the Great Depression. Here’s perspectives from three different economic schools:
Keynesian:
John Maynard Keynes saw the causes of the Great Depression hinge upon a lack of aggregate demand. This later became the subject of his most influential work, The General Theory of Employment, Interest, and Money, which was published in 1936.
Keynes argued that the solution was to stimulate the economy through some combination of two approaches:
1. A reduction in interest rates (monetary policy), and
2. Government investment in infrastructure (fiscal policy).
“The difficulty lies not so much in developing new ideas as in escaping from old ones.” – John Maynard Keynes
Monetarist:
Monetarists such as Milton Friedman viewed the cause of the Great Depression as a fall in the money supply.
Friedman and Schwartz argue that people wanted to hold more money than the Federal Reserve was supplying. As a result, people hoarded money by consuming less. This caused a contraction in employment and production since prices were not flexible enough to immediately fall.
“The Great Depression, like most other periods of severe unemployment, was produced by government mismanagement rather than by any inherent instability of the private economy.” ― Milton Friedman
Austrian:
Austrian economists argue that the Great Depression was the inevitable outcome of the monetary policies of the Federal Reserve during the 1920s.
In their opinion, the central bank’s policy was an “easy credit policy” which led to an unsustainable credit-driven boom.
“Any increase in the relative size of government in the economy, therefore, shifts the societal consumption-investment ratio in favor of consumption, and prolongs the depression.” – Murray Rothbard
The Great Depression and Deflation
Between 1929 and 1932, worldwide GDP fell by an estimated 15%.
Deflation hit.
Personal income, tax revenue, profits and prices plunged. International trade fell by more than 50%. Unemployment in the U.S. rose to 25% and in some countries rose as high as 33%.
These statistics were only the tip of the iceberg. Learn about the full effects, the stories, and the recovery from the Great Depression in Part 2.
About the Money Project
The Money Project aims to use intuitive visualizations to explore ideas around the very concept of money itself. Founded in 2015 by Visual Capitalist and Texas Precious Metals, the Money Project will look at the evolving nature of money, and will try to answer the difficult questions that prevent us from truly understanding the role that money plays in finance, investments, and accumulating wealth.


Markets
Visualizing Global Inflation Forecasts (2024-2026)
Here are IMF forecasts for global inflation rates up to 2026, highlighting a slow descent of price pressures amid resilient global growth.


Visualizing Global Inflation Forecasts (2024-2026)
Global inflation rates are gradually descending, but progress has been slow.
Today, the big question is if inflation will decline far enough to trigger easing monetary policy. So far, the Federal Reserve has held rates for nine months amid stronger than expected core inflation, which excludes volatile energy and food prices.
Yet looking further ahead, inflation forecasts from the International Monetary Fund (IMF) suggest that inflation will decline as price pressures ease, but the path of disinflation is not without its unknown risks.
This graphic shows global inflation forecasts, based on data from the April 2024 IMF World Economic Outlook.
Get the Key Insights of the IMF’s World Economic Outlook
Want a visual breakdown of the insights from the IMF’s 2024 World Economic Outlook report?
This visual is part of a special dispatch of the key takeaways exclusively for VC+ members.
Get the full dispatch of charts by signing up to VC+.
The IMF’s Inflation Outlook
Below, we show the IMF’s latest projections for global inflation rates through to 2026:
| Year | Global Inflation Rate (%) | Advanced Economies Inflation Rate (%) | Emerging Market and Developing Economies Inflation Rate (%) |
|---|---|---|---|
| 2019 | 3.5 | 1.4 | 5.1 |
| 2020 | 3.2 | 0.7 | 5.2 |
| 2021 | 4.7 | 3.1 | 5.9 |
| 2022 | 8.7 | 7.3 | 9.8 |
| 2023 | 6.8 | 4.6 | 8.3 |
| 2024 | 5.9 | 2.6 | 8.3 |
| 2025 | 4.5 | 2.0 | 6.2 |
| 2026 | 3.7 | 2.0 | 4.9 |
After hitting a peak of 8.7% in 2022, global inflation is projected to fall to 5.9% in 2024, reflecting promising inflation trends amid resilient global growth.
While inflation has largely declined due to falling energy and goods prices, persistently high services inflation poses challenges to mitigating price pressures. In addition, the IMF highlights the potential risk of an escalating conflict in the Middle East, which could lead to energy price shocks and higher shipping costs.
These developments could negatively affect inflation scenarios and prompt central banks to adopt tighter monetary policies. Overall, by 2026, global inflation is anticipated to decline to 3.7%—still notably above the 2% target set by several major economies.
Adding to this, we can see divergences in the path of inflation between advanced and emerging economies. While affluent nations are forecast to see inflation edge closer to the 2% target by 2026, emerging economies are projected to have inflation rates reach 4.9%—falling closer to their pre-pandemic averages.
Get the Full Analysis of the IMF’s Outlook on VC+
This visual is part of an exclusive special dispatch for VC+ members which breaks down the key takeaways from the IMF’s 2024 World Economic Outlook.
For the full set of charts and analysis, sign up for VC+.

-

 Culture6 days ago
The World’s Top Media Franchises by All-Time Revenue
-

 Science2 weeks ago
Visualizing the Average Lifespans of Mammals
-

 Brands2 weeks ago
How Tech Logos Have Evolved Over Time
-

 Energy2 weeks ago
Ranked: The Top 10 EV Battery Manufacturers in 2023
-

 Demographics2 weeks ago
Countries With the Largest Happiness Gains Since 2010
-

 Economy2 weeks ago
VC+: Get Our Key Takeaways From the IMF’s World Economic Outlook
-

 Demographics1 week ago
The Countries That Have Become Sadder Since 2010
-

 Money1 week ago
Charted: Who Has Savings in This Economy?