Energy
Oil is Dirt Cheap… Literally [Chart]
![Oil is Dirt Cheap... Literally [Chart]](https://www.visualcapitalist.com/wp-content/uploads/2016/02/oil-is-dirt-cheap-chart.png)
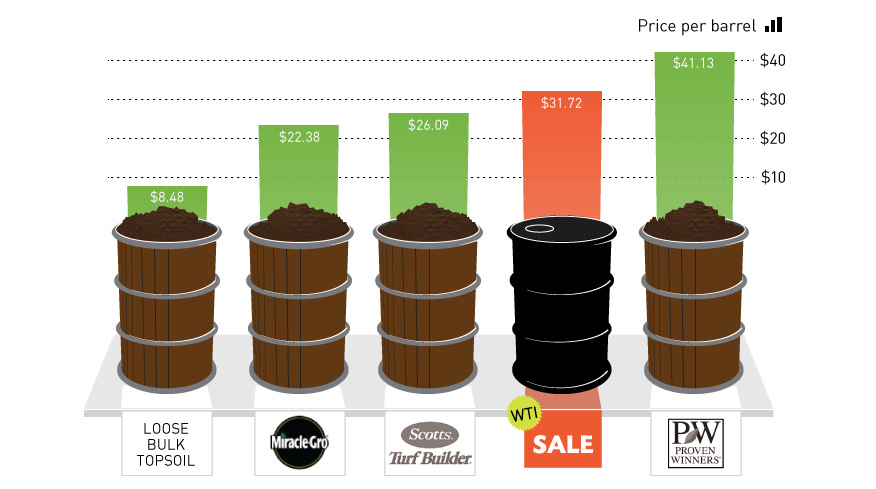
Oil is Dirt Cheap… Literally [Chart]
A barrel of oil is the same price as a barrel of “Scott’s Turf Builder”
The Chart of the Week is a weekly Visual Capitalist feature on Fridays.
In theory, a barrel of crude oil seems quite valuable.
It’s well-known, for example, that from one barrel of oil, a refinery can make 19 gallons of gasoline, 12 gallons of diesel, and four gallons of jet fuel.
That’s the equivalent of six billion joules of energy, or enough to power the average U.S. household for 1.8 months.
A Dirt Cheap Experiment
However, sometimes the laws of supply and demand work in mysterious ways. While it seems like oil has good intrinsic value, the glut of supply available to the market is so great that “black gold” has become very cheap.
Some would even say “dirt cheap”.
As a part of our landmark investigation, we went all the way to the Home Depot’s website to verify if this were actually true. The results were astonishing, and this information will definitely be helpful the next time I need to do some gardening.
| Price | Bags Needed | Cost per barrel | |
|---|---|---|---|
| Loose bulk top soil | $204.00 | 0.04 | $8.48 |
| Miracle Gro | $7.97 | 2.81 | $22.38 |
| Scotts Turf Builder | $6.97 | 3.74 | $26.09 |
| Crude Oil (WTI) | $31.72 | ||
| Proven Winners | $10.99 | 3.74 | $41.13 |
We started by going for the bulk stuff.
For only $135, it’s possible to buy 5 cubic yards of loose bulk top soil. That’s enough for 24 barrels worth, which seemed like a steal. The only downside was that it cost an extra $69 to schedule a dump truck to come by our house, which made it likely overkill for this experiment.
Next, we checked out a bag of Miracle Gro. It’s got the brand name reputation, and this particular bag had a user rating of four stars. At $7.97 for a two cubic feet, we’d just need just less than three bags to fill up a barrel. That works out to $22.38 a barrel. Not bad.
However, if we’re going to be serious about our dirt, we’re going to need something that promotes a strong root system and creates a prime seed-growing environment. We took a peek at Scotts Turf Builder, which is only $6.97 per bag. However, with only 1.5 cubic feet per bag, it’s going to take up over 3.7 to fill up our barrel, bringing our total cost to $26.09.
We’re now within $1.50 of oil’s 52-week low of $27.56.
The Winner
As we continued to shop online for dirt, a five-star gem caught our eye. The brand name was Proven Winners. How could we go wrong with that?
We took a look at the user reviews to be sure.
“I have a high-quality soil-test kit and tested this soil. It is very high in nitrogen, potassium, and phosphorus, so though it will be excellent for plants it is NOT a soil for starting seeds or potting up seedlings,” wrote a previous buyer.
Noted. We will not use it for starting seeds or potting up seedlings. We checked out the price, and for $10.99 per bag containing 1.5 cubic feet, we had our winner. It takes 3.7 of these to fill up our barrel, bringing our cost per barrel of this particularly good dirt to $41.13.
Unfortunately that’s about $10 more than a barrel of oil, but I guess we’ll hedge our bets.


Energy
Charted: 4 Reasons Why Lithium Could Be the Next Gold Rush
Visual Capitalist has partnered with EnergyX to show why drops in prices and growing demand may make now the right time to invest in lithium.


4 Reasons Why You Should Invest in Lithium
Lithium’s importance in powering EVs makes it a linchpin of the clean energy transition and one of the world’s most precious minerals.
In this graphic, Visual Capitalist partnered with EnergyX to explore why now may be the time to invest in lithium.
1. Lithium Prices Have Dropped
One of the most critical aspects of evaluating an investment is ensuring that the asset’s value is higher than its price would indicate. Lithium is integral to powering EVs, and, prices have fallen fast over the last year:
| Date | LiOH·H₂O* | Li₂CO₃** |
|---|---|---|
| Feb 2023 | $76 | $71 |
| March 2023 | $71 | $61 |
| Apr 2023 | $43 | $33 |
| May 2023 | $43 | $33 |
| June 2023 | $47 | $45 |
| July 2023 | $44 | $40 |
| Aug 2023 | $35 | $35 |
| Sept 2023 | $28 | $27 |
| Oct 2023 | $24 | $23 |
| Nov 2023 | $21 | $21 |
| Dec 2023 | $17 | $16 |
| Jan 2024 | $14 | $15 |
| Feb 2024 | $13 | $14 |
Note: Monthly spot prices were taken as close to the 14th of each month as possible.
*Lithium hydroxide monohydrate MB-LI-0033
**Lithium carbonate MB-LI-0029
2. Lithium-Ion Battery Prices Are Also Falling
The drop in lithium prices is just one reason to invest in the metal. Increasing economies of scale, coupled with low commodity prices, have caused the cost of lithium-ion batteries to drop significantly as well.
In fact, BNEF reports that between 2013 and 2023, the price of a Li-ion battery dropped by 82%.
| Year | Price per KWh |
|---|---|
| 2023 | $139 |
| 2022 | $161 |
| 2021 | $150 |
| 2020 | $160 |
| 2019 | $183 |
| 2018 | $211 |
| 2017 | $258 |
| 2016 | $345 |
| 2015 | $448 |
| 2014 | $692 |
| 2013 | $780 |

3. EV Adoption is Sustainable
One of the best reasons to invest in lithium is that EVs, one of the main drivers behind the demand for lithium, have reached a price point similar to that of traditional vehicle.
According to the Kelly Blue Book, Tesla’s average transaction price dropped by 25% between 2022 and 2023, bringing it in line with many other major manufacturers and showing that EVs are a realistic transport option from a consumer price perspective.
| Manufacturer | September 2022 | September 2023 |
|---|---|---|
| BMW | $69,000 | $72,000 |
| Ford | $54,000 | $56,000 |
| Volkswagon | $54,000 | $56,000 |
| General Motors | $52,000 | $53,000 |
| Tesla | $68,000 | $51,000 |
4. Electricity Demand in Transport is Growing
As EVs become an accessible transport option, there’s an investment opportunity in lithium. But possibly the best reason to invest in lithium is that the IEA reports global demand for the electricity in transport could grow dramatically by 2030:
| Transport Type | 2022 | 2025 | 2030 |
|---|---|---|---|
| Buses 🚌 | 23,000 GWh | 50,000 GWh | 130,000 GWh |
| Cars 🚙 | 65,000 GWh | 200,000 GWh | 570,000 GWh |
| Trucks 🛻 | 4,000 GWh | 15,000 GWh | 94,000 GWh |
| Vans 🚐 | 6,000 GWh | 16,000 GWh | 72,000 GWh |
The Lithium Investment Opportunity
Lithium presents a potentially classic investment opportunity. Lithium and battery prices have dropped significantly, and recently, EVs have reached a price point similar to other vehicles. By 2030, the demand for clean energy, especially in transport, will grow dramatically.
With prices dropping and demand skyrocketing, now is the time to invest in lithium.
EnergyX is poised to exploit lithium demand with cutting-edge lithium extraction technology capable of extracting 300% more lithium than current processes.

-

 Lithium3 days ago
Ranked: The Top 10 EV Battery Manufacturers in 2023
Asia dominates this ranking of the world’s largest EV battery manufacturers in 2023.
-

 Energy1 week ago
The World’s Biggest Nuclear Energy Producers
China has grown its nuclear capacity over the last decade, now ranking second on the list of top nuclear energy producers.
-

 Energy4 weeks ago
The World’s Biggest Oil Producers in 2023
Just three countries accounted for 40% of global oil production last year.
-

 Energy1 month ago
How Much Does the U.S. Depend on Russian Uranium?
Currently, Russia is the largest foreign supplier of nuclear power fuel to the U.S.
-

 Uranium2 months ago
Charted: Global Uranium Reserves, by Country
We visualize the distribution of the world’s uranium reserves by country, with 3 countries accounting for more than half of total reserves.
-

 Energy3 months ago
Visualizing the Rise of the U.S. as Top Crude Oil Producer
Over the last decade, the United States has established itself as the world’s top producer of crude oil, surpassing Saudi Arabia and Russia.

-

 Mining1 week ago
Gold vs. S&P 500: Which Has Grown More Over Five Years?
-

 Markets2 weeks ago
Ranked: The Most Valuable Housing Markets in America
-

 Money2 weeks ago
Which States Have the Highest Minimum Wage in America?
-

 AI2 weeks ago
Ranked: Semiconductor Companies by Industry Revenue Share
-

 Markets2 weeks ago
Ranked: The World’s Top Flight Routes, by Revenue
-

 Countries2 weeks ago
Population Projections: The World’s 6 Largest Countries in 2075
-

 Markets2 weeks ago
The Top 10 States by Real GDP Growth in 2023
-

 Demographics2 weeks ago
The Smallest Gender Wage Gaps in OECD Countries