Money
Investing in the Rise of the New Spending Class
Investing in the Rise of the New Spending Class
It’s no secret that the world has been a little down on China.
The world’s most populous country has been the primary engine of economic growth for decades, but recently investor optimism around China has diminished significantly. With a sliding manufacturing sector and lower GDP growth, most mainstream pundits have shifted focus to whether the country will have a “soft” or a “hard” landing.
Ever the contrarian, investor and author Gianni Kovacevic is not one to buy into this Kool Aid.
In his new book “My Electrician Drives a Porsche?”, Kovacevic examines the fundamentals around China and other emerging markets to create perspective on the newest and fastest-growing generation of consumers. Using an allegorical conversation between a doctor and his Porsche-driving electrician, the impact and ripple effects of this new “spending class” are described, affecting everything from the economy to the environment.
We thought the book had some great statistics on emerging markets, and that the easy-to-follow conversation was an effective way at introducing the contrarian way of thinking. Further, the book also outlines an interesting track on how to invest in green energy specifically.
Key Themes
Today’s infographic pulls some of the themes from this book to show who makes up the new spending class, and why their inevitable rise will translate to a blossoming green energy sector. There is much more meat to the book and to avoid spoilers, we’ve left out Kovacevic’s ultimate investment conclusion.
However, here are some of the points that we thought were most compelling:
Millennials
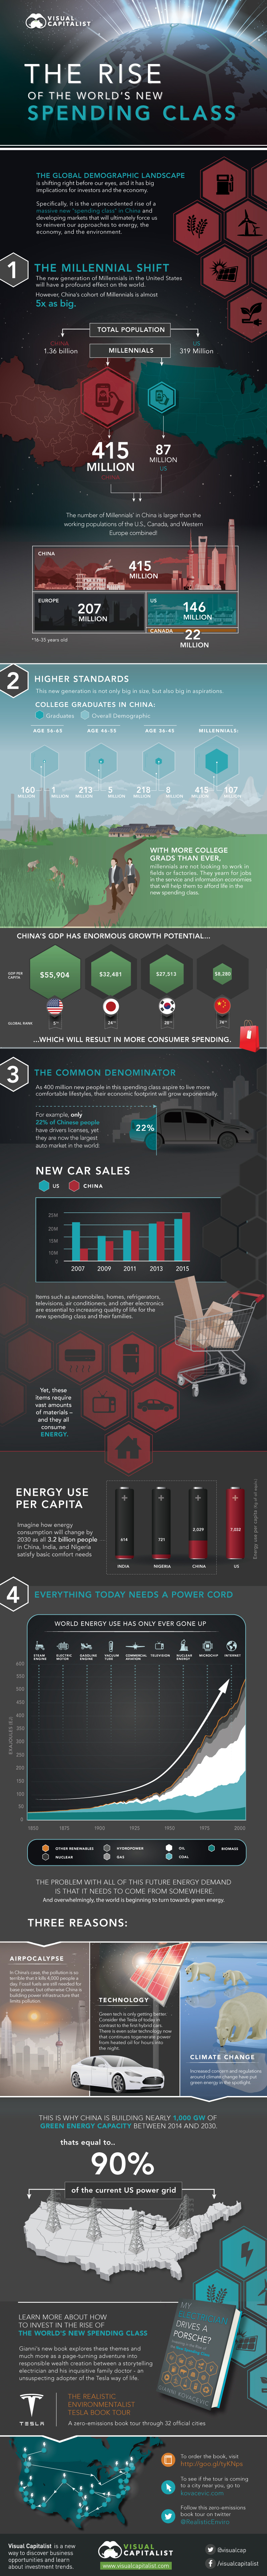
Millennials get a lot of media coverage in the United States. There’s 87 million of them and they have already had a profound impact on the economy. That said, it is incredible to think that the same generation in China is nearly 5x as big with 415 million people. This cohort of millennials (16-35 years old) in China is larger than the entire working populations of the U.S., Canada, and Western Europe combined.
Millennials in China and other emerging markets are nothing like previous generations. For example, in China, millennials have already earned 107 million college degrees, while all other previous generations have combined for a grand total of only 14 million. Newly educated and aware of the modern world through technology, China’s millennials do not want to work in factories or fields.
Spending Class Potential
China’s spectacular growth isn’t coming to an end anytime soon. The country is in 74th place worldwide in GDP per capita with $8,280. This is compared to neighboring countries such as Japan and South Korea, which have amounts closer to $30,000 per capita.
Only 22% of the Chinese population has drivers licenses, yet the country is already the largest auto market in the world with close to 25 million cars sold per year. Imagine how many refrigerators, air conditioners, and other basic comfort products the spending class will be buying over the coming years as their disposable income rises.
Energy
The common denominator of these goods is that they all take significant amounts of raw materials and energy to manufacture. Most of these goods, such as refrigerators or air conditions, require great amounts of energy to constantly power as well.
Today, the average person in China uses less than 30% of the energy used each year by an American. As 400 million people buy these essential goods of human progress and comfort, the energy draw will rise rapidly. Where will this energy come from?
Certainly all power sources will be a part of this energy mix going forward, but China is leaning green the most. Air pollution is so bad in China that it is commonly referred to as the “Airpocalypse”. It’s estimated that pollution kills 4,000 people per day in China, and green energy will help combat this problem.
That’s why China is building 1,000 GW of green energy capacity between 2014 and 2030, which is the equivalent of 90% of the entire current U.S. energy grid.
Tesla Tour
To amplify the message of the book, Gianni Kovacevic is embarking on “The Realistic Environmentalist Tesla Tour” to 32 official cities in North America. This one-of-a-kind, zero emissions book tour will be facilitated by driving a Tesla Model S from Toronto to California. The objective is to enlighten millions of people by illustrating what makes green energy and human progress factually possible while debunking common myths from the validity of electric cars to the future of energy.
Here’s more on the Tesla Tour in his own words:


Money
Charted: Who Has Savings in This Economy?
Older, better-educated adults are winning the savings game, reveals a January survey by the National Opinion Research Center at the University of Chicago.


Who Has Savings in This Economy?
This was originally posted on our Voronoi app. Download the app for free on iOS or Android and discover incredible data-driven charts from a variety of trusted sources.
Two full years of inflation have taken their toll on American households. In 2023, the country’s collective credit card debt crossed $1 trillion for the first time. So who is managing to save money in the current economic environment?
We visualize the percentage of respondents to the statement “I have money leftover at the end of the month” categorized by age and education qualifications. Data is sourced from a National Endowment for Financial Education (NEFE) report, published last month.
The survey for NEFE was conducted from January 12-14, 2024, by the National Opinion Research Center at the University of Chicago. It involved 1,222 adults aged 18+ and aimed to be representative of the U.S. population.
Older Americans Save More Than Their Younger Counterparts
General trends from this dataset indicate that as respondents get older, a higher percentage of them are able to save.
| Age | Always/Often | Sometimes | Rarely/Never |
|---|---|---|---|
| 18–29 | 29% | 33% | 38% |
| 30–44 | 36% | 27% | 37% |
| 45–59 | 39% | 23% | 38% |
| Above 60 | 49% | 28% | 23% |
| All Adults | 39% | 33% | 27% |
Note: Percentages are rounded and may not sum to 100.
Perhaps not surprisingly, those aged 60+ are the age group with the highest percentage saying they have leftover money at the end of the month. This age group spent the most time making peak earnings in their careers, are more likely to have investments, and are more likely to have paid off major expenses like a mortgage or raising a family.
The Impact of Higher Education on Earnings and Savings
Based on this survey, higher education dramatically improves one’s ability to save. Shown in the table below, those with a bachelor’s degree or higher are three times more likely to have leftover money than those without a high school diploma.
| Education | Always/Often | Sometimes | Rarely/Never |
|---|---|---|---|
| No HS Diploma | 18% | 26% | 56% |
| HS Diploma | 28% | 33% | 39% |
| Associate Degree | 33% | 31% | 36% |
| Bachelor/Higher Degree | 59% | 21% | 20% |
| All Adults | 39% | 33% | 27% |
Note: Percentages are rounded and may not sum to 100.
As the Bureau of Labor Statistics notes, earnings improve with every level of education completed.
For example, those with a high school diploma made 25% more than those without in 2022. And as the qualifications increase, the effects keep stacking.
Meanwhile, a Federal Reserve study also found that those with more education tended to make financial decisions that contributed to building wealth, of which the first step is to save.

-

 Green1 week ago
Ranked: The Countries With the Most Air Pollution in 2023
-

 Automotive2 weeks ago
Almost Every EV Stock is Down After Q1 2024
-

 AI2 weeks ago
The Stock Performance of U.S. Chipmakers So Far in 2024
-

 Markets2 weeks ago
Charted: Big Four Market Share by S&P 500 Audits
-

 Real Estate2 weeks ago
Ranked: The Most Valuable Housing Markets in America
-

 Money2 weeks ago
Which States Have the Highest Minimum Wage in America?
-

 AI2 weeks ago
Ranked: Semiconductor Companies by Industry Revenue Share
-

 Travel2 weeks ago
Ranked: The World’s Top Flight Routes, by Revenue