Politics
The Demise of the Venezuelan Bolívar Continues [Chart]
![The Demise of the Venezuelan Bolívar Continues [Chart]](https://www.visualcapitalist.com/wp-content/uploads/2015/05/venezuela-russia-oil-chart.png)
The Demise of the Venezuelan Bolívar Continues [Chart]
The Chart of the Week is a weekly feature in Visual Capitalist on Fridays.
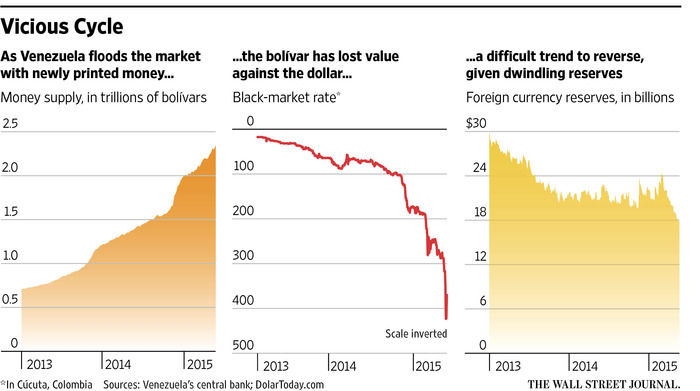
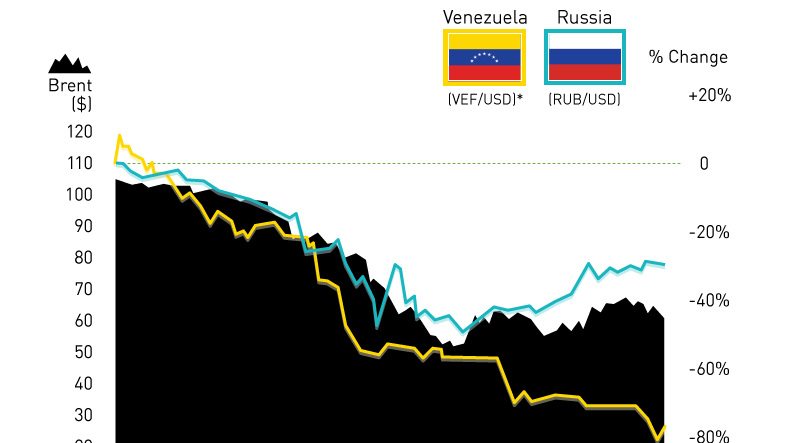
When the price of oil got crushed in mid-2014, there was no doubt that economies heavily reliant on oil exports would feel a pinch. Russia and Venezuela are no exception, and their currencies have been some of the most interesting stories emerging from this new oil price reality.
Russia’s ruble had declined almost 40% against the US dollar over the next six months, only to rebound at the beginning of 2015 along with the price of Brent. Venezuela, which needs to sell oil at $89 to breakeven on their budget, has also seen their currency flop. However, the circumstances are very different.
While the Russian ruble was able to rebound somewhat, the Venezuelan bolívar has continued to depreciate to close to 80% against the USD since the oil price went down the tubes. This is only part of an even bigger decline since Nicolas Maduro took office two years ago, and the oil price isn’t the only thing to blame. The country’s draconian capital flight controls, waning foreign currency reserves, and money printing are also factors.
Of course, news of the struggling bolívar isn’t based on the official information from the Venezuelan government – it comes from the black market rates that citizens pay in a nearby Colombian border town for dollars. The government is currently working to shut down the widely followed website that publishes these rates, known as DolarToday.
In the past two weeks, the decimation of the Venezuelan bolívar has gained even more momentum. It now costs around 400 bolívars to buy $1, when it took about 300 on May 14th. The largest currency note in the country is a 100-bolívar bill, and it is now worth around a mere quarter in US terms. When hyperinflation gains any traction, it can be extremely hard to stop.
International companies are beginning to no longer accepting bolívars. Ford announced that it will only accept USD in Venezuela, and American Airlines only allows customers to buy online with dollars.
DolarToday estimates inflation for bolívars at 68.5%, but other calculations have implied inflation as high as 510%.


Politics
Charted: Trust in Government Institutions by G7 Countries
How much do you trust the government and its various institutions? We look at data for G7 countries for the time period of 2006-2023.


Trust in Government Institutions by G7 Countries
This was originally posted on our Voronoi app. Download the app for free on iOS or Android and discover incredible data-driven charts from a variety of trusted sources.
How much do you trust the government, and its various institutions?
It’s likely that your level of confidence probably depends on a wide range of factors, such as perceived competency, historical context, economic performance, accountability, social cohesion, and transparency.
And for these same reasons, trust levels in government institutions also change all the time, even in the world’s most developed countries: the G7.
Confidence in Government by G7 Countries (2006-2023)
This chart looks at the changes in trust in government institutions between the years 2006 and 2023, based on data from a multi-country Gallup poll.
Specifically, this dataset aggregates confidence in multiple national institutions, including the military, the judicial system, the national government, and the integrity of the electoral system.
| Country | Confidence (2006) | Confidence (2023) | Change (p.p.) |
|---|---|---|---|
| Canada | 57% | 64% | +7 |
| Britain | 63% | 63% | +0 |
| Germany | 55% | 61% | +6 |
| France | 54% | 60% | +6 |
| Japan | 48% | 59% | +11 |
| Italy | 41% | 54% | +13 |
| United States | 63% | 50% | -13 |
What’s interesting here is that in the G7, a group of the world’s most developed economies, there is only one country bucking the general trend: the United States.
Across most G7 countries, confidence in institutions has either improved or stayed the same between 2006 and 2023. The largest percentage point (p.p.) increases occur in Italy and Japan, which saw +13 p.p. and +11 p.p. increases in trust over the time period.
In the U.S., however, confidence in government institutions has fallen by 13 p.p. over the years. What happened?
Key Figures on U.S. Trust in Institutions
In 2006, the U.S. was tied with the UK as having the highest confidence in government institutions, at 63%.
But here’s where the scores stand in 2023, across various institutions:
| 🇺🇸 Institutions | Confidence (2023) |
|---|---|
| Military | 81% |
| Judiciary | 42% |
| National Government | 30% |
| Elections | 44% |
| Overall | 49% |
Based on this data, it’s clear that the U.S. lags behind in three key indicators: confidence in the national government, confidence in the justice system, and confidence in fair elections. It ranked in last place for each indicator in the G7.
One other data point that stands out: despite leading the world in military spending, the U.S. is only the third most confident in its military in the G7. It lags behind France (86%) and the United Kingdom (83%).

-

 Wealth6 days ago
Charted: Which City Has the Most Billionaires in 2024?
-

 Mining2 weeks ago
Gold vs. S&P 500: Which Has Grown More Over Five Years?
-

 Uranium2 weeks ago
The World’s Biggest Nuclear Energy Producers
-

 Education2 weeks ago
How Hard Is It to Get Into an Ivy League School?
-

 Debt2 weeks ago
How Debt-to-GDP Ratios Have Changed Since 2000
-

 Sports2 weeks ago
The Highest Earning Athletes in Seven Professional Sports
-

 Science2 weeks ago
Visualizing the Average Lifespans of Mammals
-

 Brands1 week ago
How Tech Logos Have Evolved Over Time