Misc
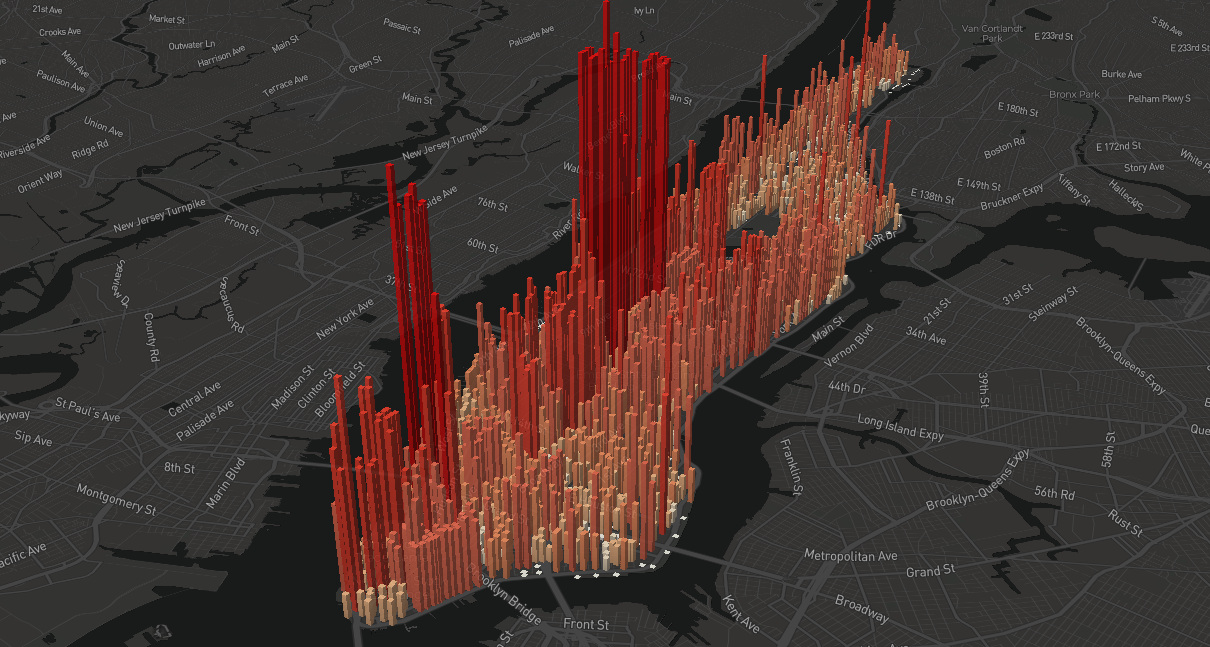
Animation: The Population Pulse of a Manhattan Workday
In cities around the world, the offices and storefronts of the downtown core fill up with people during the workday to keep the wheels of commerce turning.
Nowhere is this phenomenon as pronounced as in Manhattan, which swells to an incredible four million people during work hours. Today’s animation, created by Justin Fung, is a dramatic, eye-opening look at the “pulse” of America’s largest city.
Also, check out the fancy interactive version of this visualization.
This dramatic shift in population on a daily basis is made possible by Manhattan’s unparalleled carrying capacity, or its ability to facilitate an inflow of millions of people who come for all sorts of reasons. Many of the metropolises with the most dramatic daytime population spikes, such as Washington, D.C. and New York, also have much higher rates of transit ridership than the average city.
Not surprisingly, three surrounding boroughs have the largest daytime population decreases in the entire country.
| Borough | Daytime Population Change |
|---|---|
| Queens | -366,000 |
| Brooklyn | -297,000 |
| Bronx | -162,000 |
Outside the Big Apple
While many parts of Manhattan remain lively in the evening, many downtown cores around the country simply empty out.
This stark contrast is particularly noticeable in low-rise communities with large employment hubs such as Redmond, Washington or Palo Alto, California, both of which are home to sprawling tech campuses.
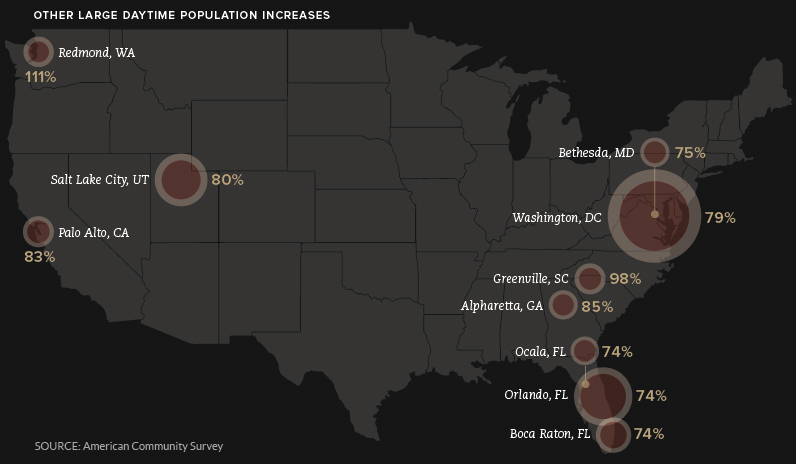
In the case of the nation’s capital, the city is a powerful magnet for talent. As well, Washington’s unique position between state lines means that people have the option of residing in Virginia or Maryland and easily commuting in.
Higher Resting Heartbeat
Thanks to a renewed interest in urban living, many cities are starting to see an uptick in the number of residents who choose to skip the long commute and just live where the action is.
This trend is particularly pronounced in Canadian cities such as Vancouver and Toronto. The latter city’s downtown population is expected to double over the next 25 years, while Vancouver’s sustained real estate boom has added tens of thousands of residents to the downtown area.
In the U.S., Seattle has demonstrated significant urban residential growth. Since 2010, the population of downtown and surrounding neighborhoods has grown by an impressive 18%, and 1-in-5 people moving to the city choose to live in the downtown area.
The 2020 U.S. Census will provide a much better clearer picture of how this trend is playing out.


Misc
Visualizing the Most Common Pets in the U.S.
Lions, tigers, and bears, oh my!—these animals do not feature on this list of popular American household pets.


Visualizing The Most Common Pets in the U.S.
This was originally posted on our Voronoi app. Download the app for free on iOS or Android and discover incredible data-driven charts from a variety of trusted sources.
In this graphic, we visualized the most common American household pets, based on 2023-2024 data from the American Pet Products Association (accessed via Forbes Advisor).
Figures represent the number of households that own each pet type, rather than the actual number of each animal. The “small animal” category includes hamsters, gerbils, rabbits, guinea pigs, chinchillas, mice, rats, and ferrets.
What is the Most Popular American Household Pet?
Based on this data, dogs—one of the first domesticated animals—are the most common pets in the United States. In fact, around 65 million households own a dog, and spend an average of $900 a year on their care.
| Rank | Species | Households |
|---|---|---|
| 1 | 🐶 Dog | 65M |
| 2 | 🐱 Cat | 47M |
| 3 | 🐟 Freshwater Fish | 11M |
| 4 | 🐰 Small Animals | 7M |
| 5 | 🐦 Bird | 6M |
| 6 | 🦎 Reptile | 6M |
| 7 | 🐴 Horse | 2M |
| 8 | 🐠 Saltwater Fish | 2M |
Note: Households can own multiple pets, and are counted for all relevant categories.
Cats rank second, at 47 million households, and these smaller felines are a little less expensive to own at $700/year according to Forbes estimates.
But aside from these two juggernauts, there are plenty of other common pet types found in households across the country.
Freshwater fish can be found in 11 million households, along with small animals—rabbits, hamsters, guinea pigs—in 7 million. Meanwhile, nearly 6 million homes have birds or reptiles.
Pet Ownership is on the Rise in America
Forbes found that 66% of all American households (numbering 87 million) own at least one pet, up from 56% in 1988. One third of these (29 million) own multiple pets.
A combination of factors is driving this increase: rising incomes, delayed childbirth, and of course the impact of the pandemic which nearly cleared out animal shelters across the globe.
America’s loneliness epidemic may also be a factor. Fledgling research has shown that single-individual households with pets recorded lower rates of loneliness during the pandemic than those without a pet.

-

 Demographics7 days ago
Countries With the Largest Happiness Gains Since 2010
-

 Business2 weeks ago
Ranked: The Largest U.S. Corporations by Number of Employees
-

 Maps2 weeks ago
The Largest Earthquakes in the New York Area (1970-2024)
-

 Green2 weeks ago
Ranked: The Countries With the Most Air Pollution in 2023
-

 Green2 weeks ago
Ranking the Top 15 Countries by Carbon Tax Revenue
-

 Markets2 weeks ago
U.S. Debt Interest Payments Reach $1 Trillion
-

 Mining2 weeks ago
Gold vs. S&P 500: Which Has Grown More Over Five Years?
-

 Energy2 weeks ago
The World’s Biggest Nuclear Energy Producers