Misc
Beautiful Maps of the World’s Watersheds
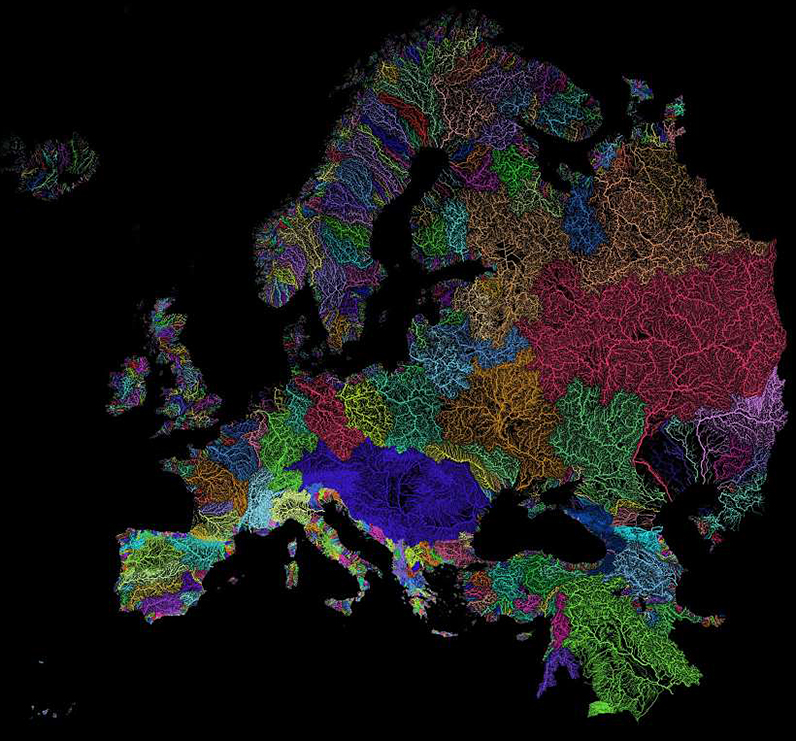
Nothing is more fundamental to life than water – and this is particularly evident in a country like Egypt, which has been aptly described by Greek historian Herodotus as the “Gift of the Nile”.
In Egypt, an astonishing 95% of the population lives alongside the mighty Nile, which is the world’s longest river at 4,258 mi (6,853 km) and also the only major source of freshwater in an otherwise arid desert landscape.
The World’s Watersheds
The Nile isn’t alone in creating the right conditions for life. Rivers of all sizes help form the world’s watersheds, and together they comprise a “circulatory system” that pumps life into every corner of the globe.
Today’s stunning maps, via geographer Szűcs Róbert, divide our planet’s watersheds into colorful catchment areas, and provide an informative look at how water flows across continents.
When Rivers Take the Long Way ‘Round
Grade school physics teaches us that liquid water will take the most available path of least resistance. Sometimes though, that most available path can take water from mountains clear across a continent before reaching an ocean.
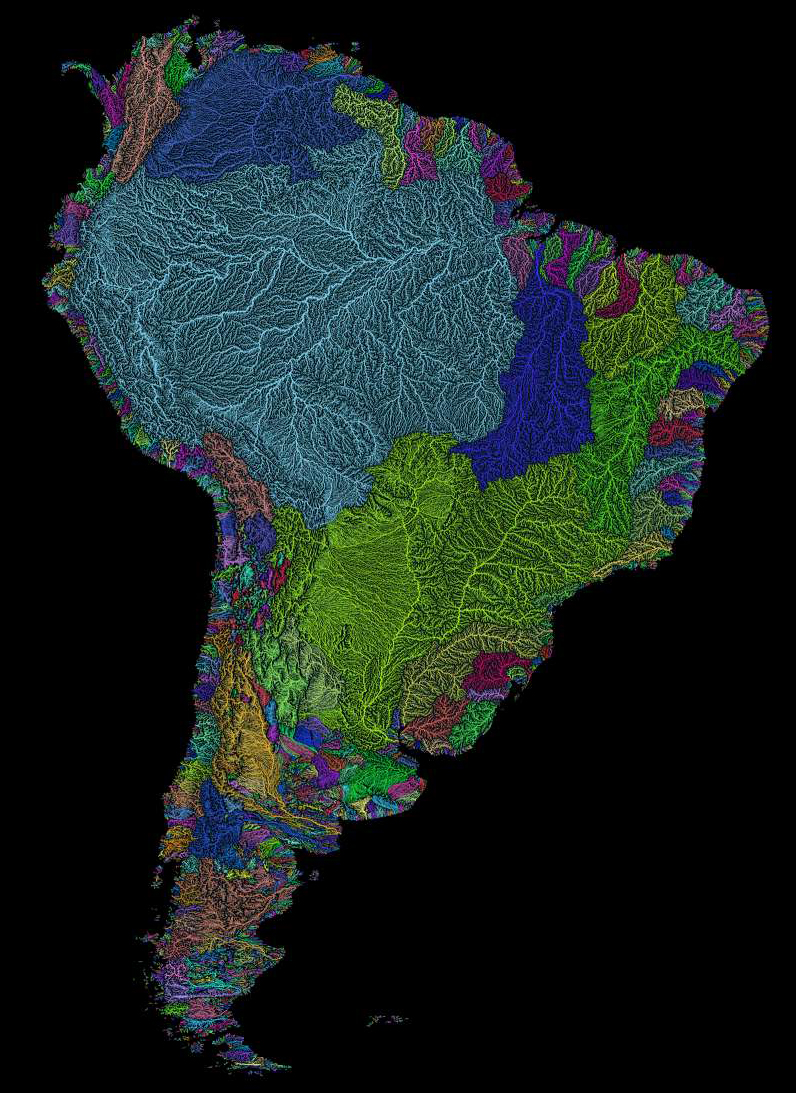
Nowhere is this more evident than in Peru, home of the glacier-packed Cordillera Blanca. As rain and meltwater begins flowing from the peaks of the Andes Mountains, there are two diverging paths to the ocean.
The journey to the Pacific Ocean is a quick one, and there are small rivers at regular intervals along the coast of Peru.
Because trade winds blow east-to-west in that region, most of the water flows down the eastern side of the Andes, the beginning of a journey across the continent (as demonstrated by the light blue section of Róbert’s South America map.)
Without the Andes acting as a backstop for rain, the Amazon rainforest would not exist in its current scale and form.
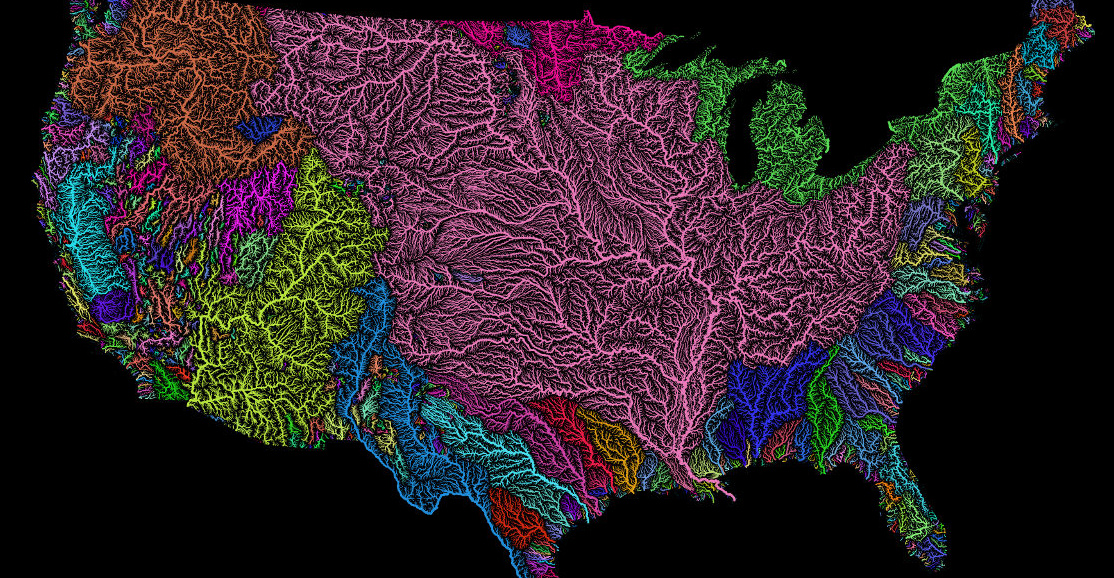
When Three Become One
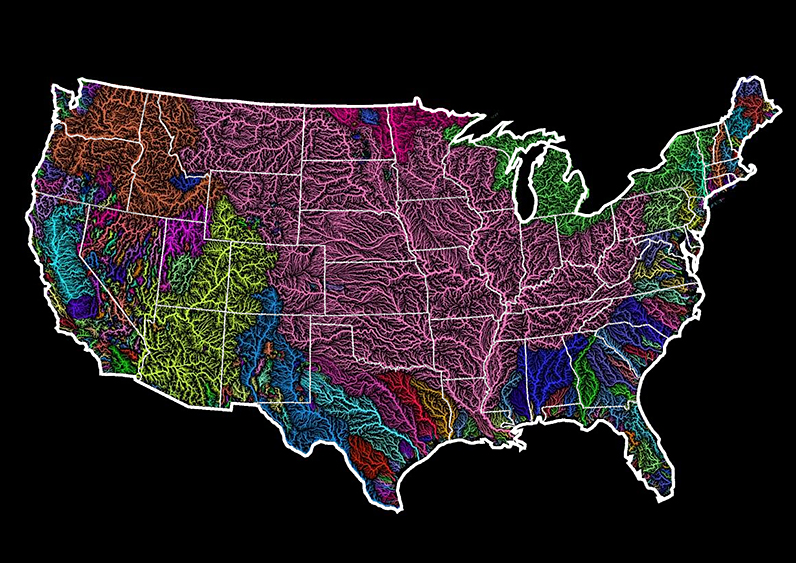
In the United States, the dominant drainage basin is the Jefferson-Mississippi-Missouri River system (shown in pink on the map above.) This massive basin collects water from over 40% of the contiguous U.S., and comes into contact with two Canadian provinces and 31 states before terminating at the Gulf of Mexico.
The Top Ranked Rivers
The Amazon discharges far more water than any other river on earth, dumping more water per second into the ocean than the next four largest rivers combined. That makes the Amazon a clear winner in this category.
In terms of drainage area though, the Amazon is not as dominant:
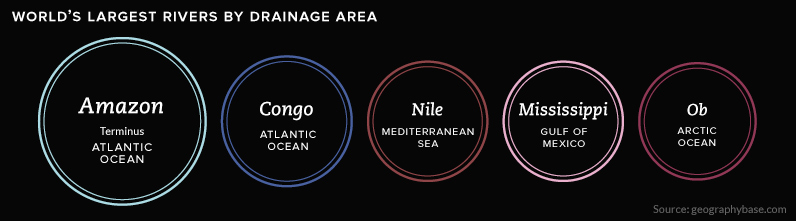
In fact, there are multiple rivers that cover massive drainage areas. This includes the Congo in Africa, as well as the mighty Mississippi, which is neck-and-neck with the Nile.
For more, view the full collection of maps here.


VC+
VC+: Get Our Key Takeaways From the IMF’s World Economic Outlook
A sneak preview of the exclusive VC+ Special Dispatch—your shortcut to understanding IMF’s World Economic Outlook report.

Have you read IMF’s latest World Economic Outlook yet? At a daunting 202 pages, we don’t blame you if it’s still on your to-do list.
But don’t worry, you don’t need to read the whole April release, because we’ve already done the hard work for you.
To save you time and effort, the Visual Capitalist team has compiled a visual analysis of everything you need to know from the report—and our VC+ Special Dispatch is available exclusively to VC+ members. All you need to do is log into the VC+ Archive.
If you’re not already subscribed to VC+, make sure you sign up now to access the full analysis of the IMF report, and more (we release similar deep dives every week).
For now, here’s what VC+ members get to see.
Your Shortcut to Understanding IMF’s World Economic Outlook
With long and short-term growth prospects declining for many countries around the world, this Special Dispatch offers a visual analysis of the key figures and takeaways from the IMF’s report including:
- The global decline in economic growth forecasts
- Real GDP growth and inflation forecasts for major nations in 2024
- When interest rate cuts will happen and interest rate forecasts
- How debt-to-GDP ratios have changed since 2000
- And much more!

Get the Full Breakdown in the Next VC+ Special Dispatch
VC+ members can access the full Special Dispatch by logging into the VC+ Archive, where you can also check out previous releases.
Make sure you join VC+ now to see exclusive charts and the full analysis of key takeaways from IMF’s World Economic Outlook.
Don’t miss out. Become a VC+ member today.
What You Get When You Become a VC+ Member
VC+ is Visual Capitalist’s premium subscription. As a member, you’ll get the following:
- Special Dispatches: Deep dive visual briefings on crucial reports and global trends
- Markets This Month: A snappy summary of the state of the markets and what to look out for
- The Trendline: Weekly curation of the best visualizations from across the globe
- Global Forecast Series: Our flagship annual report that covers everything you need to know related to the economy, markets, geopolitics, and the latest tech trends
- VC+ Archive: Hundreds of previously released VC+ briefings and reports that you’ve been missing out on, all in one dedicated hub
You can get all of the above, and more, by joining VC+ today.

-

 Energy1 week ago
The World’s Biggest Nuclear Energy Producers
-

 Money2 weeks ago
Which States Have the Highest Minimum Wage in America?
-

 Technology2 weeks ago
Ranked: Semiconductor Companies by Industry Revenue Share
-

 Markets2 weeks ago
Ranked: The World’s Top Flight Routes, by Revenue
-

 Countries2 weeks ago
Population Projections: The World’s 6 Largest Countries in 2075
-

 Markets2 weeks ago
The Top 10 States by Real GDP Growth in 2023
-

 Demographics2 weeks ago
The Smallest Gender Wage Gaps in OECD Countries
-

 United States2 weeks ago
Where U.S. Inflation Hit the Hardest in March 2024