Misc
Map: The Top Tourist Attraction in Every Country
View a high resolution version of this graphic
Map: The Top Tourist Attraction in Every Country
View the high resolution version of today’s graphic by clicking here.
Even as early as a decade ago, if you were backpacking in a foreign place, it was not uncommon to rely on the wisdom printed in travel guides such as Lonely Planet or Rick Steves to choose your day-to-day activities.
“Go off the beaten path to see this secluded black sand beach that’s only used by locals.”
“See this historic city tour, because it’s a hidden treasure that you won’t find in any other guidebook.”
Tips like these felt like secrets only privy to you and other smart readers – and while you were sitting on that hidden black sand beach, you could revel in the fact that the rest of the travelling masses were stuck in a two-hour line to get into some silly tourist trap.
For better or worse, things are now very different.
The Crowdsourced Era
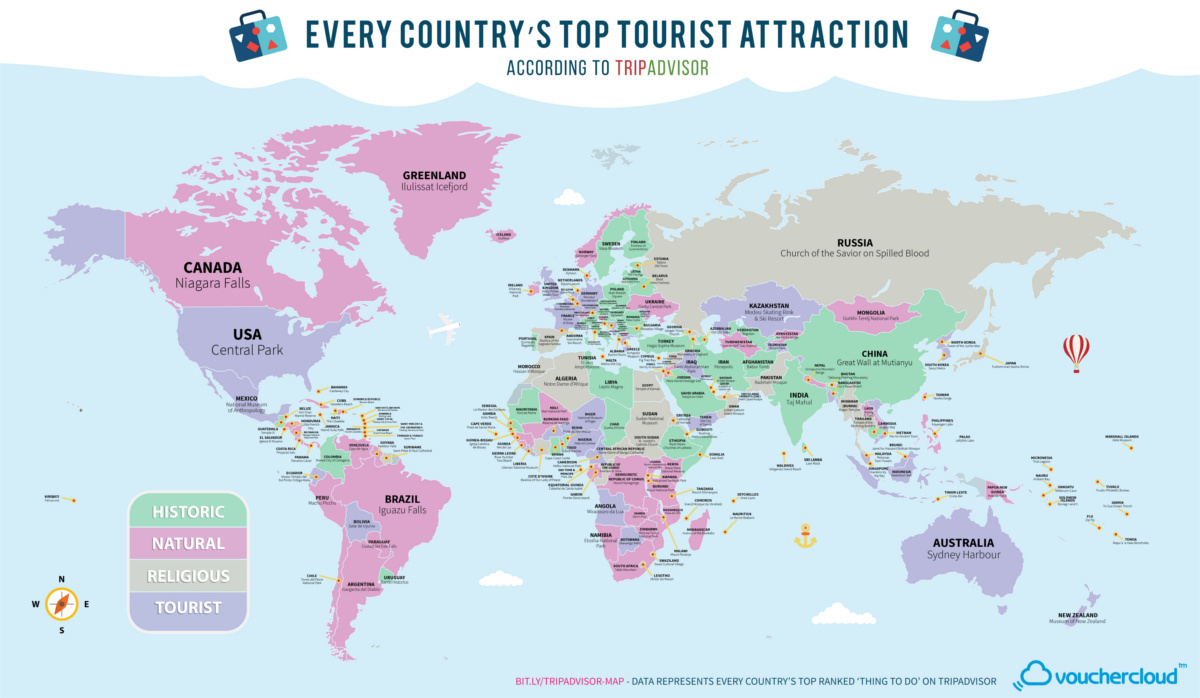
Today’s infographic comes to us from Vouchercloud, and it shows the top rated “Thing to Do” for every single country in the world, according to Tripadvisor reviews.
In other words, the list is based on the amalgamation of millions of reviews from fellow travelers that have experienced these sights or activities first-hand.
On the upside, these reviews are coming from your peers. People just like you have rated all of the attractions in an area – from tourist trap to hidden gem – and the end result is pretty fair and democratic.
But this democratic component also has a downside. In the United Kingdom, for example, the highest rated activity is not seeing Big Ben, Ancient Roman baths, Stonehenge, or the Churchill War Rooms – it’s the Harry Potter Studio Tour, with 32,000+ reviews and 83% of reviewers giving it a perfect 5-star rating.
While the Harry Potter tour is obviously a popular attraction, it’s not likely representative of the type of attractions that old school travel critics may have raved about in their travel books.
Top Things to Do
In the map, the top tourist destinations are broken down based on the type of attraction.
Here’s the mix of top destinations for the 197 countries and jurisdictions included in the analysis:
| Type of attraction | # of countries | % of countries |
|---|---|---|
| Natural | 76 | 38.6% |
| Historic | 54 | 27.4% |
| Tourist | 38 | 19.3% |
| Religious | 29 | 14.7% |
The top category of attraction is natural (38.6%), which includes places like Canada’s Niagara Falls or Norway’s Geiranger Fjord. Meanwhile, historic attractions like China’s Great Wall made up 27.4% of the total, and places of religious significance such as Thailand’s Temple of the Reclining Buddha were the top tourist attraction for 14.7% of the countries.
The remaining category, called “Tourist” includes a much wider variety of destinations within it.
These attractions range from Central Park in the New York City to the aforementioned Harry Potter Studio Tours in the United Kingdom. The wide category also includes museums like France’s Musee d’Orsay, which holds a staggering collection of impressionist art, as well as Germany’s Miniatur Wunderland, which is a massive miniature railroad in Hamburg.


Misc
Visualizing the Most Common Pets in the U.S.
Lions, tigers, and bears, oh my!—these animals do not feature on this list of popular American household pets.


Visualizing The Most Common Pets in the U.S.
This was originally posted on our Voronoi app. Download the app for free on iOS or Android and discover incredible data-driven charts from a variety of trusted sources.
In this graphic, we visualized the most common American household pets, based on 2023-2024 data from the American Pet Products Association (accessed via Forbes Advisor).
Figures represent the number of households that own each pet type, rather than the actual number of each animal. The “small animal” category includes hamsters, gerbils, rabbits, guinea pigs, chinchillas, mice, rats, and ferrets.
What is the Most Popular American Household Pet?
Based on this data, dogs—one of the first domesticated animals—are the most common pets in the United States. In fact, around 65 million households own a dog, and spend an average of $900 a year on their care.
| Rank | Species | Households |
|---|---|---|
| 1 | 🐶 Dog | 65M |
| 2 | 🐱 Cat | 47M |
| 3 | 🐟 Freshwater Fish | 11M |
| 4 | 🐰 Small Animals | 7M |
| 5 | 🐦 Bird | 6M |
| 6 | 🦎 Reptile | 6M |
| 7 | 🐴 Horse | 2M |
| 8 | 🐠 Saltwater Fish | 2M |
Note: Households can own multiple pets, and are counted for all relevant categories.
Cats rank second, at 47 million households, and these smaller felines are a little less expensive to own at $700/year according to Forbes estimates.
But aside from these two juggernauts, there are plenty of other common pet types found in households across the country.
Freshwater fish can be found in 11 million households, along with small animals—rabbits, hamsters, guinea pigs—in 7 million. Meanwhile, nearly 6 million homes have birds or reptiles.
Pet Ownership is on the Rise in America
Forbes found that 66% of all American households (numbering 87 million) own at least one pet, up from 56% in 1988. One third of these (29 million) own multiple pets.
A combination of factors is driving this increase: rising incomes, delayed childbirth, and of course the impact of the pandemic which nearly cleared out animal shelters across the globe.
America’s loneliness epidemic may also be a factor. Fledgling research has shown that single-individual households with pets recorded lower rates of loneliness during the pandemic than those without a pet.

-

 Brands6 days ago
How Tech Logos Have Evolved Over Time
-

 Demographics2 weeks ago
The Smallest Gender Wage Gaps in OECD Countries
-

 Economy2 weeks ago
Where U.S. Inflation Hit the Hardest in March 2024
-

 Green2 weeks ago
Top Countries By Forest Growth Since 2001
-

 United States2 weeks ago
Ranked: The Largest U.S. Corporations by Number of Employees
-

 Maps2 weeks ago
The Largest Earthquakes in the New York Area (1970-2024)
-

 Green2 weeks ago
Ranked: The Countries With the Most Air Pollution in 2023
-

 Green2 weeks ago
Ranking the Top 15 Countries by Carbon Tax Revenue