Energy
This Map Shows Which States Will Benefit From Solar Eclipse Tourism
This Map Shows Which States Will Benefit From Solar Eclipse Tourism
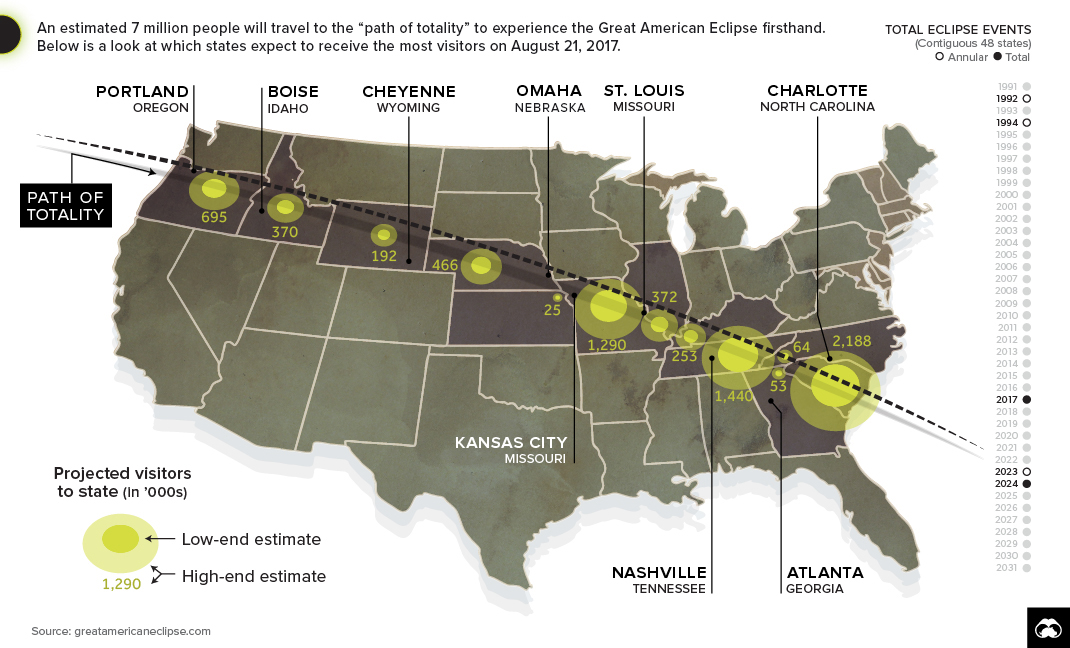
On August 21st, millions of Americans will migrate to towns along the path of the upcoming solar eclipse. The Great American Eclipse will stretch over 12 states, and it’s already being called the greatest temporary mass migration to see a natural event in U.S. history.
The last total eclipse occurred in the United States in 1979, and businesses are cashing in on the pent-up enthusiasm for this extremely rare celestial event.
Here are some high payoffs that “eclipse boom towns” are hoping for:
| City / Town | State | Population | Projected Visitors | Est. Economic Impact |
|---|---|---|---|---|
| Madras | OR | 6,200 | 100,000+ | $9 million |
| Carbondale | IL | 26,000 | 55,000+ | $7 million |
| Nashville | TN | 684,410 | 50,000+ | $15 million |
| Hopkinsville | KY | 32,000 | 100,000+ | $30 million |
Many of the towns in the path of totality have been aggressively marketing themselves to potential onlookers. One town, Hopkinsville, KY, has branded itself as “Eclipseville” leading up to the occasion. It’s likely to payoff, since it’s been reported that visitors from 19 countries and 46 states are descending upon the small town for the perfect glimpse of the phenomenon.
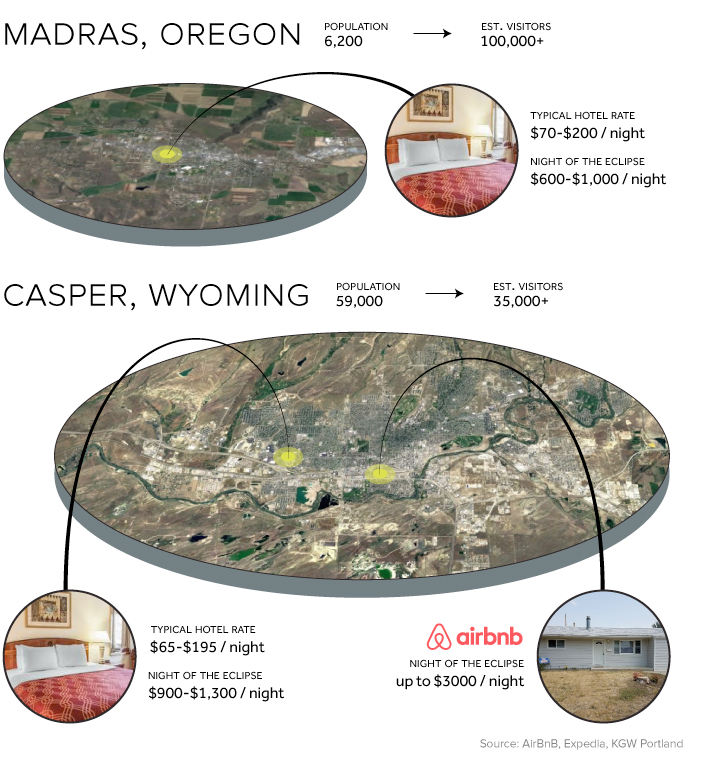
As another example, the sleepy agricultural town of Madras, OR, has an entire festival devoted to the solar eclipse. Appropriately named Oregon Solarfest and running from August 17-22, the festival takes advantage of the town’s perfect location in the high desert of Central Oregon and typical clear skies. Although it’s hard to really determine how many people are coming for the solar eclipse – Madras anticipates over 100,000 visitors, and millions of dollars pouring into the town’s economy.
Astronomical Prices
Accommodation and short-term rentals are skyrocketing thanks to the eclipse craze. Hotels along the route have been 95% booked since 2013, so remaining rooms are going at a premium. Here are a couple examples:
Airbnb reports that over 40,000 guests have been booked along the path of totality so far, with Nashville and towns in South Carolina making up nearly half of that activity.
Total Eclipse of the Grid
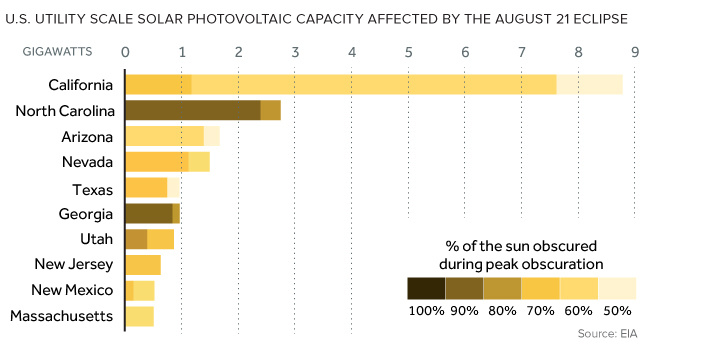
The other big impact the eclipse will have is on the U.S. power grid – particularly in states that have a higher reliance on solar energy.
Out of 1,900 power plants, only 17 of them are in the path of totality (mostly in eastern Oregon), but hundreds of others will be at least 90% obscured (mostly around North Carolina and Georgia).
More than 100 million solar panels are expected to be affected, dropping output by 20% — equivalent to all the energy the city of San Francisco uses in a week.
At first glance, the eclipse might seem like a major headache for utilities, power generators, and grid operators. However, David Shepheard, a managing director at Accenture, sees it instead as a rare opportunity for a “forecastable dress rehearsal” for dealing with major grid interruptions. Some companies are even using the brief interruption to measure exactly how much rooftop solar power is actually connected to their grids.
Party like it’s 2024
If you aren’t able to watch the upcoming eclipse, don’t worry. The next total solar eclipse in the United States will take place in 2024. (You may want to book your room now though!)


Energy
Mapped: The Age of Energy Projects in Interconnection Queues, by State
This map shows how many energy projects are in interconnection queues by state and how long these projects have been queued up, on average.


Age of Energy Projects in Interconnection Queues, by State
This was originally posted on our Voronoi app. Download the app for free on iOS or Android and discover incredible data-driven charts from a variety of trusted sources.
By the end of 2023, more than 11,000 energy projects were in interconnection queues in the United States, waiting for a green-light from regional grid operators to proceed with construction.
This map, created in partnership with the National Public Utilities Council, maps out the average age of active energy projects in interconnection queues by state, using data from Berkeley Lab.
Interconnection Queues, Explained
Interconnection queues are lists of energy projects that have made interconnection requests to their regional grid operators. Once submitted, these requests formally initiate the impact study process that each project goes through before grid connection, forming waiting lists for approval known as interconnection queues.
In recent years, both the number and generation capacity of queued projects have surged in the United States, along with the length of time spent in queue.
According to Berkeley Lab, the amount of generation capacity entering queues each year has risen by more than 550% from 2015 to 2023, with average queue duration rising from 3 years to 5 years the same period.
As a result of the growing backlog, a large proportion of projects ultimately withdraw from queues, leading to only 19% of applications reaching commercial operations.
The Backlog: Number of Projects and Average Wait Times
Of the 11,000 active projects in U.S. queues at the end of 2023, Texas, California, and Virginia had the most in queue; 1,208, 947, and 743, respectively.
When looking at the average ages of these projects, all three states hovered around the national average of 34 months (2.83 years), with Texas sporting 28 months, California 33, and Virginia 34.
Vermont, Minnesota, Wisconsin, and Florida, on the other hand, had the highest average queue durations; 54, 49, 47, and 46 months, respectively.
Average Queue Duration by Project Type
At the end of 2023, more than 95% of the generation capacity in active interconnection queues was for emission-free resources. The table below provides a breakdown.
| Project Type | Average Queue Duration (As of 12/31/2023) | Number of Projects in Queue |
|---|---|---|
| Wind | 40 months | 841 |
| Solar | 34 months | 4,506 |
| Wind+Battery | 34 months | 76 |
| Solar+Battery | 27 months | 2,377 |
| Battery | 24 months | 2,818 |
Wind projects had the highest wait times at the end of 2023 with an average age of 40 months (3.33 years). Solar projects, on the other hand, made up more than 40% of projects in queue.
Overall, reducing the time that these renewable energy projects spend in queues can accelerate the transition to a low-carbon energy future.
According to the U.S. Department of Energy, enhancing data transparency, streamlining approval processes, promoting economic efficiency, and maintaining a reliable grid are some of the ways this growing backlog can be mitigated.

-

 Technology7 days ago
Visualizing AI Patents by Country
-

 Green2 weeks ago
Ranking the Top 15 Countries by Carbon Tax Revenue
-

 Markets2 weeks ago
U.S. Debt Interest Payments Reach $1 Trillion
-

 Mining2 weeks ago
Gold vs. S&P 500: Which Has Grown More Over Five Years?
-

 Uranium2 weeks ago
The World’s Biggest Nuclear Energy Producers
-

 Misc2 weeks ago
How Hard Is It to Get Into an Ivy League School?
-

 Debt2 weeks ago
How Debt-to-GDP Ratios Have Changed Since 2000
-

 Culture2 weeks ago
The Highest Earning Athletes in Seven Professional Sports