Energy
The Countries Suffering Most From Low Oil Prices

var divElement = document.getElementById(‘viz1500394387603’); var vizElement = divElement.getElementsByTagName(‘object’)[0]; vizElement.style.width=’1154px’;vizElement.style.height=’929px’; var scriptElement = document.createElement(‘script’); scriptElement.src = ‘https://public.tableau.com/javascripts/api/viz_v1.js’; vizElement.parentNode.insertBefore(scriptElement, vizElement);
The Countries Suffering Most From Low Oil Prices
As Warren Buffet says, “Only when the tide goes out do you discover who’s been swimming naked.”
And in 2014, when oil prices crashed and burned, the tide was gone – and it was shown that too many countries were relying on frothy oil revenues to balance out their trade deficits.
A Lingering Crisis
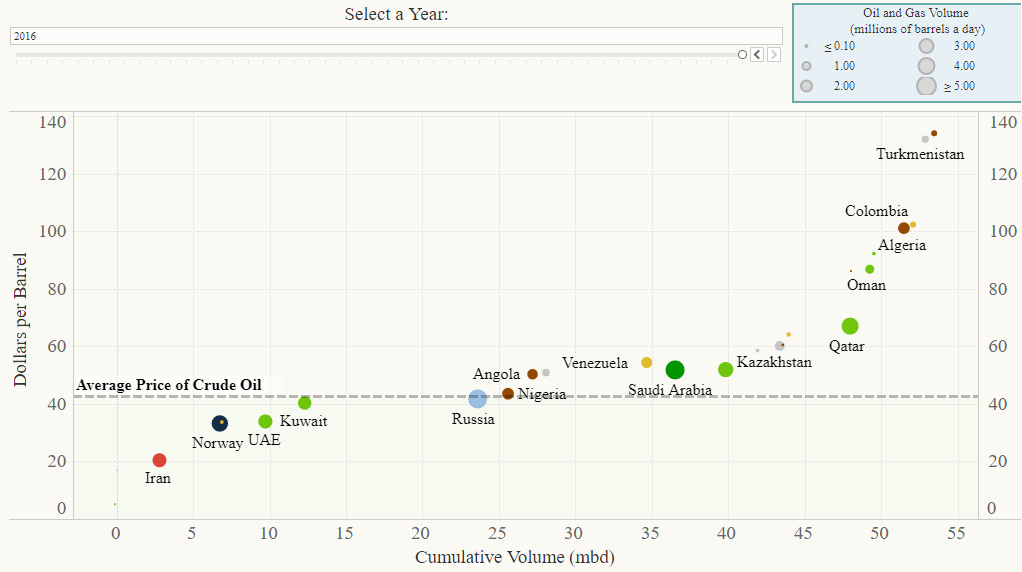
Fast forward to today, and low oil prices are still causing big problems for many countries. The above interactive visualization from the Council of Foreign Relations shows how the world economies most reliant on oil exports have fared since the 2014 crash.
The end results are not pretty – and even in 2016, there were 18 economies that had breakeven prices (based on spending on imports) that were above the average oil price for the year:
| Country | 2016 Breakeven Price (Based on Imports) | Difference from Avg. Oil Price |
|---|---|---|
| Libya | $134.10 | -$91.29 |
| Turkmenistan | $132.00 | -$89.19 |
| Colombia | $102.30 | -$59.49 |
| Algeria | $101.10 | -$58.29 |
| Bahrain | $92.30 | -$49.49 |
| Oman | $86.80 | -$43.99 |
| Chad | $86.20 | -$43.39 |
| Qatar | $67.00 | -$24.19 |
| Kazakhstan | $64.10 | -$21.29 |
| Gabon | $60.50 | -$17.69 |
| Trinidad & Tobago | $60.20 | -$17.39 |
| Brunei | $58.50 | -$15.69 |
| Venezuela | $54.40 | -$11.59 |
| Iraq | $51.90 | -$9.09 |
| Saudi Arabia | $51.80 | -$8.99 |
| Azerbaijan | $50.90 | -$8.09 |
| Angola | $50.30 | -$7.49 |
| Nigeria | $43.50 | -$0.69 |
The oil price crash made many oil-reliant economies more fragile, and this fragility can be triggered in different ways. One interesting case study is Venezuela, which is currently embroiled in an ongoing economic, currency, and humanitarian crisis.
Bad Timing for Maduro
During the Hugo Chávez era, sky-high oil prices enabled fiscal and trade policies that subsidized Venezuelan life in many ways. That all changed in 2014, which was only one year after Nicolás Maduro took office.
Despite having largely the same policies as his predecessor, low oil prices have hammered the Venezuelan economy. Even with today’s prices, oil generates an estimated 95% of export revenues for the country. This has resulted in a disaster for the socialist nation, and Venezuela is now stuck with shortages in essential goods, crushing unemployment, a contracting economy, skyrocketing crime and murder rates, and even widespread malnutrition.
At the root of much of this, arguably, is an uncontrollable cycle of hyperinflation:
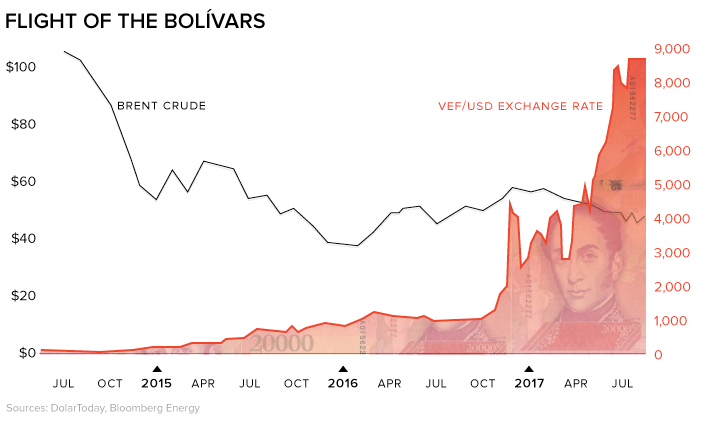
With an economy that is a runaway train, the government prints more and more cash to try to maintain the status quo. This almost never works, and last year it even led us to publish a chart comparing Venezuelan hyperinflation with that of Weimar Germany.
According to DolarToday.com, a website that tracks the black market rate for Venezuelan currency, it takes 8,470 bolívars to buy US$1 today. Right before the oil crash this was closer to 65 bolívars.
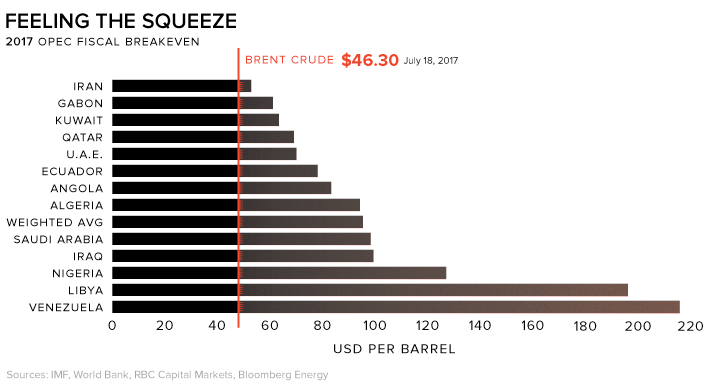
A Lost Cause
While many oil dependent nations are working to diversify or ride out low oil prices in other ways, it seems unlikely that the crisis in Venezuela will be reversed anytime soon.
Here’s the full fiscal breakeven needed by OPEC producers, including Venezuela, to help normalize things:


Energy
Charted: 4 Reasons Why Lithium Could Be the Next Gold Rush
Visual Capitalist has partnered with EnergyX to show why drops in prices and growing demand may make now the right time to invest in lithium.


4 Reasons Why You Should Invest in Lithium
Lithium’s importance in powering EVs makes it a linchpin of the clean energy transition and one of the world’s most precious minerals.
In this graphic, Visual Capitalist partnered with EnergyX to explore why now may be the time to invest in lithium.
1. Lithium Prices Have Dropped
One of the most critical aspects of evaluating an investment is ensuring that the asset’s value is higher than its price would indicate. Lithium is integral to powering EVs, and, prices have fallen fast over the last year:
| Date | LiOH·H₂O* | Li₂CO₃** |
|---|---|---|
| Feb 2023 | $76 | $71 |
| March 2023 | $71 | $61 |
| Apr 2023 | $43 | $33 |
| May 2023 | $43 | $33 |
| June 2023 | $47 | $45 |
| July 2023 | $44 | $40 |
| Aug 2023 | $35 | $35 |
| Sept 2023 | $28 | $27 |
| Oct 2023 | $24 | $23 |
| Nov 2023 | $21 | $21 |
| Dec 2023 | $17 | $16 |
| Jan 2024 | $14 | $15 |
| Feb 2024 | $13 | $14 |
Note: Monthly spot prices were taken as close to the 14th of each month as possible.
*Lithium hydroxide monohydrate MB-LI-0033
**Lithium carbonate MB-LI-0029
2. Lithium-Ion Battery Prices Are Also Falling
The drop in lithium prices is just one reason to invest in the metal. Increasing economies of scale, coupled with low commodity prices, have caused the cost of lithium-ion batteries to drop significantly as well.
In fact, BNEF reports that between 2013 and 2023, the price of a Li-ion battery dropped by 82%.
| Year | Price per KWh |
|---|---|
| 2023 | $139 |
| 2022 | $161 |
| 2021 | $150 |
| 2020 | $160 |
| 2019 | $183 |
| 2018 | $211 |
| 2017 | $258 |
| 2016 | $345 |
| 2015 | $448 |
| 2014 | $692 |
| 2013 | $780 |

3. EV Adoption is Sustainable
One of the best reasons to invest in lithium is that EVs, one of the main drivers behind the demand for lithium, have reached a price point similar to that of traditional vehicle.
According to the Kelly Blue Book, Tesla’s average transaction price dropped by 25% between 2022 and 2023, bringing it in line with many other major manufacturers and showing that EVs are a realistic transport option from a consumer price perspective.
| Manufacturer | September 2022 | September 2023 |
|---|---|---|
| BMW | $69,000 | $72,000 |
| Ford | $54,000 | $56,000 |
| Volkswagon | $54,000 | $56,000 |
| General Motors | $52,000 | $53,000 |
| Tesla | $68,000 | $51,000 |
4. Electricity Demand in Transport is Growing
As EVs become an accessible transport option, there’s an investment opportunity in lithium. But possibly the best reason to invest in lithium is that the IEA reports global demand for the electricity in transport could grow dramatically by 2030:
| Transport Type | 2022 | 2025 | 2030 |
|---|---|---|---|
| Buses 🚌 | 23,000 GWh | 50,000 GWh | 130,000 GWh |
| Cars 🚙 | 65,000 GWh | 200,000 GWh | 570,000 GWh |
| Trucks 🛻 | 4,000 GWh | 15,000 GWh | 94,000 GWh |
| Vans 🚐 | 6,000 GWh | 16,000 GWh | 72,000 GWh |
The Lithium Investment Opportunity
Lithium presents a potentially classic investment opportunity. Lithium and battery prices have dropped significantly, and recently, EVs have reached a price point similar to other vehicles. By 2030, the demand for clean energy, especially in transport, will grow dramatically.
With prices dropping and demand skyrocketing, now is the time to invest in lithium.
EnergyX is poised to exploit lithium demand with cutting-edge lithium extraction technology capable of extracting 300% more lithium than current processes.

-

 Lithium4 days ago
Ranked: The Top 10 EV Battery Manufacturers in 2023
Asia dominates this ranking of the world’s largest EV battery manufacturers in 2023.
-

 Energy1 week ago
The World’s Biggest Nuclear Energy Producers
China has grown its nuclear capacity over the last decade, now ranking second on the list of top nuclear energy producers.
-

 Energy1 month ago
The World’s Biggest Oil Producers in 2023
Just three countries accounted for 40% of global oil production last year.
-

 Energy1 month ago
How Much Does the U.S. Depend on Russian Uranium?
Currently, Russia is the largest foreign supplier of nuclear power fuel to the U.S.
-

 Uranium2 months ago
Charted: Global Uranium Reserves, by Country
We visualize the distribution of the world’s uranium reserves by country, with 3 countries accounting for more than half of total reserves.
-

 Energy3 months ago
Visualizing the Rise of the U.S. as Top Crude Oil Producer
Over the last decade, the United States has established itself as the world’s top producer of crude oil, surpassing Saudi Arabia and Russia.


-

 Debt1 week ago
How Debt-to-GDP Ratios Have Changed Since 2000
-

 Markets2 weeks ago
Ranked: The World’s Top Flight Routes, by Revenue
-

 Countries2 weeks ago
Population Projections: The World’s 6 Largest Countries in 2075
-

 Markets2 weeks ago
The Top 10 States by Real GDP Growth in 2023
-

 Demographics2 weeks ago
The Smallest Gender Wage Gaps in OECD Countries
-

 United States2 weeks ago
Where U.S. Inflation Hit the Hardest in March 2024
-

 Green2 weeks ago
Top Countries By Forest Growth Since 2001
-

 United States2 weeks ago
Ranked: The Largest U.S. Corporations by Number of Employees