Energy
Fusion: Will Humanity Ever Harness Star Power?
Fusion is the epitome of “high risk, high reward” scientific research.
If we were to ever successfully harness the forces that power the stars, mankind could have access to power that is almost literally too cheap to meter. However, reaching that goal will be a very expensive, long-term commitment – and it’s also very possible that we may never achieve a commercially viable method of fusion power generation.
Today’s video, by the talented team at Kurzgesagt, explains how fusion works, what experiments are ongoing, and the pros and cons of pursuing fusion power generation.
How Fusion Works
Fusion involves heating nuclei of atoms – usually isotopes of hydrogen – to temperatures in the millions of degrees. At extreme temperatures, atoms are stripped of their electrons and nuclei move so quickly that they overcome their “mutual repulsion”, joining together to form a heavier nucleus. This process gives off massive amounts of energy that investors and researchers hope will propel mankind into an era of cheap and abundant electricity, but without the downsides of many other forms of energy.
I would like nuclear fusion to become a practical power source. It would provide an inexhaustible supply of energy, without pollution or global warming.
– Stephen Hawking, award-winning theoretical physicist
Stars are so large that fusion occurs naturally in their cores – but here on Earth, we’re trying a number of complex methods in the hopes of replicating that process to achieve positive net energy.
The Cost of Bottling a Star
The International Thermonuclear Experimental Reactor (ITER), an experimental reactor currently being built in the south of France, will house the world’s largest ever tokamak – a doughnut-shaped reactor that uses a powerful magnetic field to confine plasma. Construction of the facility began in 2013 and is expected to cost €20 billion upon completion in 2021.
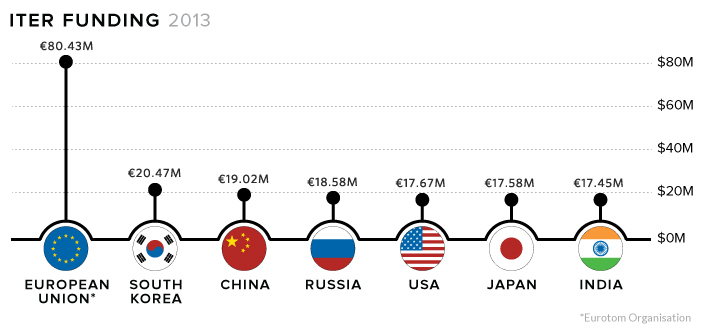
Research organizations see ITER as a crucial step in realizing fusion. Though the facility is not designed to generate electricity, it would pave the way for functional reactors.
Competition is Heating Up
There are some who claim that the bureaucracy of government-funded labs is hampering the process. As a result, there is a pack of private companies, fueled by high-profile investors, looking to make commercially-viable fusion into a reality.
Tri Alpha, a company in southern California, is hoping their method of spinning magnetized plasma inside a containment vessel will be a lower-cost method of power generation than ITER. In 2015, they held super-heated hydrogen plasma in a stable state for 5 milliseconds, which is a huge deal in the world of fusion research. The company has attracted over $500 million in investment in the past 20 years, and has the backing of Microsoft co-founder, Paul Allen.
Helion Energy, located in Redmond, Washington, believes they are only a few years away from creating nuclear fusion that can be used as a source for electricity. Their reaction is created by colliding two plasma balls made of hydrogen atom cores at one million miles per hour. Helion Energy’s ongoing research is funded in part by the U.S. Department of Energy’s ARPA-E program, which the Trump administration slated for elimination. Thankfully, Helion still counts Peter Thiel’s Mithril Capital and Y Combinator as supporters.
General Fusion, located in Burnaby, B.C., is taking a different approach. Their piston-based reactor is designed to create energy bursts lasting thousandths of seconds, rather than a sustained plasma reaction. Heat recovered bursts would be used to generate electricity much like nuclear power plants, minus the long-term radioactive waste. General Fusion has attracted millions of dollars in funding, including investment from Bezos Expeditions and the Business Development Bank of Canada.
Time Horizon
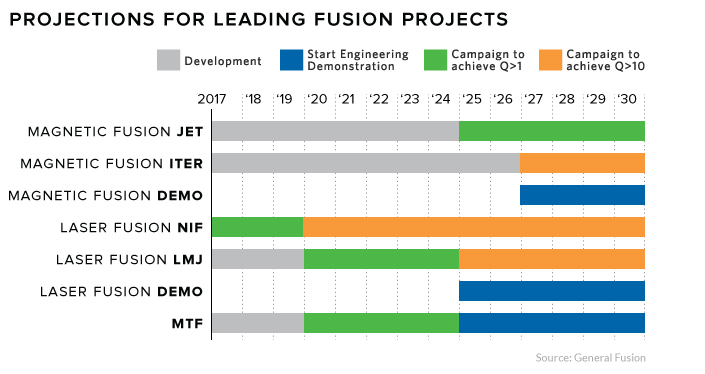
Though commercially viable fusion is still a long way off, each new technological breakthrough brings us one step closer. With such a massive payoff for success, research will likely only increase as we get closer to bottling a star here on Earth.


Energy
Mapped: The Age of Energy Projects in Interconnection Queues, by State
This map shows how many energy projects are in interconnection queues by state and how long these projects have been queued up, on average.


Age of Energy Projects in Interconnection Queues, by State
This was originally posted on our Voronoi app. Download the app for free on iOS or Android and discover incredible data-driven charts from a variety of trusted sources.
By the end of 2023, more than 11,000 energy projects were in interconnection queues in the United States, waiting for a green-light from regional grid operators to proceed with construction.
This map, created in partnership with the National Public Utilities Council, maps out the average age of active energy projects in interconnection queues by state, using data from Berkeley Lab.
Interconnection Queues, Explained
Interconnection queues are lists of energy projects that have made interconnection requests to their regional grid operators. Once submitted, these requests formally initiate the impact study process that each project goes through before grid connection, forming waiting lists for approval known as interconnection queues.
In recent years, both the number and generation capacity of queued projects have surged in the United States, along with the length of time spent in queue.
According to Berkeley Lab, the amount of generation capacity entering queues each year has risen by more than 550% from 2015 to 2023, with average queue duration rising from 3 years to 5 years the same period.
As a result of the growing backlog, a large proportion of projects ultimately withdraw from queues, leading to only 19% of applications reaching commercial operations.
The Backlog: Number of Projects and Average Wait Times
Of the 11,000 active projects in U.S. queues at the end of 2023, Texas, California, and Virginia had the most in queue; 1,208, 947, and 743, respectively.
When looking at the average ages of these projects, all three states hovered around the national average of 34 months (2.83 years), with Texas sporting 28 months, California 33, and Virginia 34.
Vermont, Minnesota, Wisconsin, and Florida, on the other hand, had the highest average queue durations; 54, 49, 47, and 46 months, respectively.
Average Queue Duration by Project Type
At the end of 2023, more than 95% of the generation capacity in active interconnection queues was for emission-free resources. The table below provides a breakdown.
| Project Type | Average Queue Duration (As of 12/31/2023) | Number of Projects in Queue |
|---|---|---|
| Wind | 40 months | 841 |
| Solar | 34 months | 4,506 |
| Wind+Battery | 34 months | 76 |
| Solar+Battery | 27 months | 2,377 |
| Battery | 24 months | 2,818 |
Wind projects had the highest wait times at the end of 2023 with an average age of 40 months (3.33 years). Solar projects, on the other hand, made up more than 40% of projects in queue.
Overall, reducing the time that these renewable energy projects spend in queues can accelerate the transition to a low-carbon energy future.
According to the U.S. Department of Energy, enhancing data transparency, streamlining approval processes, promoting economic efficiency, and maintaining a reliable grid are some of the ways this growing backlog can be mitigated.

-

 Wealth6 days ago
Charted: Which City Has the Most Billionaires in 2024?
-

 Mining2 weeks ago
Gold vs. S&P 500: Which Has Grown More Over Five Years?
-

 Uranium2 weeks ago
The World’s Biggest Nuclear Energy Producers
-

 Education2 weeks ago
How Hard Is It to Get Into an Ivy League School?
-

 Debt2 weeks ago
How Debt-to-GDP Ratios Have Changed Since 2000
-

 Sports2 weeks ago
The Highest Earning Athletes in Seven Professional Sports
-

 Science2 weeks ago
Visualizing the Average Lifespans of Mammals
-

 Brands1 week ago
How Tech Logos Have Evolved Over Time