Misc
The Most Congested Cities in the World
Click here for a larger version of the infographic:
The Most Congested Cities
For a higher resolution version of this infographic, click here.
No matter what city you live in, traffic is something you probably dread being stuck in.
Whether it is the slow-moving I-95 in New York City or the molasses-like trip from East Hollywood to Santa Monica in L.A., it’s estimated that traffic congestion costs the United States alone a whopping sum of $300 billion per year in gas and time.
The World’s Worst Traffic
Which city has the ultimate distinction of having the world’s most horrific traffic?
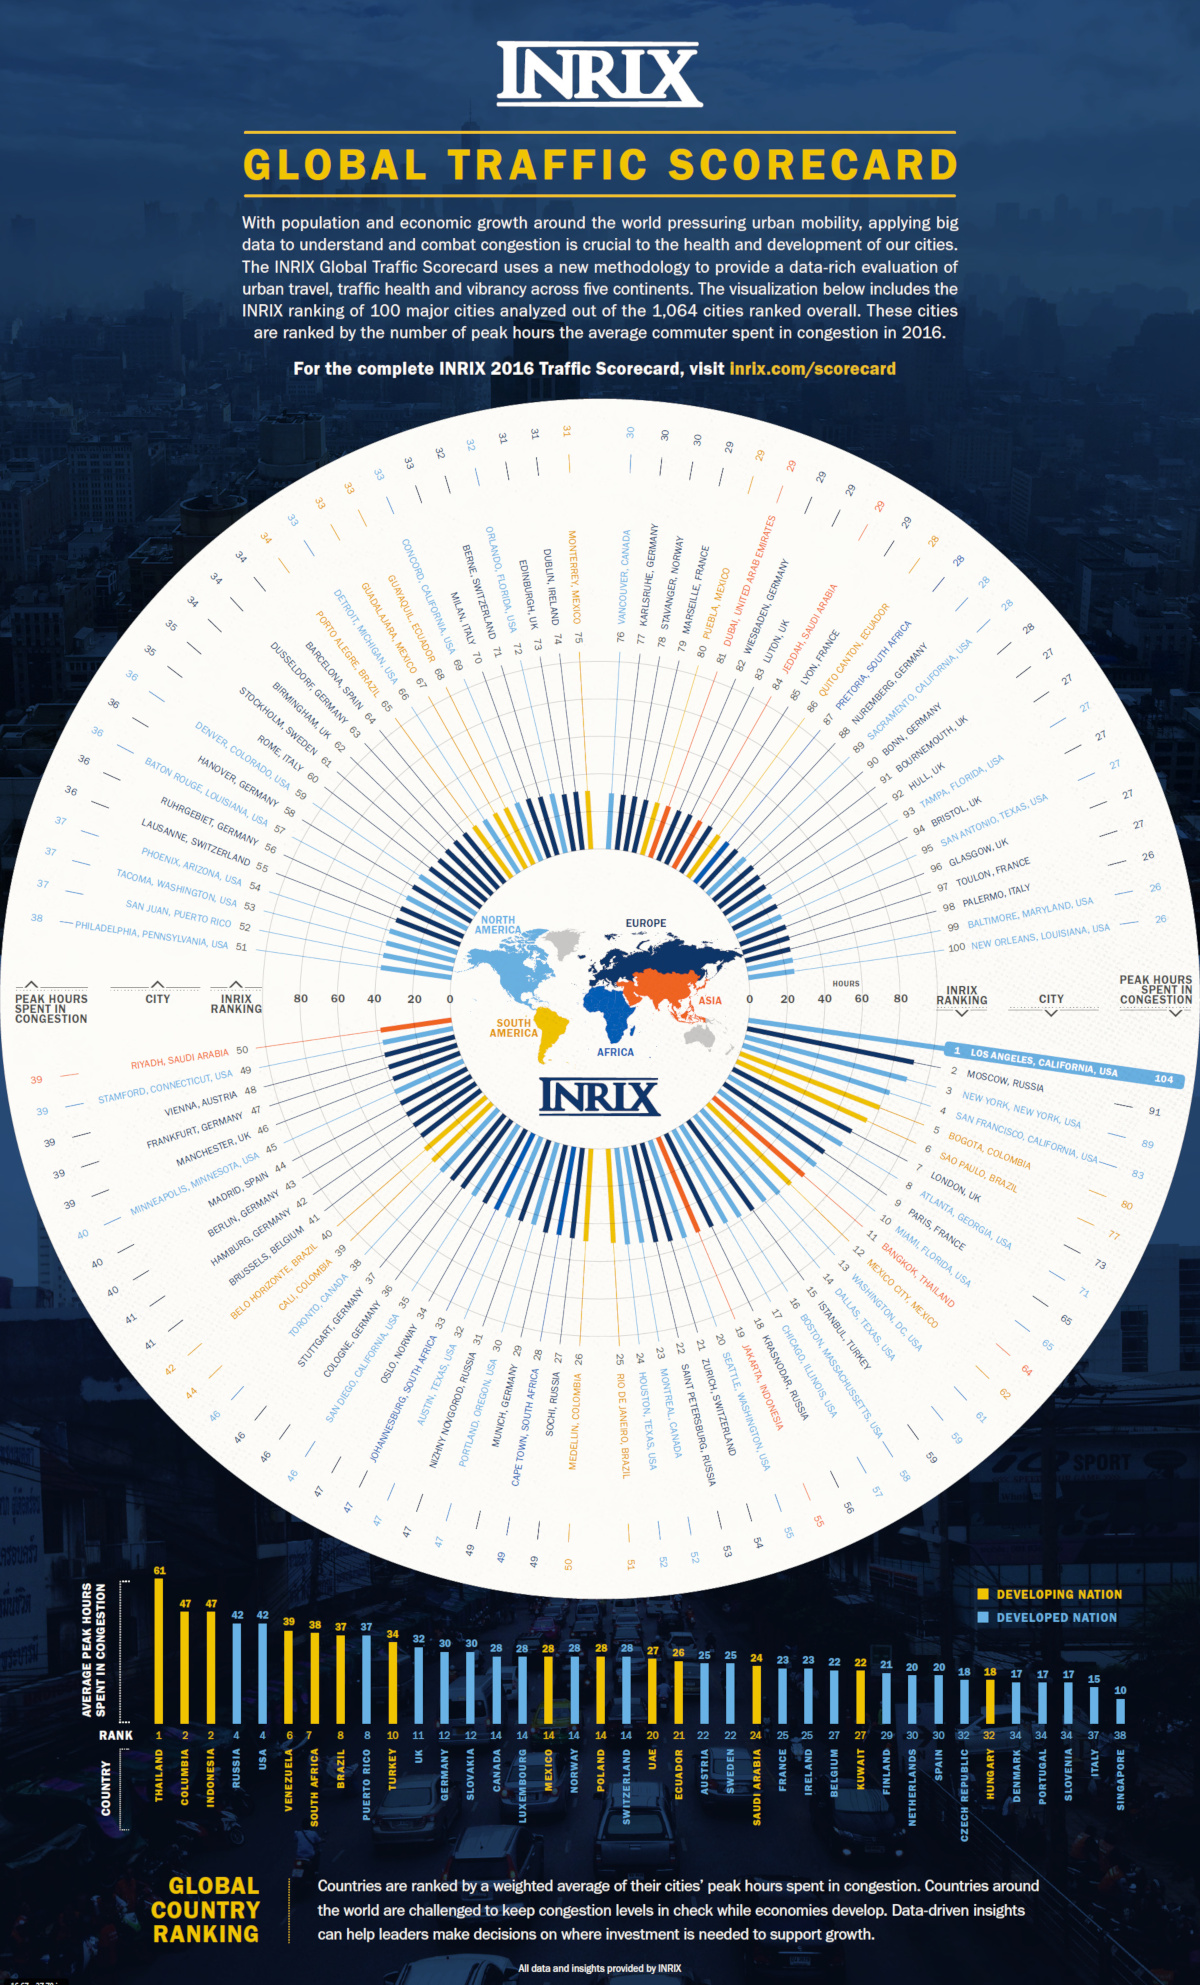
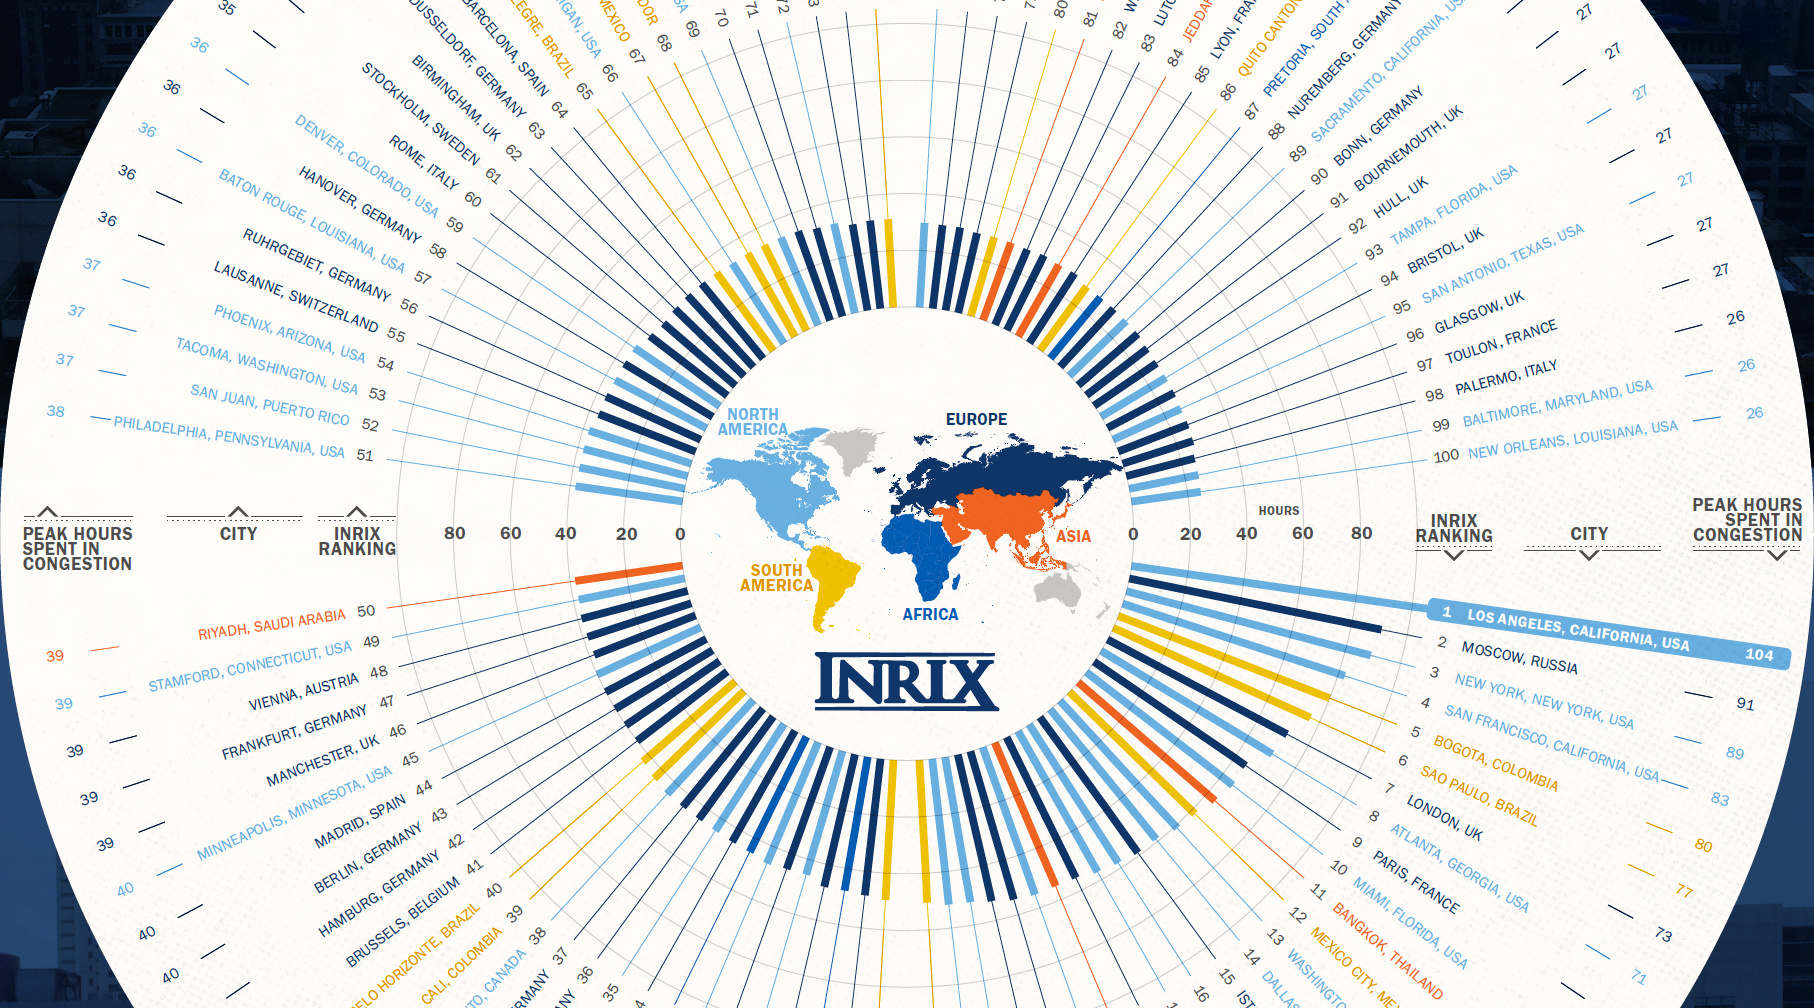
Today’s infographic comes to us from INRIX via their Global Traffic Scorecard 2016, and it highlights the most congested cities around the globe. The report looks at average hours spent in congestion for 1,064 cities in 38 countries, as well as the percent of time spent in traffic.
Here’s a Top 10 list you don’t want to see your city on:
| Rank | City | Country | Hours Spent in Congestion | Driving Time in Congestion |
|---|---|---|---|---|
| #1 | Los Angeles | USA | 104.1 | 13% |
| #2 | Moscow | Russia | 91.4 | 25% |
| #3 | New York | USA | 89.4 | 13% |
| #4 | San Francisco | USA | 82.6 | 13% |
| #5 | Bogota | Colombia | 79.8 | 32% |
| #6 | Sao Paulo | Brazil | 77.2 | 21% |
| #7 | London | UK | 73.4 | 13% |
| #8 | Magnitogorsk | Russia | 71.1 | 42% |
| #9 | Atlanta | USA | 70.8 | 10% |
| #10 | Paris | France | 65.3 | 11% |
Taking the top spot was Los Angeles, where drivers spent an average 104 hours stuck in the city’s legendary traffic jams. The cost of this congestion, measured in wasted time and fuel, was $9.7 billion – a number that works out to $2,408 per driver!


Misc
Visualizing the Most Common Pets in the U.S.
Lions, tigers, and bears, oh my!—these animals do not feature on this list of popular American household pets.


Visualizing The Most Common Pets in the U.S.
This was originally posted on our Voronoi app. Download the app for free on iOS or Android and discover incredible data-driven charts from a variety of trusted sources.
In this graphic, we visualized the most common American household pets, based on 2023-2024 data from the American Pet Products Association (accessed via Forbes Advisor).
Figures represent the number of households that own each pet type, rather than the actual number of each animal. The “small animal” category includes hamsters, gerbils, rabbits, guinea pigs, chinchillas, mice, rats, and ferrets.
What is the Most Popular American Household Pet?
Based on this data, dogs—one of the first domesticated animals—are the most common pets in the United States. In fact, around 65 million households own a dog, and spend an average of $900 a year on their care.
| Rank | Species | Households |
|---|---|---|
| 1 | 🐶 Dog | 65M |
| 2 | 🐱 Cat | 47M |
| 3 | 🐟 Freshwater Fish | 11M |
| 4 | 🐰 Small Animals | 7M |
| 5 | 🐦 Bird | 6M |
| 6 | 🦎 Reptile | 6M |
| 7 | 🐴 Horse | 2M |
| 8 | 🐠 Saltwater Fish | 2M |
Note: Households can own multiple pets, and are counted for all relevant categories.
Cats rank second, at 47 million households, and these smaller felines are a little less expensive to own at $700/year according to Forbes estimates.
But aside from these two juggernauts, there are plenty of other common pet types found in households across the country.
Freshwater fish can be found in 11 million households, along with small animals—rabbits, hamsters, guinea pigs—in 7 million. Meanwhile, nearly 6 million homes have birds or reptiles.
Pet Ownership is on the Rise in America
Forbes found that 66% of all American households (numbering 87 million) own at least one pet, up from 56% in 1988. One third of these (29 million) own multiple pets.
A combination of factors is driving this increase: rising incomes, delayed childbirth, and of course the impact of the pandemic which nearly cleared out animal shelters across the globe.
America’s loneliness epidemic may also be a factor. Fledgling research has shown that single-individual households with pets recorded lower rates of loneliness during the pandemic than those without a pet.

-

 Science1 week ago
Visualizing the Average Lifespans of Mammals
-

 Markets2 weeks ago
The Top 10 States by Real GDP Growth in 2023
-

 Demographics2 weeks ago
The Smallest Gender Wage Gaps in OECD Countries
-

 United States2 weeks ago
Where U.S. Inflation Hit the Hardest in March 2024
-

 Green2 weeks ago
Top Countries By Forest Growth Since 2001
-

 United States2 weeks ago
Ranked: The Largest U.S. Corporations by Number of Employees
-

 Maps2 weeks ago
The Largest Earthquakes in the New York Area (1970-2024)
-

 Green2 weeks ago
Ranked: The Countries With the Most Air Pollution in 2023