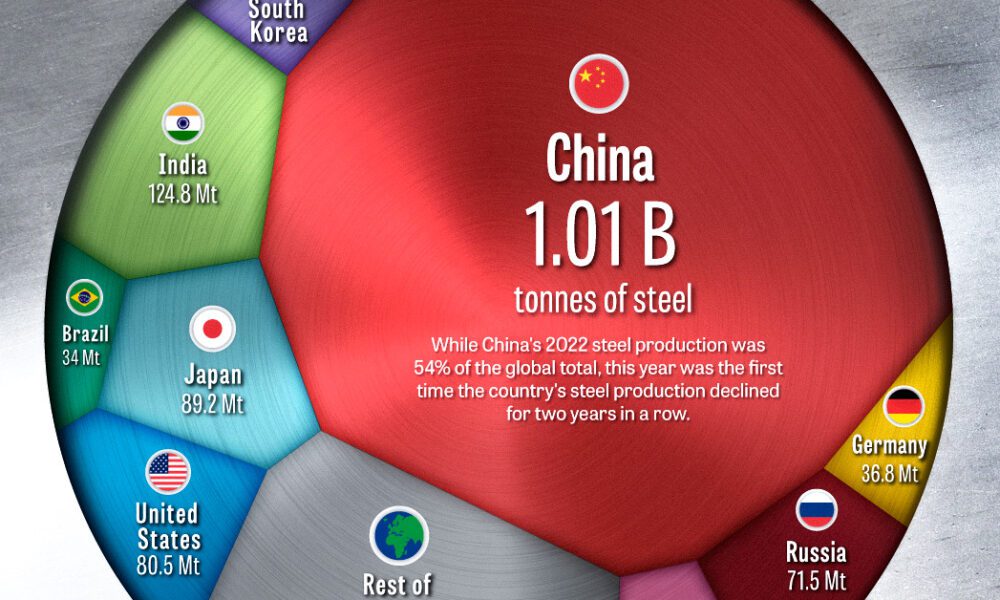
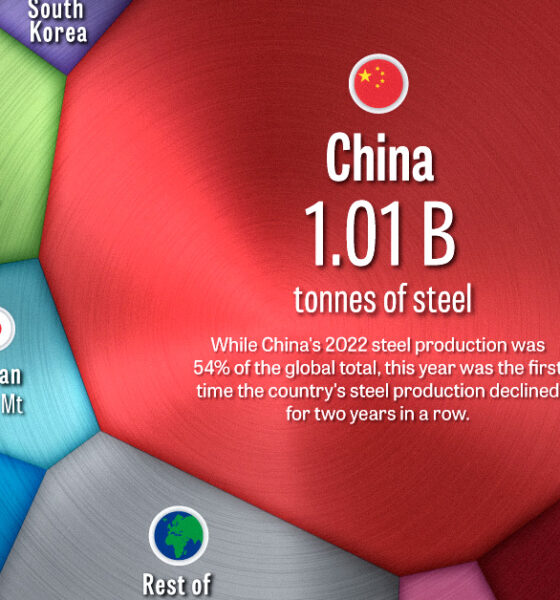
China has dominated global steel production the past few decades, but how did the country get here, and is its...
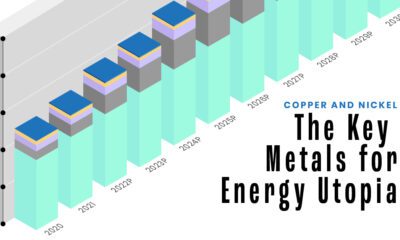

With more renewables and EVs plugging into the grid, copper and nickel are essential building blocks for the energy transition.
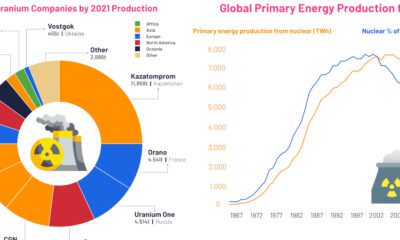

These visuals highlight the uranium mining industry and its output, as well as the trajectory of nuclear energy from 1960 to today.


Many new technologies critical to the energy transition rely on copper. Here are the world's largest copper producers.
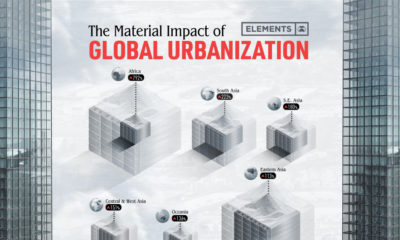

The world’s material consumption is expected to grow from 41 billion tonnes in 2010 to about 89 billion tonnes by 2050. This graphic shows the impact...
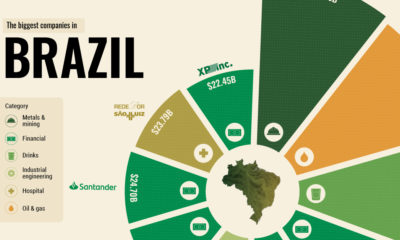

What drives some of the world’s emerging economies? From natural resources to giant banks, here are the top 10 biggest companies in Brazil.
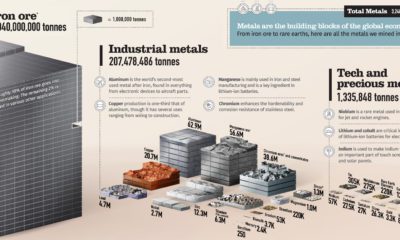

From iron ore to rare earths, over 3 billion tonnes of metals are mined each year. This chart shows them all on a relative scale.
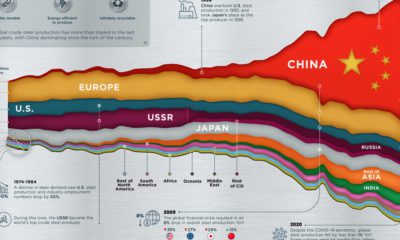

Global steel production has tripled over the past 50 years, with China's steel production eclipsing the rest of the world.
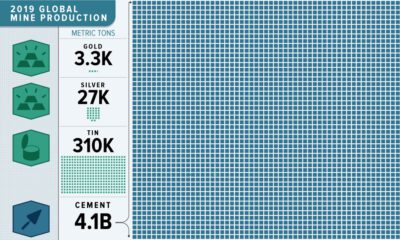

This massive infographic reveals the dramatic scale of 2019 non-fuel mineral global production.
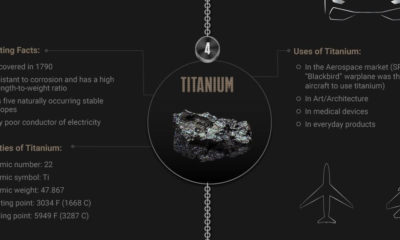

There are 91 elements that are defined as metals but not all are the same. Here is a breakdown of the top 10 strongest metals and...


 Creator Program