Markets
The World’s Biggest Real Estate Bubbles in 2018
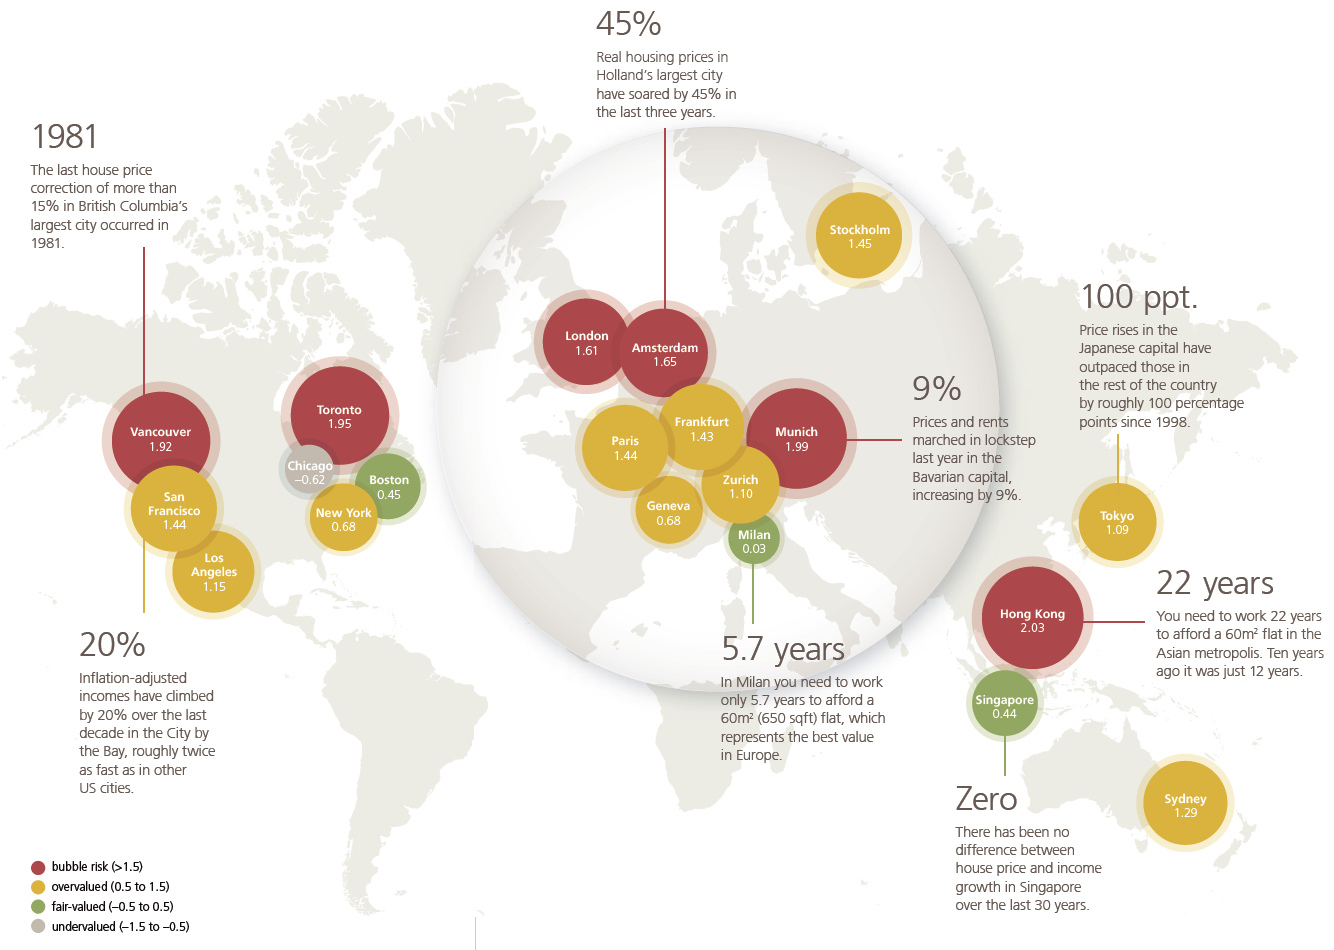
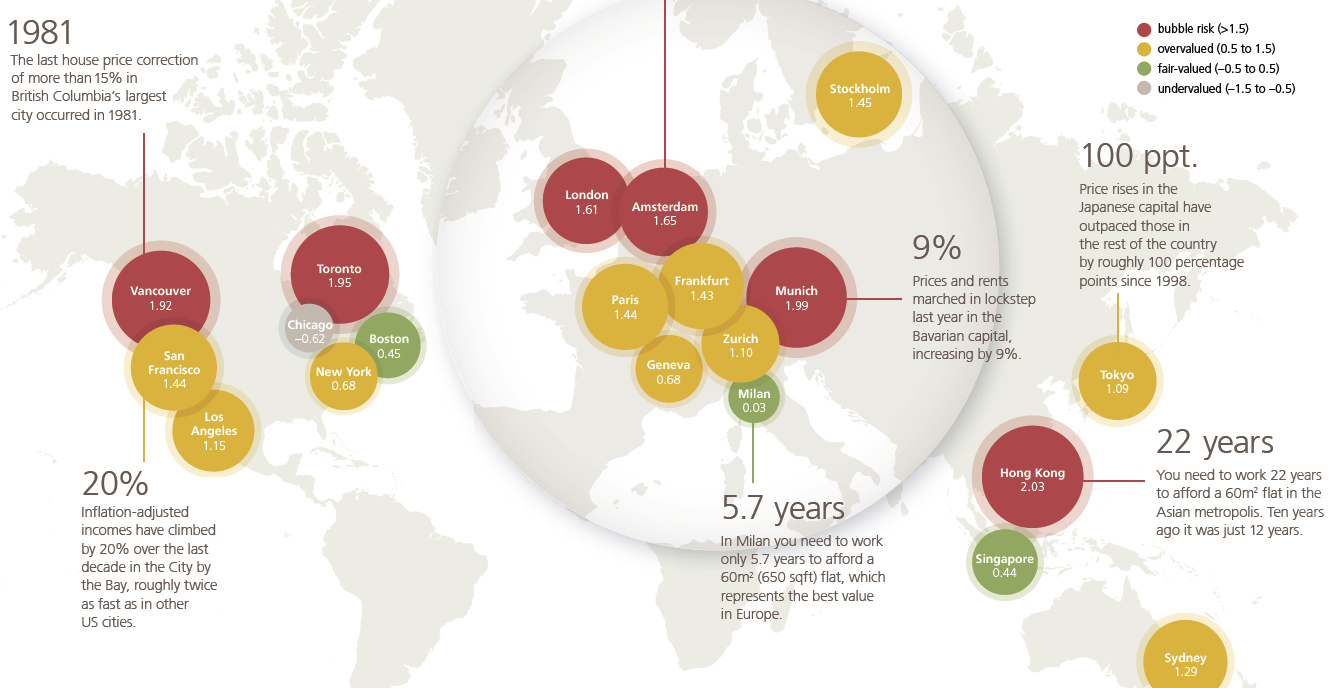
Note: Cities with a “Bubble Risk” (>1.5) are shown in red
Courtesy: UBS
The World’s Biggest Real Estate Bubbles in 2018
With the current stock market bull run reaching nearly 10 years in length, it’s understandable that many investors are nervous about the end of the party coming sooner than later.
However, as UBS notes in its latest report, there is also growing concern about another prominent bubble that’s been in the works since the aftermath of the financial crisis.
Large amounts of easy money have fueled real estate bubbles in the world’s major cities – and the Swiss investment bank now sees the property markets in six global cities as being at risk.
The Bubble Index
In the 2018 edition of the bank’s Real Estate Bubble Index, here are the major cities around the globe that are in or near bubble territory:
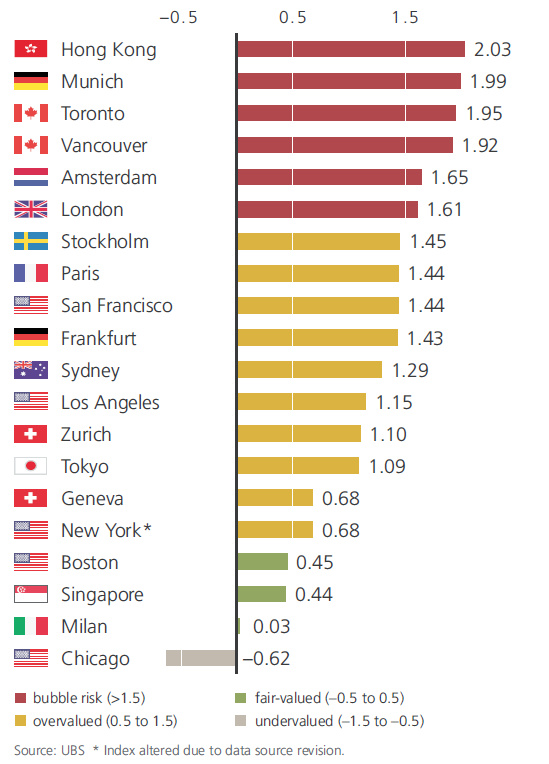
Any city with a score over 1.5 is considered at “Bubble Risk”, and right now those include two cities from Canada, one from Asia, and three from Europe.
Hong Kong (2.03) tops the index this year, leaping past Munich (1.99), Toronto (1.95), and Vancouver (1.92) which all remain at bubble risk themselves. Amsterdam and London are the two other cities that score higher than a 1.5 on the rankings.
It’s also very important to note that there are four cities that score just under the 1.5 threshold: Stockholm (1.45), Paris (1.44), San Francisco (1.44), and Frankfurt (1.43).
A Coming Correction?
Investor and writer Howard Marks has noted in recent months that the wider market is in its “8th inning”, and the same case could be made for real estate.
Historically, investors have had to be alert to rising interest rates, which have served as the main trigger of corrections.
– UBS Report
According to UBS, the cracks are already starting to show at the top end of the market, with housing prices declining in half of last year’s list of bubble cities. Some of the worrying factors include rising interest rates, as well as growing political tensions as the crisis of affordability makes it harder for average people to live in these global financial centers.
Here is annualized growth in percent over the last year, as well for the last five years for cities in the index:
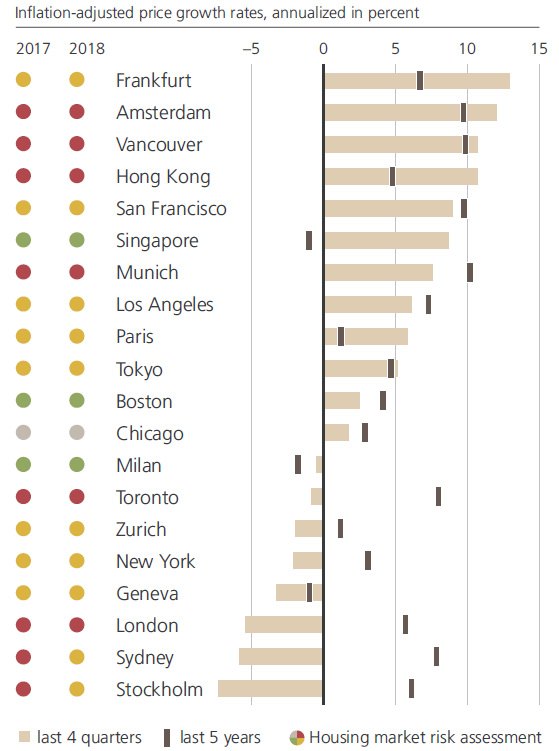
As you can see, some of these cities have had negative growth over the last 12 months, including New York, Toronto, Sydney, London, and Stockholm.
Charting Specific Markets
In Hong Kong, you need to work 22 years to afford a 645 sq. ft (60m²) apartment, when that took just 12 years just a decade ago. In recent years, Hong Kong’s ascent to becoming one of the biggest real estate bubbles has become very evident, especially when juxtaposed with Singapore:
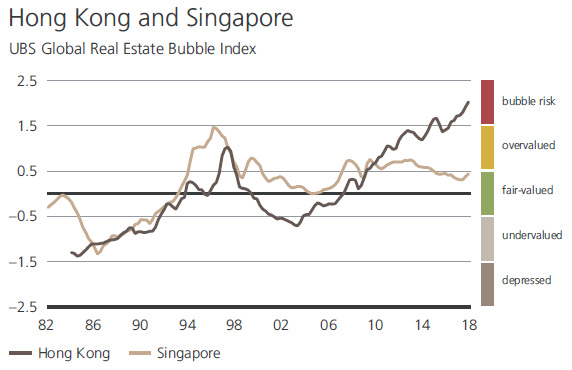
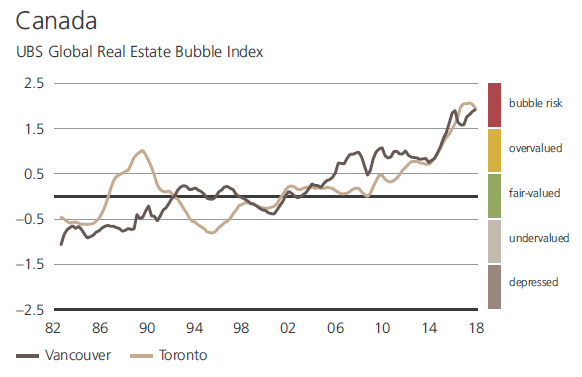
In Canada, the two cities in the index are starting to go in alternate directions, although recent signs also point to a potential slowdown in Vancouver:
Finally, the U.S. market – which felt the pain of the housing crash in the late 2000s – is home to zero cities in the bubble risk category, according to UBS.
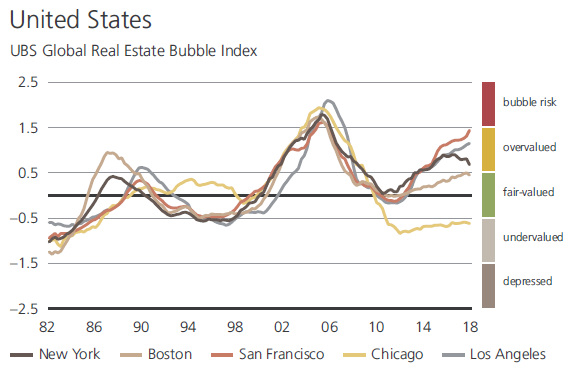
Whether it is a bubble or not, many people agree that San Francisco’s housing situation is still a crisis. In the Bay Area hub, 60% of all rental units are in rental-controlled buildings, and the median single-family house price is a hefty $1.7 million.


Markets
The European Stock Market: Attractive Valuations Offer Opportunities
On average, the European stock market has valuations that are nearly 50% lower than U.S. valuations. But how can you access the market?


European Stock Market: Attractive Valuations Offer Opportunities
Europe is known for some established brands, from L’Oréal to Louis Vuitton. However, the European stock market offers additional opportunities that may be lesser known.
The above infographic, sponsored by STOXX, outlines why investors may want to consider European stocks.
Attractive Valuations
Compared to most North American and Asian markets, European stocks offer lower or comparable valuations.
| Index | Price-to-Earnings Ratio | Price-to-Book Ratio |
|---|---|---|
| EURO STOXX 50 | 14.9 | 2.2 |
| STOXX Europe 600 | 14.4 | 2 |
| U.S. | 25.9 | 4.7 |
| Canada | 16.1 | 1.8 |
| Japan | 15.4 | 1.6 |
| Asia Pacific ex. China | 17.1 | 1.8 |
Data as of February 29, 2024. See graphic for full index names. Ratios based on trailing 12 month financials. The price to earnings ratio excludes companies with negative earnings.
On average, European valuations are nearly 50% lower than U.S. valuations, potentially offering an affordable entry point for investors.
Research also shows that lower price ratios have historically led to higher long-term returns.
Market Movements Not Closely Connected
Over the last decade, the European stock market had low-to-moderate correlation with North American and Asian equities.
The below chart shows correlations from February 2014 to February 2024. A value closer to zero indicates low correlation, while a value of one would indicate that two regions are moving in perfect unison.
| EURO STOXX 50 | STOXX EUROPE 600 | U.S. | Canada | Japan | Asia Pacific ex. China |
|
|---|---|---|---|---|---|---|
| EURO STOXX 50 | 1.00 | 0.97 | 0.55 | 0.67 | 0.24 | 0.43 |
| STOXX EUROPE 600 | 1.00 | 0.56 | 0.71 | 0.28 | 0.48 | |
| U.S. | 1.00 | 0.73 | 0.12 | 0.25 | ||
| Canada | 1.00 | 0.22 | 0.40 | |||
| Japan | 1.00 | 0.88 | ||||
| Asia Pacific ex. China | 1.00 |
Data is based on daily USD returns.
European equities had relatively independent market movements from North American and Asian markets. One contributing factor could be the differing sector weights in each market. For instance, technology makes up a quarter of the U.S. market, but health care and industrials dominate the broader European market.
Ultimately, European equities can enhance portfolio diversification and have the potential to mitigate risk for investors.
Tracking the Market
For investors interested in European equities, STOXX offers a variety of flagship indices:
| Index | Description | Market Cap |
|---|---|---|
| STOXX Europe 600 | Pan-regional, broad market | €10.5T |
| STOXX Developed Europe | Pan-regional, broad-market | €9.9T |
| STOXX Europe 600 ESG-X | Pan-regional, broad market, sustainability focus | €9.7T |
| STOXX Europe 50 | Pan-regional, blue-chip | €5.1T |
| EURO STOXX 50 | Eurozone, blue-chip | €3.5T |
Data is as of February 29, 2024. Market cap is free float, which represents the shares that are readily available for public trading on stock exchanges.
The EURO STOXX 50 tracks the Eurozone’s biggest and most traded companies. It also underlies one of the world’s largest ranges of ETFs and mutual funds. As of November 2023, there were €27.3 billion in ETFs and €23.5B in mutual fund assets under management tracking the index.
“For the past 25 years, the EURO STOXX 50 has served as an accurate, reliable and tradable representation of the Eurozone equity market.”
— Axel Lomholt, General Manager at STOXX
Partnering with STOXX to Track the European Stock Market
Are you interested in European equities? STOXX can be a valuable partner:
- Comprehensive, liquid and investable ecosystem
- European heritage, global reach
- Highly sophisticated customization capabilities
- Open architecture approach to using data
- Close partnerships with clients
- Part of ISS STOXX and Deutsche Börse Group
With a full suite of indices, STOXX can help you benchmark against the European stock market.
Learn how STOXX’s European indices offer liquid and effective market access.

-

 Economy2 days ago
Economic Growth Forecasts for G7 and BRICS Countries in 2024
The IMF has released its economic growth forecasts for 2024. How do the G7 and BRICS countries compare?
-

 Markets1 week ago
U.S. Debt Interest Payments Reach $1 Trillion
U.S. debt interest payments have surged past the $1 trillion dollar mark, amid high interest rates and an ever-expanding debt burden.
-

 United States2 weeks ago
Ranked: The Largest U.S. Corporations by Number of Employees
We visualized the top U.S. companies by employees, revealing the massive scale of retailers like Walmart, Target, and Home Depot.
-

 Markets2 weeks ago
The Top 10 States by Real GDP Growth in 2023
This graphic shows the states with the highest real GDP growth rate in 2023, largely propelled by the oil and gas boom.
-

 Markets2 weeks ago
Ranked: The World’s Top Flight Routes, by Revenue
In this graphic, we show the highest earning flight routes globally as air travel continued to rebound in 2023.
-

 Markets2 weeks ago
Ranked: The Most Valuable Housing Markets in America
The U.S. residential real estate market is worth a staggering $47.5 trillion. Here are the most valuable housing markets in the country.


-

 Energy1 week ago
The World’s Biggest Nuclear Energy Producers
-

 Money2 weeks ago
Which States Have the Highest Minimum Wage in America?
-

 Technology2 weeks ago
Ranked: Semiconductor Companies by Industry Revenue Share
-
Markets2 weeks ago
Ranked: The World’s Top Flight Routes, by Revenue
-

 Countries2 weeks ago
Population Projections: The World’s 6 Largest Countries in 2075
-
Markets2 weeks ago
The Top 10 States by Real GDP Growth in 2023
-

 Demographics2 weeks ago
The Smallest Gender Wage Gaps in OECD Countries
-

 United States2 weeks ago
Where U.S. Inflation Hit the Hardest in March 2024